

Paper Menu >>
Journal Menu >>
 Journal of Minerals & Materials Characterization & Engineering, Vol. 11, No.5, pp.519-527, 2012 jmmce.org Printed in the USA. All rights reserved 519 Incorporation of Acetoacetanilide Crystal s in Host PMMA Polymer Matrix and Characterizations of the Hyb rid Composit e Sharada G. Prabhu1* and B.Manjunatha Pattabi2 1Dept. of Physics NMAM Institute of Technology, Nitte- 574 110, India. 2Dept. of Materials Science, Mangalore University, Mangalagangotri- 574 199, India. *Corresponding author e-mail [email protected]. ABSTRACT Blending of polymer with organic/inorganic material has given a new direction for developing novel materials. This is an easy and inexpensive method of modifying various properties of the individual materials and composites. The aim of the present work is an attempt to incorporate crystals in polymer host and investigate the effect, on optical properties of the of polymer- crystal combine. In this paper a novel technique of incorporating inorganic/organic crystal in a host polymer matrix is reported. Crystals of acetoacetanilide (AA) are grown in the host Poly Methyl Methacrelate (PMMA) by simple evaporation technique. The scanning electron micrograph (SEM) studies reveal the growth of Acetoacetanilide crystals of varying sizes and shapes (flakes) in prepared samples. The results are confirmed by various spectroscopic characterization studies such as X-ray diffraction (XRD), Fourier Transform Infrared Spectroscopy (FT-IR) and the UV-Vis spectroscopy. The investigations carried out, show a change in optical absorption band edge which is attributed due to change in band gap because of crystal sizes. Key words: Polymer composite, Optical properties, PMMA-acetoacetanilide composite, Nano composites, Spectroscopic techniques. 1. INTRODUCTION Inorganic/organic hybrid materials have attracted increasing interests due to their unique optical and electronic properties [1-6]. Organic crystals have a narrow transparency and exhibit low thermal and mechanical resistance. It is established that the polymers are excellent host  520 Sharada G. Prabhu and B.Manjunatha Pattabi Vol.11, No.5 materials. When the nano-particles are embedded or encapsulated in polymer, the polymer acts as surface capping agent. In addition, the particle size is controlled well within the desired regime. For application in opto-electronics and electronics, the control of particle size and their uniform distribution within the polymer is the key to technology based on the nano-particles in polymers. With these advantages of organic cr ystal and polymer, a new approach, the growth of organic crystals in polymer matrix has been contemplated. This approach is intended to combine the properties of both classes of material that is the organic acetoacetanilide and the polymer PMMA. The authors herein describe the technique of incorporating acetoacetanilide crystals in PMMA m atrix and to st udy th e effect on the optical propert ies o f acetan ilide crystals due to the presence of the host PMMA. Various spectroscopic and morphological techniques are useful in characterizing the nano-composites. In the present paper the preparation, characterisation of the nano-composites and the effect on optical properties of acetoacetanilide crystals due to the presence of polymer matrix have been reported. The results are demonstrated by X-ray diffraction (XRD), Fourier Transform Infrared Spectroscopy (FT-IR) and the UV-Vis spectroscopy and scanning electron microscopy (SEM) studies. 2. EXPERIMENTAL 2.1 General Research grade Acetoacetanilide and PMMA from Merck are used to prepare the composites. Using JEOL JD8p Visual XRD, (with automation software:VISX122D), with cu Kα of -λ= 1.5405 Ǻ (30KV) as a source, the Xrd data has been recorded. The FT-IR spectroscop y analysis has been carried out using Nicolet AVATAR 330 FT-IR instrument in the wave number range from 400cm-1 to 4000cm-1. Shimadzu UV-Vis –NIR Spectrophotometer model 3101 PC has b een emplo yed fo r UV-Vi s m easu rem en ts . JEOL JSM- 5800 LV scanning electron microscope (SEM) has been used to obtain the microimages of the crystals-polymer composites. 2.2 Preparation of Acetoacetanilide-PMMA Co mp o s it e s The res earch grad e mate ri als o f aceto acetan ilid e a nd PM MA have be en p rocu red fro m M erk an d Co. To prepare the PMMA solution 10gm of PMMA is dissolved in 20 ml of double distilled water. A homogeneous transparent solution of PMMA is obtained after the solution is stirred continuously at room temperature for 6-8 hours. Then 5 ml of PMMA solution is taken in a beaker. A saturated solution of acetoacetanilide in chloroform is prepared and filtered. 5 ml of the filtered solution is mixed with the polymer solution in the beaker and stirred to obtain a uniform and homogeneous mixture. The blend is obtained by casting the prepared mixture into a glass petri dish and left for slow evaporation. The resulting thin sheet of acetoacetanilide and PMMA combined obtained (PM-AA), peels off the petri dish when completely dried. Two 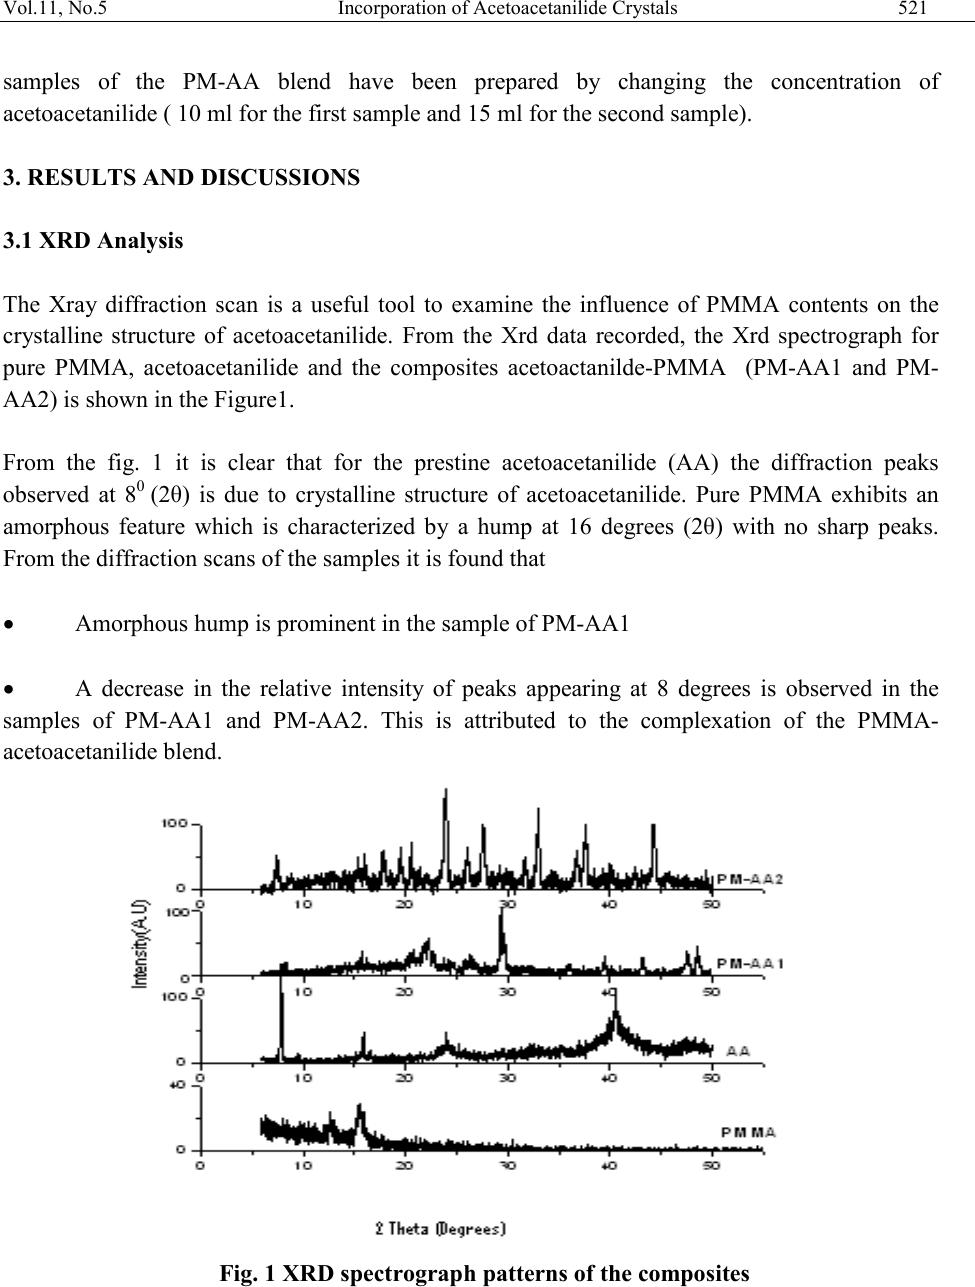 Vol.11, No.5 Incorporation of Acetoacetanilide Crystals 521 samples of the PM-AA blend have been prepared by changing the concentration of acetoacetanilide ( 10 ml for the first sample and 15 ml for the second sample). 3. RESULTS AND DISCUSSIONS 3.1 XRD Analysis The Xray diffraction scan is a useful tool to examine the influence of PMMA contents on the crystalline structure of acetoacetanilide. From the Xrd data recorded, the Xrd spectrograph for pure PMMA, acetoacetanilide and the composites acetoactanilde-PMMA (PM-AA1 and PM- AA2) is shown in the Figure1. From the fig. 1 it is clear that for the prestine acetoacetanilide (AA) the diffraction peaks observed at 80 (2θ) is due to crystalline structure of acetoacetanilide. Pure PMMA exhibits an amorphous feature which is characterized by a hump at 16 degrees (2θ) with no sharp peaks. From the diffraction scans of the samples it is found that • Amorphous hump is prominent in the sample of PM-AA1 • A decrease in the relative intensity of peaks appearing at 8 degrees is observed in the samples of PM-AA1 and PM-AA2. This is attributed to the complexation of the PMMA- acetoacetanilide blend. Fig. 1 XRD spectrograph patterns of the composites  522 Sharada G. Prabhu and B.Manjunatha Pattabi Vol.11, No.5 The peaks in Xray diffraction patterns of the PM-AA combined are well in agreement with that of acetoacetanilide. More peaks are observed in the prepared composite PM-AA2 than the pristine acetoacetanilide. This may be due to the presence of crystals of bigger sizes and orientation. In the XRD pattern of PM-AA1, broadening of peaks is seen. This is attributed to the presen ce of t he cr ystal lites of smal ler si zes. Large inten sit y peaks and the in crease i n 7-8].the number of peaks observed in the sample of PMAA-2 are correlated to a high degree of orientation [ 3.2 FT-IR Studies The FT-IR spectrographs of PMMA-AA composites are depicted in Fig. 2. Fig. 2 FT-IR of PM-AA composites In the spectra of the PM-AA blend characteristic absorption bands have been identified and assigned, by comparison with the pristine acetoacetanilide and P MMA. T hes e band s are l ist ed in the table 1. The details of functional groups of PMMA are a sharp intense peak at 1731 cm-1 appeared due to the presence of ester carbonyl group stretching vibration. The broad peak ranging from 1260-1000 cm-1 is owing to the bending of C-O stretching vibration. The stretching vibration is shown by the presence of a broad peak between 3100-2900 cm-1. In spectra of acetoacetanilide the absorption peak appearing at 1650 cm-1 is due to NH bending and the CH bending at 1425 cm-1. The IR spectra of the PM-AA composites (Sample 1 and Sample 2) show the major peaks observed in the individual PMMA and acetoacetanilide, with a small shift and change in the intensity of the observed peaks . This confirms the presence of acetoacetanilide crystals in PMMA matrix [9-10].  Vol.11, No.5 Incorporation of Acetoacetanilide Crystals 523 Table 1. Characteristic absorption peaks of PMMA, AA and the composite PMMA-AA PMMA Acetoacetanil ide Composite PM-AA1 and PM- AA2 Peak position cm-1 Bond Assignment Peak Position cm-1 Bond Assignment Peak Position cm-1 Bond Assignment 752 ---CH 3300 --OH Stretching 3252 --OH Stretching 987 Bending (C-O) 2950 CH aliphatic str 2948 CH aliphatic str 1650 NH bending 1597 NH Bending 1200 (C-O)Stretching 1425 CH bending 1200 (C-O) Str 1723 Stretching C=O 1723 Str C=O 3.3 UV-Vis Spectral Analysis The UV-Vis spectral data recorded in the wavelength range from 200-3000 nm for the pure and PM-AA composites samples are shown in the Fig. 3. 050100 150 200 250 300 350 400450 500 550 600 0 1 2 3 4 5 6 7 [240 nm ]PM- AA2 [360 nm ] AA [310 nm ] PM-AA1 Absorbance [arb.u] W avelength (nm ) Fig. 3 UV-Vis Absorption spectra of Pure A A an d composi te PM-AA Samples The strong absorption peaks are evident from the UV absorption spectr a of the samples sho wn in Fig. 3. A sharp absorption peak is exhibited by acetoacetanilide at 360 nm. The addition of  524 Sharada G. Prabhu and B.Manjunatha Pattabi Vol.11, No.5 acetoacetanilide in the host polymer environment causes the growth of crystals that is realized in very strong absorption peaks in the PM-AA1 sam ple at 240 nm and a peak at 310 nm in the case of the PM-AA2 sample. This suggests the blue shi ft in the absorption edge of acetoacetanilide in the polymer matrix (PM-AA1 and PM-AA2) with respect to bulk ac etoacetanilide. The observed blue shift indicates decrease in particle size. Energy band of materials is related to absorption coefficient α by the Tauc relation (αhν)=A(hν-Eg)n . Where A is a constant, hν is the photon energy, Eg is the band gap and n is an index which assumes values ½, 3/2, 2 or 3 d epending on the nature of electronic transition responsible fo r the absorption. By taking the least index n=1/2 , (αhν)2 and hν in eV, the plot at room temperature shows a linear behaviour of the absorption edge. The extrapolation of the li near part of the curve on X axis gives the energy gap. The plot made for the samples (PM-AA1, PM-AA2) is shown in the Fig. 4. 2.5 3.0 3.54.0 4.55.0 5.56.0 6.5 -50 0 50 100 150 200 250 300 350 400 3.25 eV3.75 eV4.95 eV PM-AA2 PM-AA1 Bulk AA (αhν) 2 E g eV Fig . 4 (αhν)2 and hν plot for the samples of PM-AA The optical energy gap for the samples of PM-AA1 and PM-AA2 is increased to 3.75 eV and 4.95 eV respectively compared to bulk AA, which is 3.25 eV [11-12]. The absorption peaks and the calculat ed energy gap from the absorption peaks (Fig. 3) and the energy gap from (αhν)2 and hν plot for the bulk AA and composites of PM-AA1 and PM-AA2 are tabulated in the table. 2 shown below.  Vol.11, No.5 Incorporation of Acetoacetanilide Crystals 525 Table. 2. Absorption peaks and Energy Gap of acetoacetanilide and the composites of PM- AA. Samples Absorption peaks [λ Vs Absorbance] Calculated energy gap E g in eV Energy gap in eV [(αhν)2 Vs E g plot] AA 360 nm 3.45 3.25 PM-AA1 240 nm 5.175 4.95 PM-AA2 310 nm 4 3.75 3.4 SEM Analysis The morphology of PM-AA blends has been studied using SEM. The SEM image of PM-AA sample is shown in Figure 5. (a) (b) Fig. 5 SEM micrograph images of PM-AA1 (a) and PM-AA2(b) composites  526 Sharada G. Prabhu and B.Manjunatha Pattabi Vol.11, No.5 The SEM images of PM-AA1 and PM-AA2 samples are shown in the Figure 5. The images show pl at e type ( flak es) cr ystals with high crystal density. This is attributed to the agglomeration of smaller crystals [13] due to high surface to volume ratio of the crystals. 3.5 SHG Meas urement The second harmonic generation (SHG) measurement using the 1.06 μm pulsed radiation of a Nd:YAG laser, as a fundamental wave has been carried out. It is demonstrated that PMMA and acetoacetanilide are both non-linear and has second harmonic conversion efficiency. The blends of PM-AA1 and PM-AA2 samples do not show an y second order conversion. That is the second harmonic conversion efficiency is absolutely absent [14] for the composites of PM-AA. 4. CONCLUSIONS The XRD an alysis reve a l s th at t he P MM A and acet oacetanil i de com po si te h as b een fo rmed . The studies suggest the effectiveness of crystal size control, by temperature and evaporation restriction and volume of the solutions used. Characteristic absorption bands from FTIR spectrum of composites PM-AA are identified and assigned by comparison with the values found for PMMA and acetoacetanilide individual materials. The presence of absorption peaks of individual materials in the PM-AA composites confirms the incorporation of acetoacetanilide in the PMMA host polymer. The change in the UV-visible spectrum is due to complex formation which can be r efle cted in th e form of chan ge (d ecreas e in PM-AA s amples ) in the op tical ener gy gap. Morphology of PM-AA shows crystalline domains uniformly shaped. The blend PM-AA does not show any second harmonic conversion though acetoacetanilide has SHG property. ACKNOWLEDGEMENTS The authors gratefully acknowledge the financial support extended by Vishveshwaraya Technological University, Belgaum, Karnataka, India by funding the project under VTU research grant scheme. The author thanks Dr. Udaya Bhat and the research scholor Mr. Hebbar, Dept. of Material s S ci ence an d M et al lu rg y, N ITK, S urat hkal, Karnataka, Indi a fo r p rov id in g XRD fa ci l ity and Dr. Shyam Prasad, The Scientist, National Institute of Oceanography, Goa, India in helping to make use of SEM facility. The author sincerely acknowledges Dr. Umesh, Dept of Physics,NITK, Surathkal, for helping in carrying out laser facility. REFERENCES: [1]. Golden J.H., Deng H.B., Disalvo F.J et al., 1995, “ Monodisperse 10 Å diameter metal clusters in a polymeric host”. Science, Vol. 268, PP. 1463-1466.  Vol.11, No.5 Incorporation of Acetoacetanilide Crystals 527 [2]. Zhuang W., Zhang J. H., Liu J., et al., 2008, “Preparation and characterization of nanoTiO2/polylactide composites.Acta Materiae Compositae Sinica”. Vol. 25, No. 3, PP. 8-11. [3]. Dong X.T., Zhang L., Zhang W., et al., 2001, “Preparation and characterization of nanometer-sized CeO2 polystyrene hybrid material”. Acta Phys.Chim, Vol. 17, No. 8, PP. 739-742. [4]. Zhang Y., Zhou G. E., Li L. et al., 1998, “ Preparation and structure of monodispersed naono-TiO2/PMMA materials”. Chin. J. Mater. Res., Vol. 12, No. 3, PP. 291-294. [5]. Dong X.T., Sun J., Liu G. X., et al., 2003, “Preparation and characterization of nanometer- sized CeO2/PMMA hybrid material”. Acta. Chim. Sin., Vol. 61, No. 1, PP. 122-125. [6]. D.S. Chemla and J. Zyss, : Nonlinear Optical Properties of Organic Molecules and Crystals. vol. 1 and 2, Academic Press, Orlando (1998) [7]. Feroz A. Mir, 2010, “Structural and Optical Properties of ZnS Nanocrystals embedded in Polycrylamide”, Journal of Optoelectronics and Biomedical Materials, Vol. 2, Issue 2, pp. 79 – 84. [8]. S. Srivastava, M. Haridas and J.K. Basu, 2008, “Optical Properties of Polymer Nanocomposites”, Bull. Mater. Sci., Vol. 31, No. 3, pp. 213–217. [9]. N. Raman, Y. Pitchaikani Raja, A. Kuland aisami, 2001, “Synthesis and characterisation of Cu(II), Ni(II), Mn(II), Zn(II) and VO(II) Schiff base complexes derived from o- phenylenediamine and acetoacetanilide”, Proc. Indian Acad. Sci. (Chem. Sci.), Vol. 113, No. 3, pp. 183–189. [10]. Xiao-Dong Ma, Xue-Feng Qian, Jie Yin and Zi-Kang Zhu, 2002, “Preparation and characterization of polyvinyl alcohol–selenide nanocomposites at room temperature”. J.Mater.Chem., Vol. 12, pp. 663–666. [11]. Jianxi Yao, Gaoling Zhao, Dan Wang, Gaorong Han, 2005, “Solvothermal synthesis and characterization of CdS nanowires/PVA composite films". Materials Letters, Vol. 59, pp. 3652 – 3655. [12]. G. Muragadoss, B. Rajamannan, V. Ramasamy, 2010, “Synthesis and Photoluminescence Study of PVA- Capped ZnS:Mn- Nanoparticles”. Digest Journal of Nanomaterials and Biostructures, Vol. 5, No 2, pp. 339 – 345. [13]. P. Vinotha Boorana Lakshmi, K. Sakthi Raj, and K. Ramachandran, 2009, “Synthesis and Charecterisation of nano ZnS doped with Mn”. Cryst. Res. Technol., Vol. 44, No. 2, pp. 153 – 158. [14]. E. Martín Rodríguez1, A.Speghini, F. Piccinelli et al, 2008, “Second harmonic generation by Ferroelectric nanoparticles of Strontium Barium Niobate”. Poster, September 01-05, Oviedo-Spain. |