

Paper Menu >>
Journal Menu >>
 Journal of Minerals & Materials Characterization & Engineering, Vol. 11, No.1, pp.85-105 2012 jmmce.org Printed in the USA. All rights reserved 85 Energy Ab sorption and Strength Evaluation for Compr essed Glass Fibre Reinforced Polyester (GRP) for Automobile Components Design in Crash Prevention Schem e Chukwutoo Christopher Ihueze 1 and Alfred Nwabunwanne. Enetanya 2 1Department of Industrial /Production Engineering Nnamdi Azikiwe University Awka 2Department of Mechanical Engineering Nnamdi Azikiwe University Awka Corresponding Author: [email protected] ABSTRACT This paper utilized the compressive tests results to establish some critical mechanical properties and crashworthiness parameters that may be required to design GRP composites of polyester matrix in automobile structures. Third order polynomial function was used with numerical methods to establish the elastic properties whish could not be established due to sensitivity of the Monsanto tensometer used to obtain the compression results. This study showed that the finite difference method captured the general trend of experimental solution giving optimum value of compressive stress as 23.78MPa at strain of 0.018 and elastic limit of 12.01MPa at 0.01 strain through finite difference analysis while the solution with third order polynomial interpolation gave optimum compressive stress as 36.57MPa at 0.018 strain and elastic limit of 12.143MPa. Also established with compression data is the compressive or buckling moduli of 1.2GPa. Gauss-Legendre two point rule was used to evaluate the area under the stress-strain curve which measured the amount of energy absorbed per unit volume of sample from where the energy absorbed at ultimate strength of 0.025J/M3- 0.22 J/M3 , energy at fracture of 0.62 J/M3- 1.62 J/M3 and the absorbed specific work 0.001J/Kg are established. . Key words: viscoelastic behavior, crash parameters, energy absorption and crash work, absorbed specific work. 1. INTRODUCTION The prediction of damage to structures caused by accidental collision – whether to automobiles, offshore installations or simply the packaging around an electrical appliance – is a crucial factor in their design. This important new study focuses on the way in which  86 Chukwut oo Christophe r Ihueze Vol.11, No.1 structures and materials can be designed to absorb kinetic energy in a controllable and predictable manner. An investigation into energy absorption requires an understanding of materials engineering, structural mechanics, the theory of plasticity and impact dynamics. Whilst a great deal of research has been undertaken on various aspects of these subjects, this knowledge is diffuse and widely scattered [1]. The energy absorption capability of a composite material is critical to developing improved human safety in an automotive crash. Energy absorption is dependent on many parameters like fibre type, matrix type, fibre architecture, specimen geometry, processing conditions, fibre volume fraction, and testing speed. Changes in these parameters can cause subsequent changes in the specific energy absorption (ES) of composite materials up to a factor of 2 [2]. Composites with their high strength to weight ratio have become very important in many technological applications such as in aerospace, automobile and medical industries. Just like any other mechanical components in service, polymer composites are subjected to varying mechanical forces during manufacture and use. Budiansky [3], Sridharan [4], Chung and Weitzsman [5], Kyriakides [6] and HSU et al [7] used idealized macro-buckling mechanical models of fibre reinforced composites to establish that the compressive strengths of fibrecomposites subjected to compressive loads are only about 50% to 60% of their ultimate strength in tension. The design values for the mechanical properties of any composite system are usually obtained from laboratory tests. These tests give valuable information on the mechanical behavior of composite materials to a significant degree. However, the ability to understand the response of the composites to general loading conditions or to improve their mechanical properties requires the knowledge of the behavior of the composite on the microscope scale. In this work buckling is considered the failure mode that governs the mec hanical behavior of composite materials in service. The initial attempts to predict the mechanical behavior of composite were based upon the simple theory of strength of materials. The viscoelastic behavior of plastic composite makes the establishment of elastic range in plastic composites difficult that experimental methods give only the short time properties of plastic composites [8]. Foye [9] was the first to attempt the analysis of composite materials by numerical method to obtain an inelastic solution employing a generalized plane strain condition. 2. METHODS AND MATERIALS The methods involve the use of the Ihueze [10] data of replicated samples of GRP composites tested for compressive failure and the application of some numerical methods t o predict some limiting properties of GRP composites and applying some crash evaluation relations. The sample replication schemes are as presented in Figure 1. In the Ihueze [10] all the replications 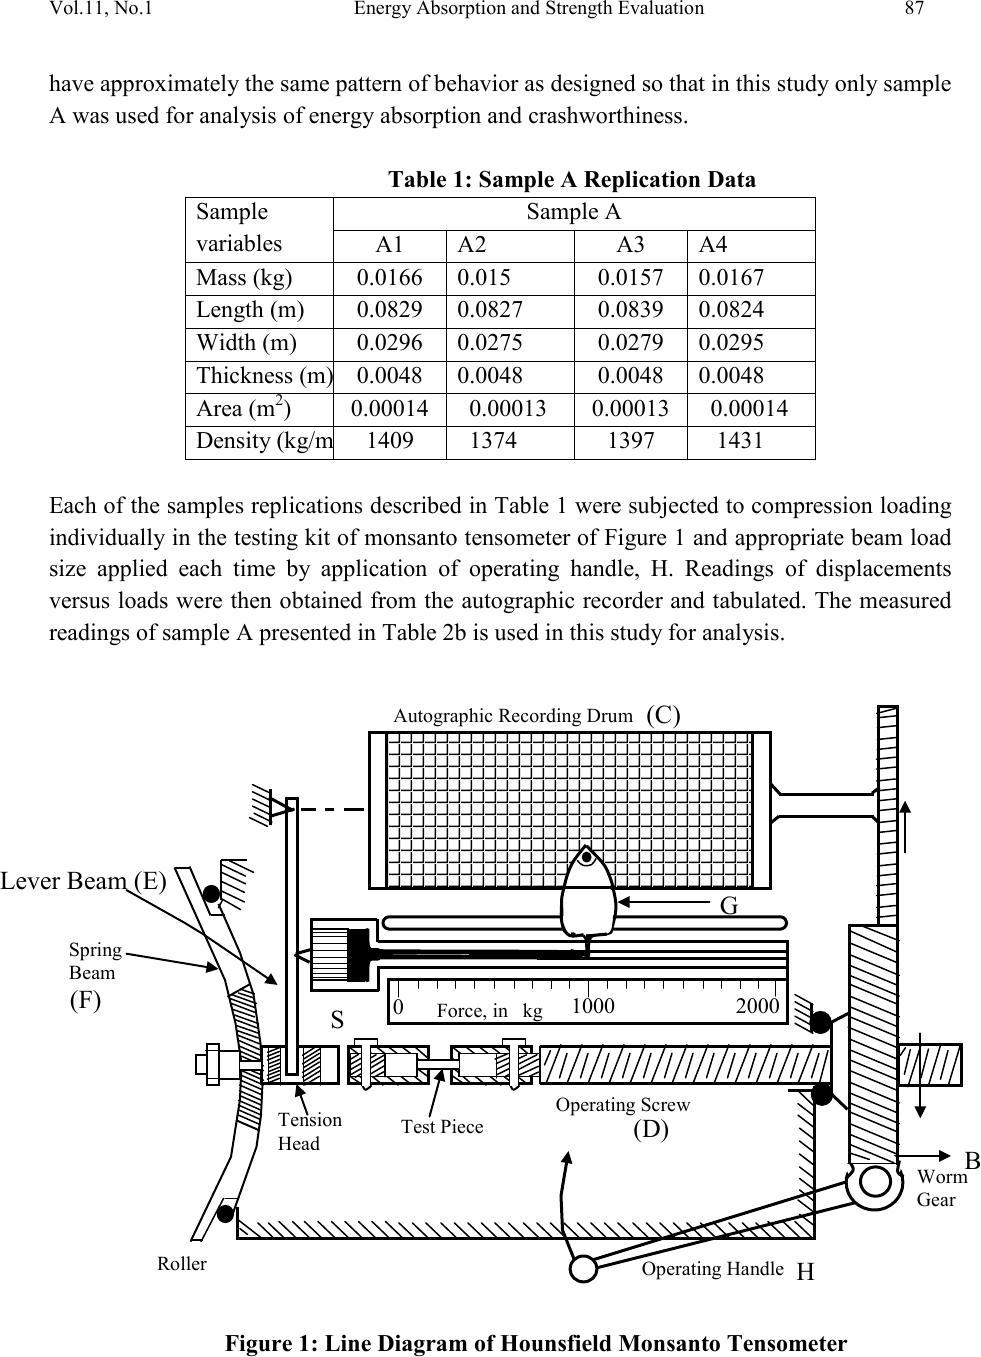 Vol.11, No.1 Energy Abs orption and S trength Evaluati on 87 have approximately the same pattern of behavior as designed so that in this study only sample A was used for analysis of energy absorption and crashworthiness. Table 1: Sample A Replication Data Sample variables Sample A A1 A2 A3 A4 Mass (kg) 0.0166 0.015 0.0157 0.0167 Length (m) 0.0829 0.0827 0.0839 0.0824 Width (m) 0.0296 0.0275 0.0279 0.0295 Thickness (m) 0.0048 0.0048 0.0048 0.0048 Area (m2) 0.00014 0.00013 0.00013 0.00014 Density (kg/m 1409 1374 1397 1431 Each of th e samples repl ications d escribed in Table 1 were subjected to compression loading individually in the testing kit of monsanto t ensometer of Figure 1 and appropriate beam lo ad size applied each time by application of operating handle, H. Readings of displacements versus loads were then obtained from the autographic recorder and tabulated. The measured readings of sample A presented in Table 2b is used in this study for analysis. Figure 1: Line Diagram of Hounsfield Monsanto Tensometer B (D) (C) (F) Lever Beam (E) G H S 0 1000 2000 For ce, in kg Spr ing Beam Roller Ope rating Handle Worm Gear Tension Head Test Piece Operating Screw Autographic Recording Drum 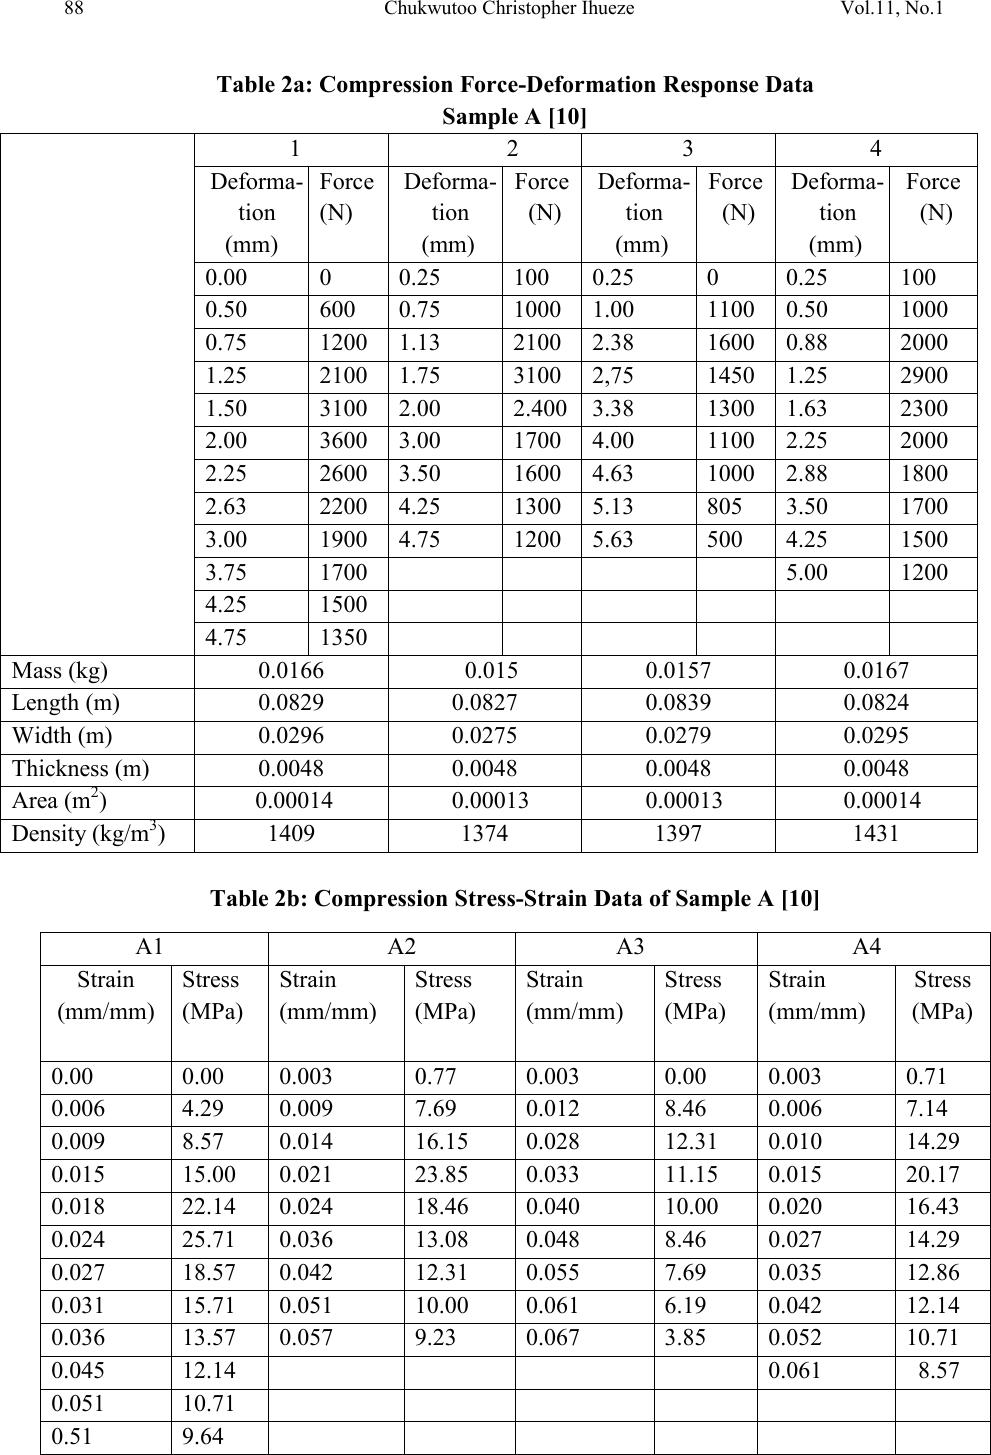 88 Chukwut oo Christophe r Ihueze Vol.11, No.1 Table 2a: Compression Force-Deformation Response Data Sample A [10] 1 2 3 4 Deforma- tion (mm) Forc e (N) Deforma- tion (mm) Forc e (N) Deforma- tion (mm) Forc e (N) Deforma- tion (mm) Forc e (N) 0.00 0 0.25 100 0.25 0 0.25 100 0.50 600 0.75 1000 1.00 1100 0.50 1000 0.75 1200 1.13 2100 2.38 1600 0.88 2000 1.25 2100 1.75 3100 2,75 1450 1.25 2900 1.50 3100 2.00 2.400 3.38 1300 1.63 2300 2.00 3600 3.00 1700 4.00 1100 2.25 2000 2.25 2600 3.50 1600 4.63 1000 2.88 1800 2.63 2200 4.25 1300 5.13 805 3.50 1700 3.00 1900 4.75 1200 5.63 500 4.25 1500 3.75 1700 5.00 1200 4.25 1500 4.75 1350 Mass (kg) 0.0166 0.015 0.0157 0.0167 Length (m) 0.0829 0.0827 0.0839 0.0824 Width (m) 0.0296 0.0275 0.0279 0.0295 Thickness (m) 0.0048 0.0048 0.0048 0.0048 Area (m2) 0.00014 0.00013 0.00013 0.00014 Density (kg/m3) 1409 1374 1397 1431 Table 2b: Compression Stress-Strain Data of Sample A [10] A1 A2 A3 A4 Strain (mm/mm) Stress (MPa) Strain (mm/mm) Stress (MPa) Strain (mm/mm) Stress (MPa) Strain (mm/mm) Stress (MPa) 0.00 0.00 0.003 0.77 0.003 0.00 0.003 0.71 0.006 4.29 0.009 7.69 0.012 8.46 0.006 7.14 0.009 8.57 0.014 16.15 0.028 12.31 0.010 14.29 0.015 15.00 0.021 23.85 0.033 11.15 0.015 20.17 0.018 22.14 0.024 18.46 0.040 10.00 0.020 16.43 0.024 25.71 0.036 13.08 0.048 8.46 0.027 14.29 0.027 18.57 0.042 12.31 0.055 7.69 0.035 12.86 0.031 15.71 0.051 10.00 0.061 6.19 0.042 12.14 0.036 13.57 0.057 9.23 0.067 3.85 0.052 10.71 0.045 12.14 0.061 8.57 0.051 10.71 0.51 9.64  Vol.11, No.1 Energy Abs orption and S trength Evaluati on 89 3. NUMERICAL INTERPOLATIONS OF INTERMEDIATE PROPERTIES The interpolation schemes of this section established the intermediate values of the study such as the elastic values of the data that is needed the analysis of crashworthiness of the material as proposed in [11]. The elastic modulus, proportionality limit and the elastic limit are established with this interpolation schemes. The elastic modulus and limit are evaluated at strain 0.01 [12]. 3.1 Finite Difference Formulations and Polynomial Regression Method Polynomial interpolation aids interpolation and extrapolation of data which could not be measured due to limited sensitivity of instrument. Analysis of a cross section of experimental data of Ihueze [10] is shown as Table 2b.By taking a section of experimental data to the ultimate stress, a polynomial equation was established as in figure 2 and expressed in equation (1). Our target is to capture the elastic properties of the material being studied which will not be measured with the sensitivity range of our instrument. Figure 2: Third Order Polynomial Model for Finite Difference Approximations Supposing represents a regular partition of interval so that following the method of [14], 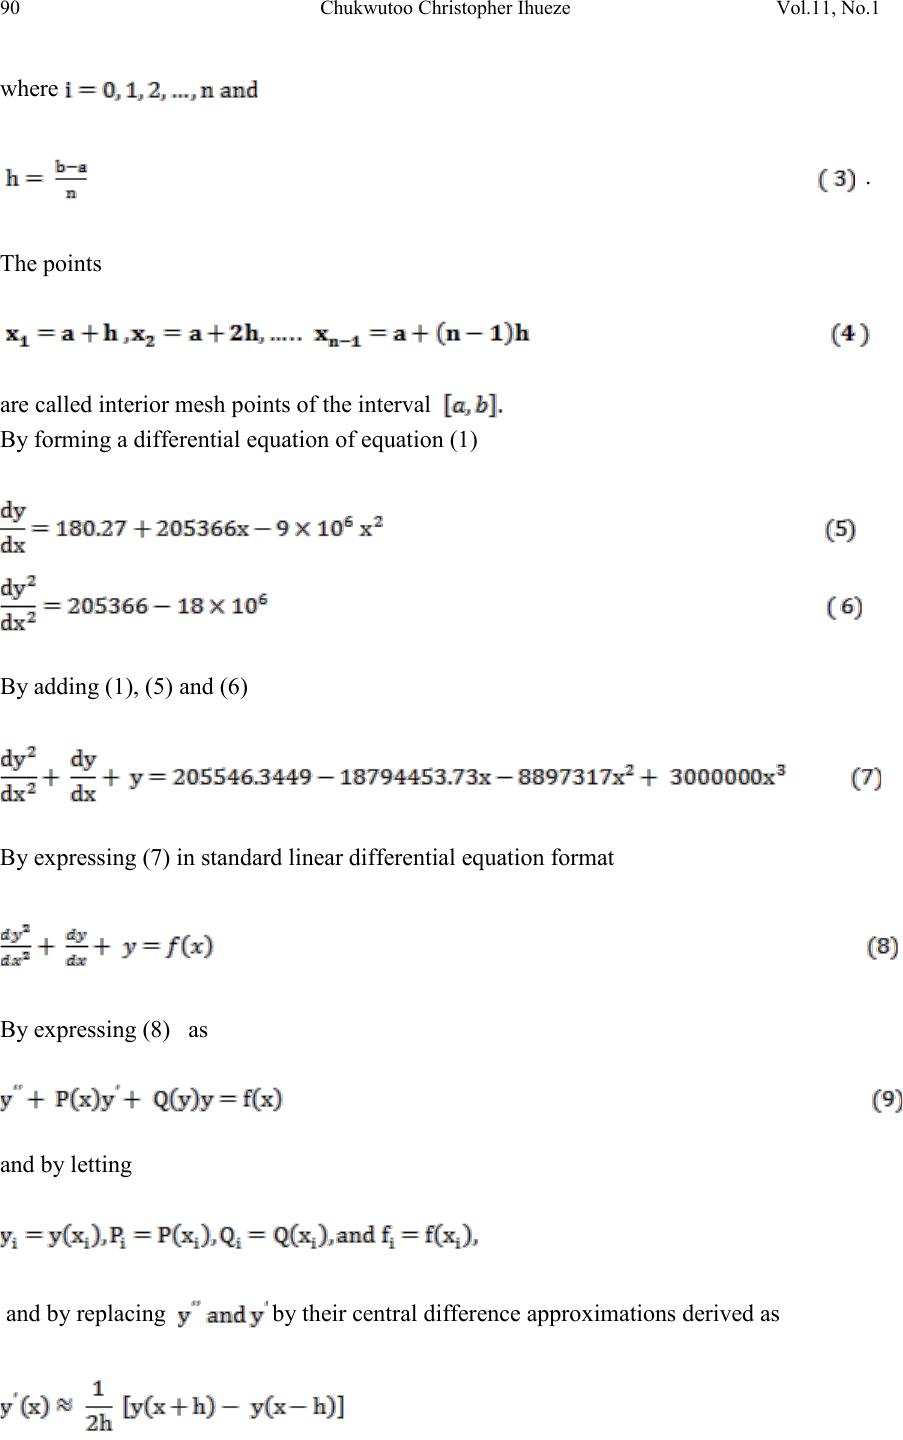 90 Chukwut oo Christophe r Ihueze Vol.11, No.1 where . The points are called interior mesh points of the interval By forming a differential equation of equation (1) By adding (1), (5) and (6) By expressing (7) in standard linear differential equation format By expressing (8) as and by letting and by replacing by their central difference approximations derived as 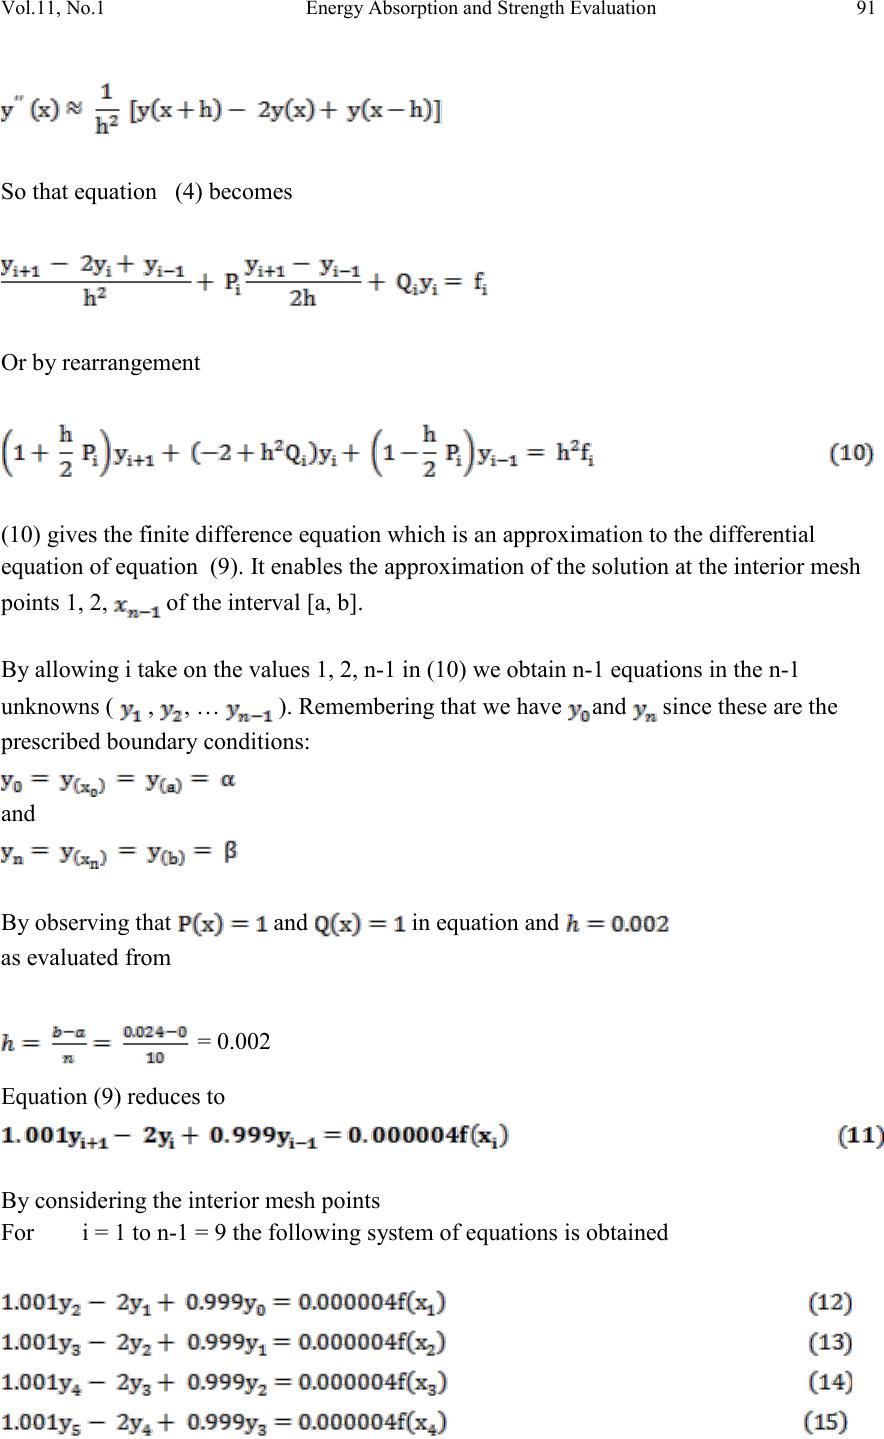 Vol.11, No.1 Energy Abs orption and S trength Evaluati on 91 So that equation (4) becomes Or by rearrangement (10) gives the finite difference equation which is an approximation to the differential equation of equation (9). It enables the approximation of the solution at the interior mesh points 1, 2, of the interval [a, b]. By allowing i take on the values 1, 2, n-1 in (10) we obtain n-1 equations in the n-1 unknowns ( , , … ). Remembering that we have and since these are the prescribed boundary conditions: and By observing that and in equation and as evaluated from = 0.002 Equation (9) reduces to By considering the interior mesh points For i = 1 to n-1 = 9 the following system of equations is obtained 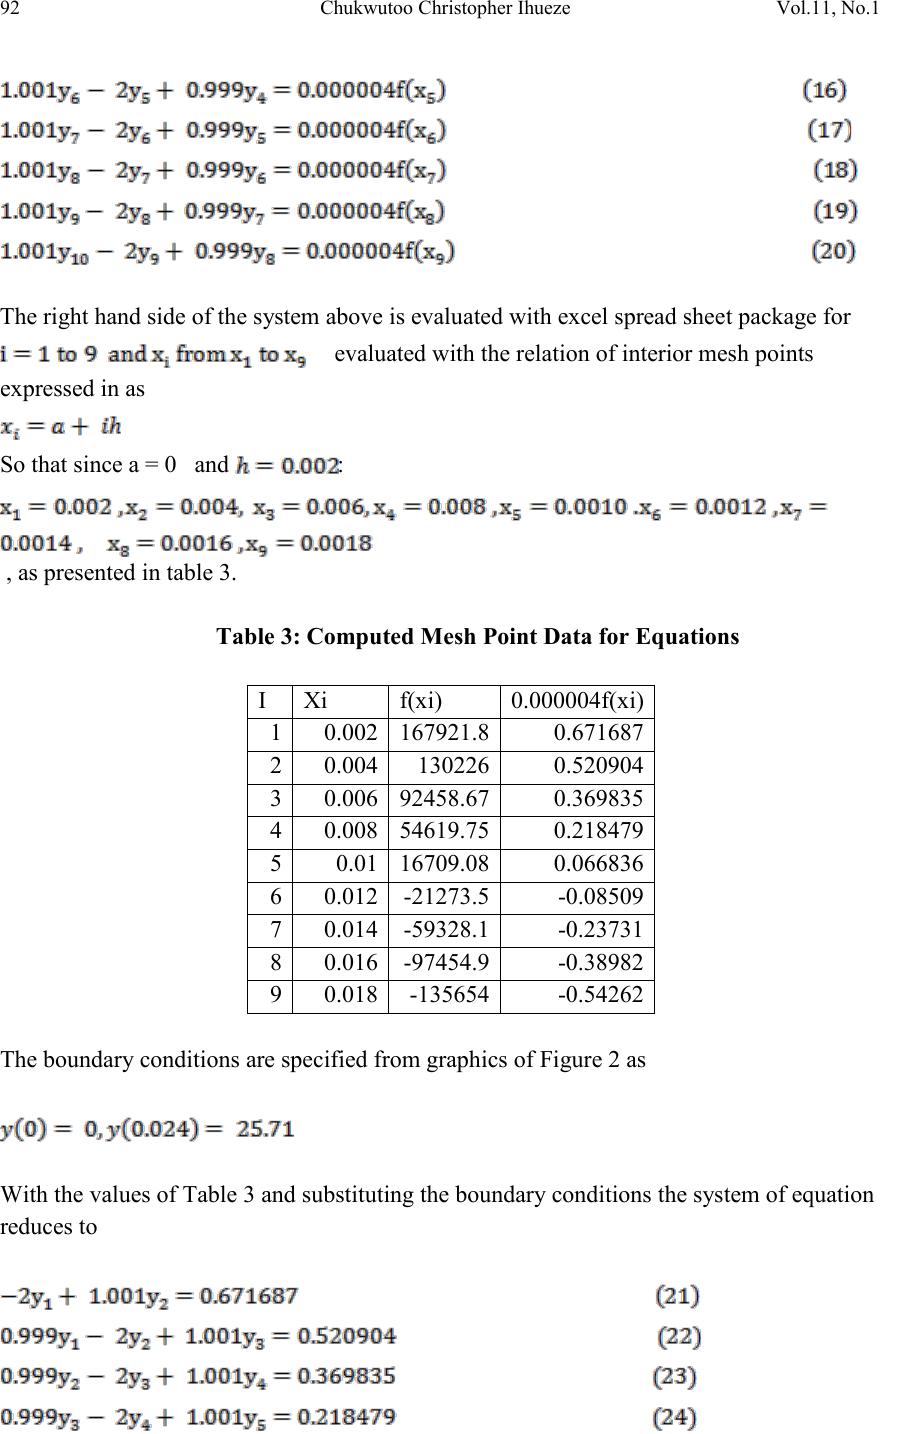 92 Chukwut oo Christophe r Ihueze Vol.11, No.1 The right hand side of the system above is evaluated with excel spread sheet package for evaluated with the relation of interior mesh points expressed in as So that since a = 0 and: , as presented in table 3. Table 3: Computed Mesh Point Data for Equations I Xi f(xi) 0.000004f(xi) 1 0.002 167921.8 0.671687 2 0.004 130226 0.520904 3 0.006 92458.67 0.369835 4 0.008 54619.75 0.218479 5 0.01 16709.08 0.066836 6 0.012 -21273.5 -0.08509 7 0.014 -59328.1 -0.23731 8 0.016 -97454.9 -0.38982 9 0.018 -135654 -0.54262 The boundary conditions are specified from graphics of Figure 2 as With the values of Table 3 and substituting the boundary conditions the system of equation reduces to 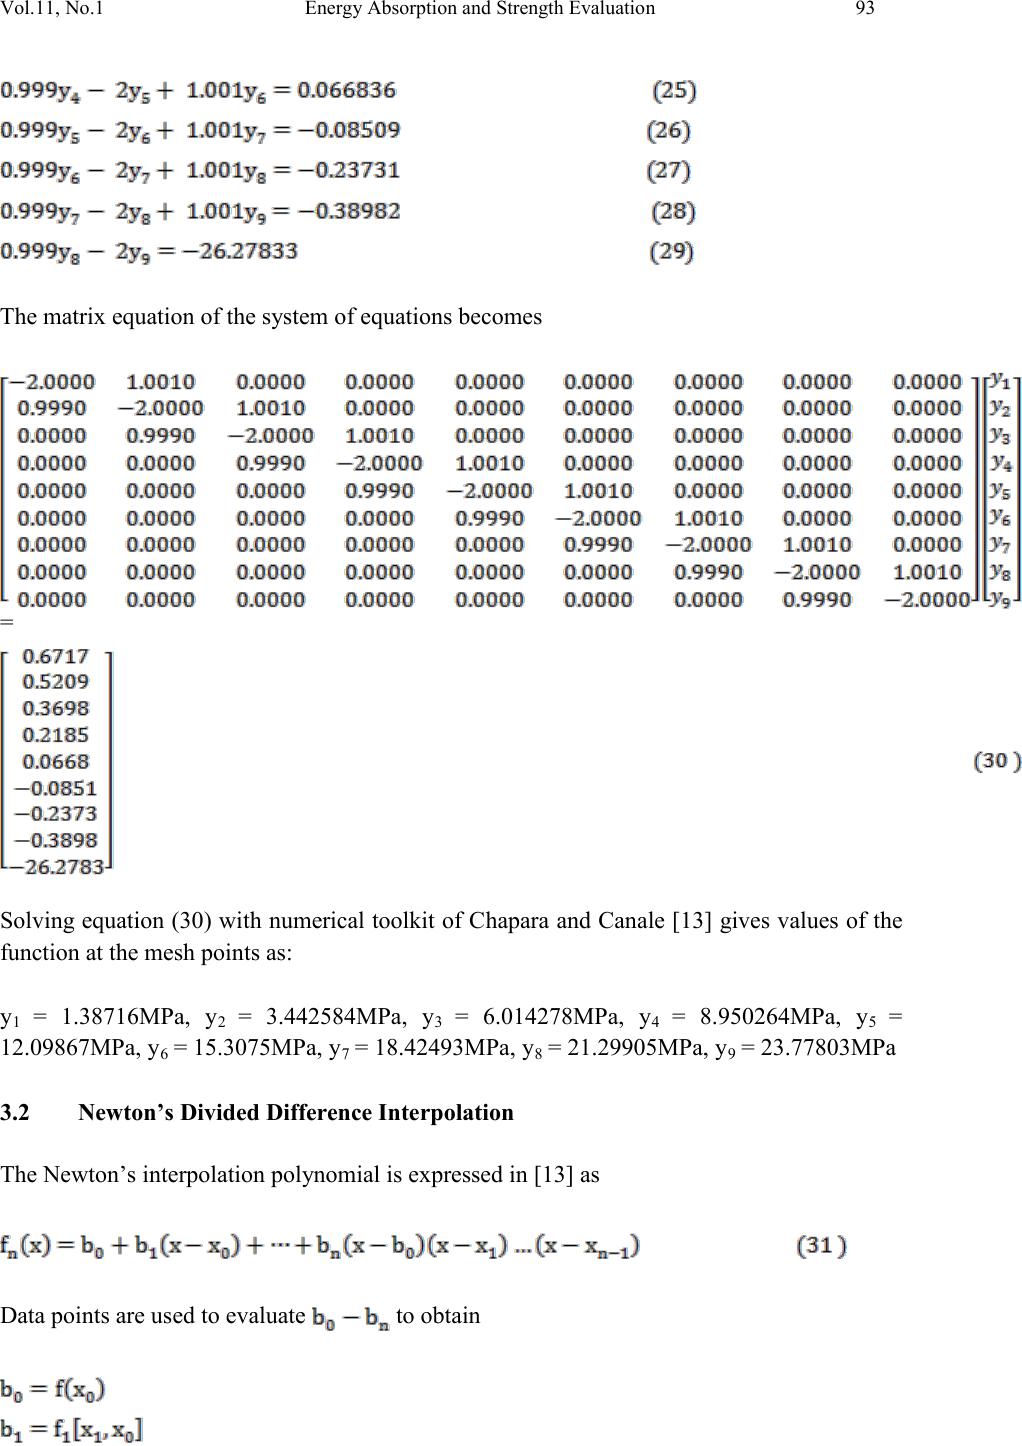 Vol.11, No.1 Energy Abs orption and S trength Evaluati on 93 The matrix equation of the system of equations becomes = Solving equation (30) with numerical toolkit of Chapara and Canale [13] gives values of the function at the mesh points as: y1 = 1.38716MPa, y2 = 3.442584MPa, y3 = 6.014278MPa, y4 = 8.950264MPa, y5 = 12.09867MPa, y6 = 15.3075MPa, y7 = 18.42493MPa, y8 = 21.29905MPa, y9 = 23.77803MPa 3.2 Newton’s Divided Difference Interpolation The Newton’s interpolation polynomial is expressed in [13] as Data points are used to evaluate to obtain 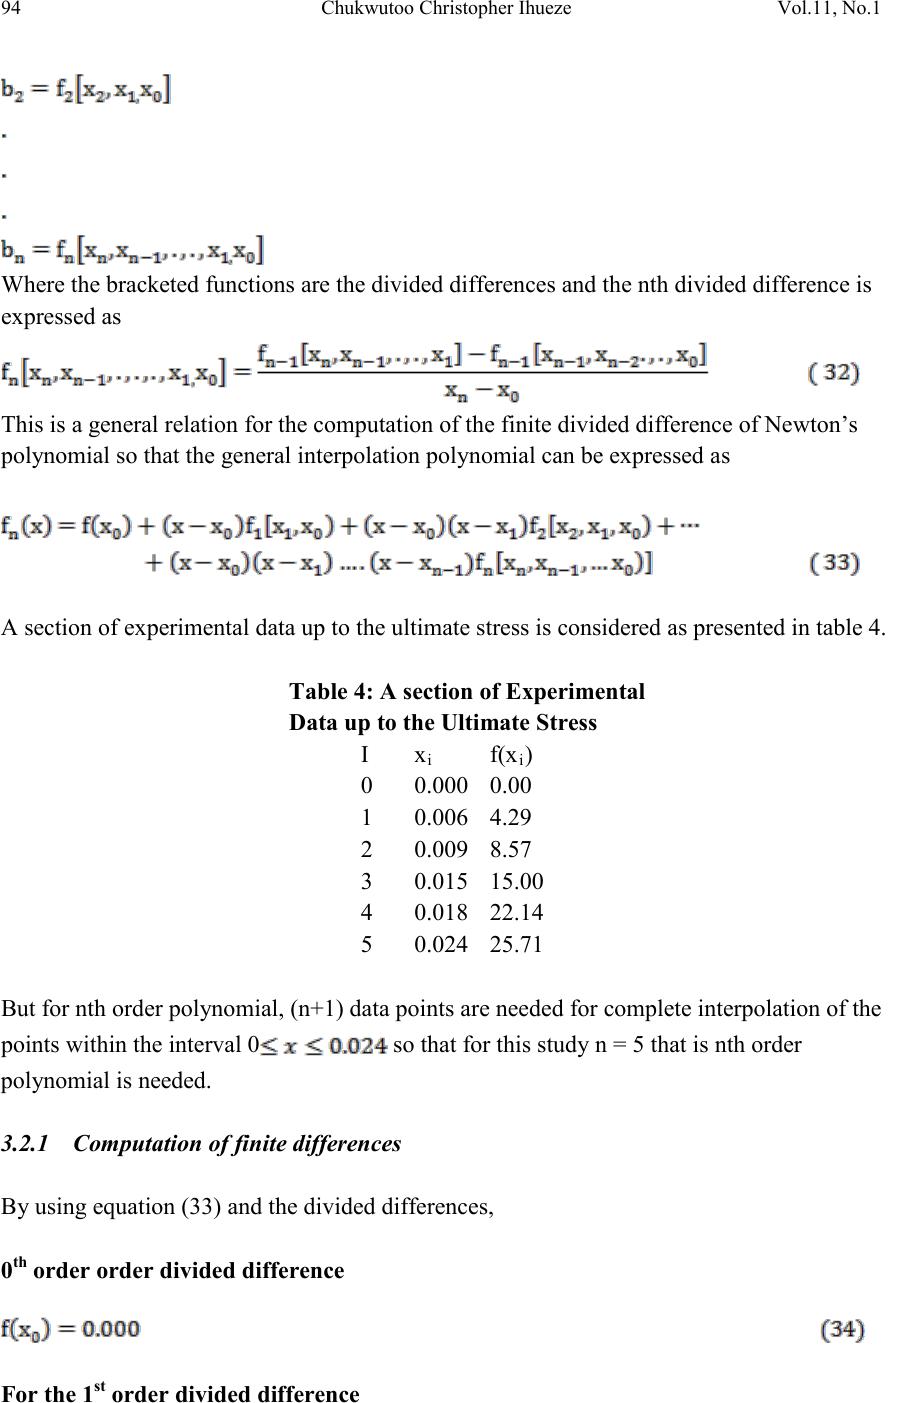 94 Chukwut oo Christophe r Ihueze Vol.11, No.1 Where the bracketed functions are the divided differences and the nth divided difference is expressed as This is a general relation for the computation of the finite divided difference of Newton’s polynomial so that the general interpolation polynomial can be expressed as A section of experimental data up to the ultimate stress is considered as presented in table 4. Table 4: A section of Experimental Data up to the Ultimate Stress I x i f(x i ) 0 0.000 0.00 1 0.006 4.29 2 0.009 8.57 3 0.015 15.00 4 0.018 22.14 5 0.024 25.71 But for nth order polynomial, (n+1) data points are needed for complete interpolation of the points within the interval 0 so that for this study n = 5 that is nth order polynomial is needed. 3.2.1 Computation of finite differences By using equation (33) and the divided differences, 0th order order divided difference For the 1st order divided difference 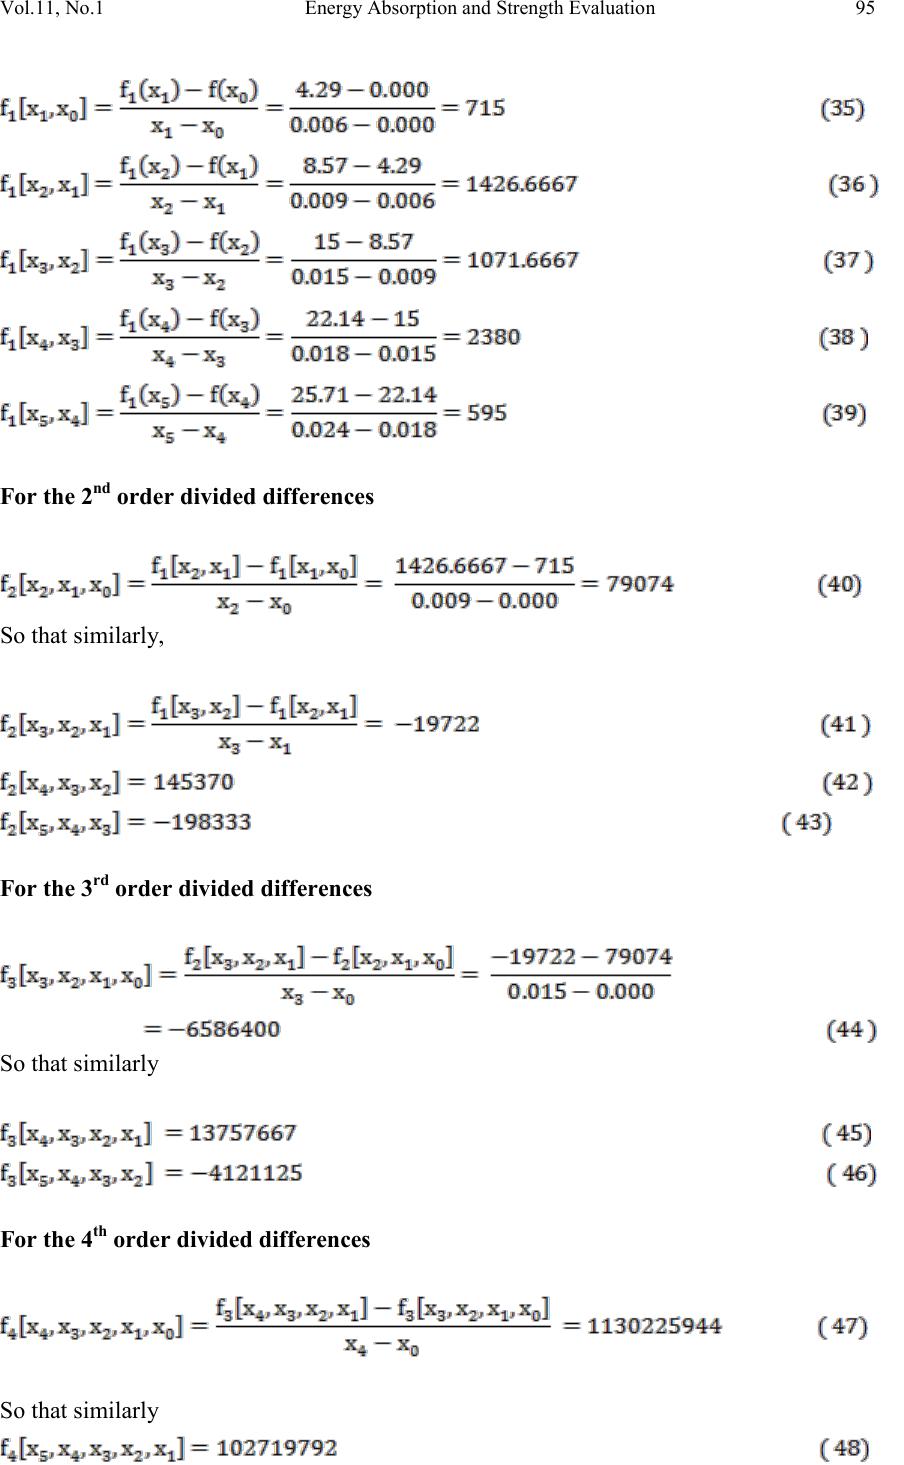 Vol.11, No.1 Energy Abs orption and S trength Evaluati on 95 For the 2nd order divided differences So that similarly, For the 3rd order divided differences So that similarly For the 4th order divided differences So that similarly 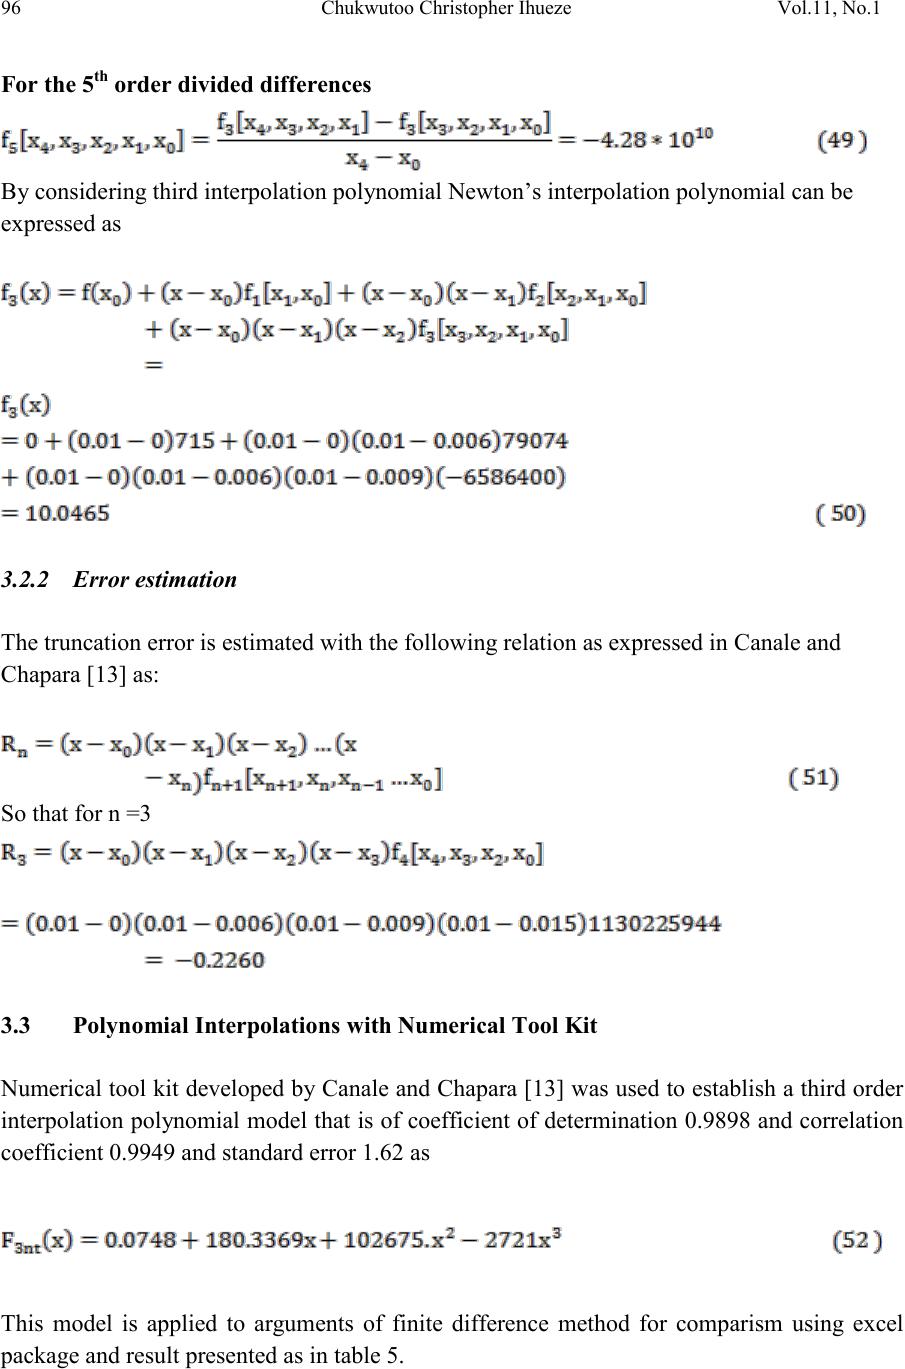 96 Chukwut oo Christophe r Ihueze Vol.11, No.1 For the 5th order divided differences By considering third interpolation polynomial Newton’s interpolation polynomial can be expressed as 3.2.2 Error estimation The truncation error is estimated with the following relation as expressed in Canale and Chapara [13] as: So that for n =3 3.3 Polynomial Interpolations with Numerical Tool Kit Numerical tool kit developed by Canale and Chapara [13] was used to establish a third order interpolation polynomial model that is of coefficient of determination 0.9898 and correlation coefficient 0.9949 and standard error 1.62 as This model is applied to arguments of finite difference method for comparism using excel package and result presented as in table 5. 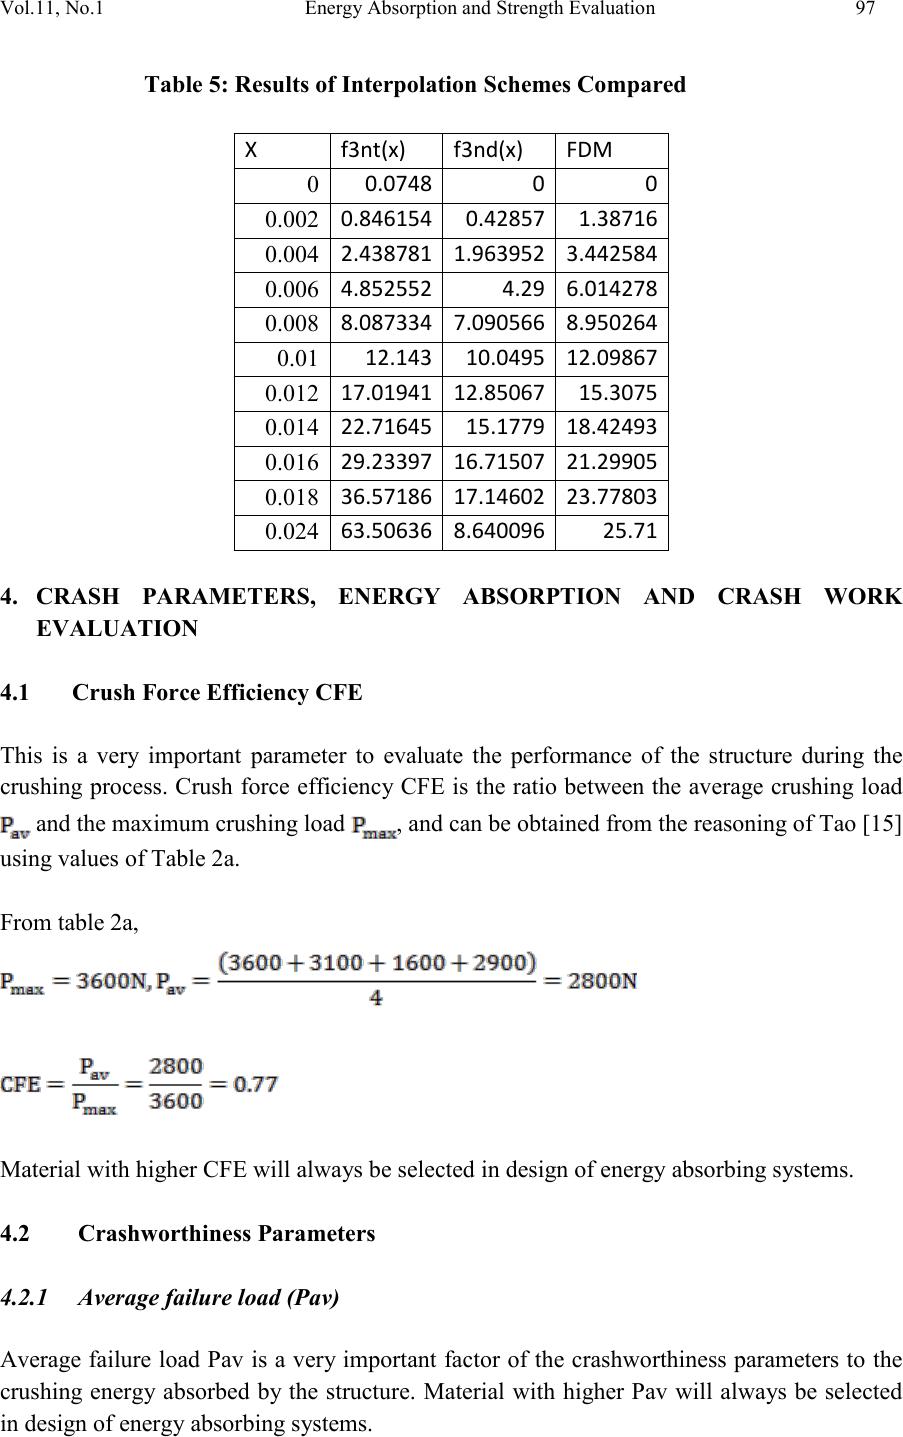 Vol.11, No.1 Energy Abs orption and S trength Evaluati on 97 Table 5: Results of Interpolation Schemes Compared X f3nt(x) f3nd(x) FDM 0 0.0748 0 0 0.002 0.846154 0.42857 1.38716 0.004 2.438781 1.963952 3.442584 0.006 4.852552 4.29 6.014278 0.008 8.087334 7.090566 8.950264 0.01 12.143 10.0495 12.09867 0.012 17.01941 12.85067 15.3075 0.014 22.71645 15.1779 18.42493 0.016 29.23397 16.71507 21.29905 0.018 36.57186 17.14602 23.77803 0.024 63.50636 8.640096 25.71 4. CRASH PARAMETERS, ENERGY ABSORPTION AND CRASH WORK EVALUATION 4.1 Crush Force Efficiency CFE This is a very important parameter to evaluate the performance of the structure during the crushing process. Crush force efficiency CFE is the ratio between the average crushing load and the maximum crushing load, and can be obtained from the reasoning of Tao [15] using values of Table 2a. From table 2a, Material with higher CFE will always be selected in design of energy absorbing systems. 4.2 Crashworthiness Parameters 4.2.1 Average failure load (Pav) Average failure load Pav is a ver y important factor of the crashworthiness parameters to the crushing energy absorbed by the structure. Material with higher Pav will always be selected in design of energy absorbing systems. 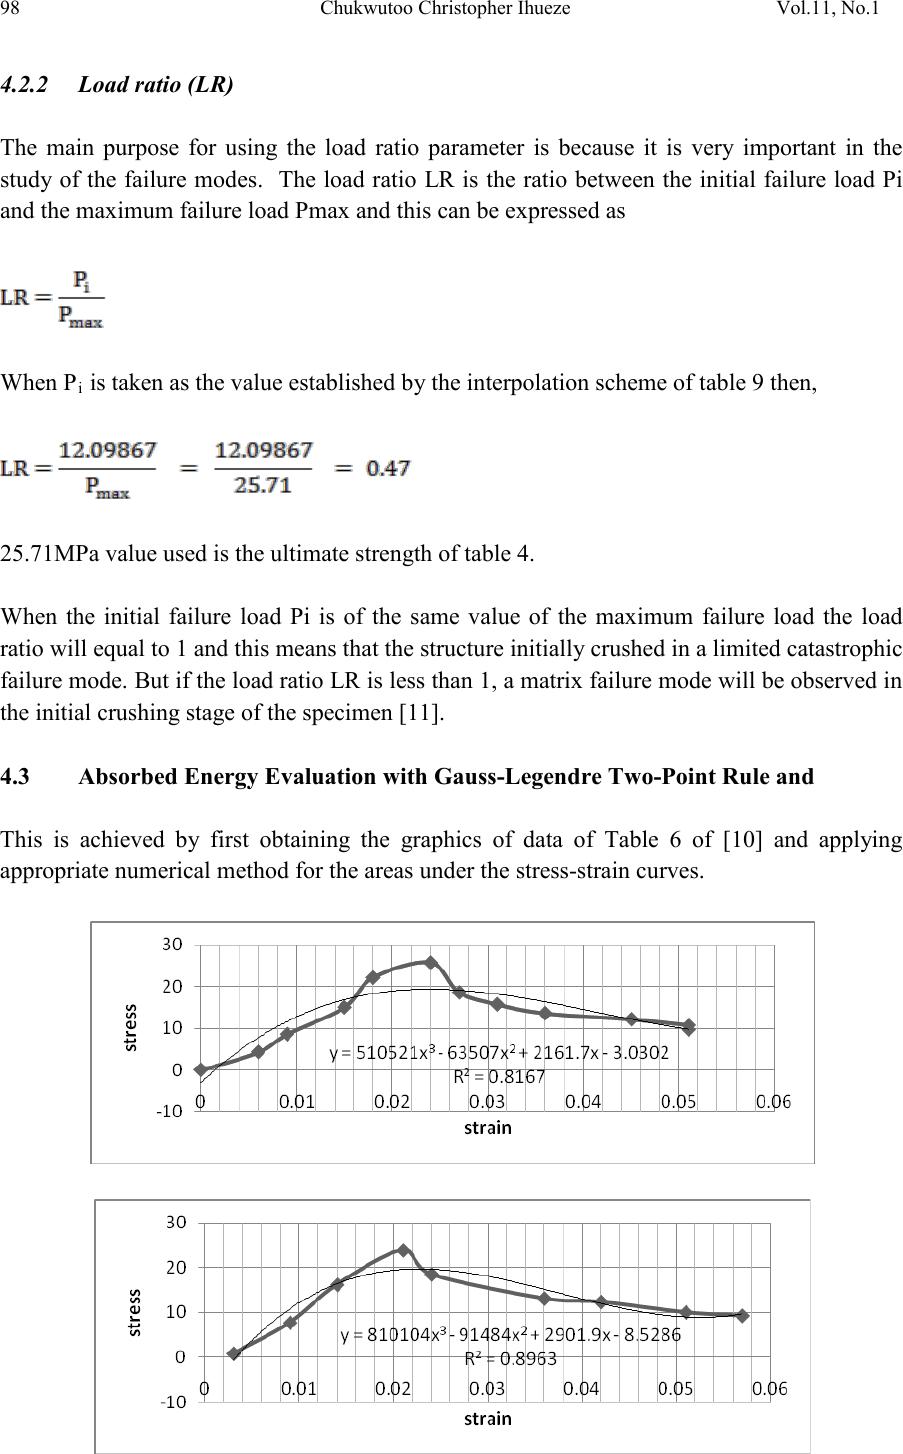 98 Chukwut oo Christophe r Ihueze Vol.11, No.1 4.2.2 Load ratio (LR) The main purpose for using the load ratio parameter is because it is very important in the study of the failure modes. The load ratio LR is the ratio between the initial failure load Pi and the maximum failure load Pmax and this can be expressed as When Pi is taken as the value established by the interpolation scheme of table 9 then, 25.71MPa value used is the ultimate strength of table 4. When the initial failure load Pi is of the same value of the maximum failure load the load ratio will equal to 1 and this means that the structure initially crushed in a limited catastrophic failure mode. But if the load ratio LR is less than 1, a matrix failure mode will be observed in the initial crushing stage of the specimen [11]. 4.3 Absorbed Energy Evaluation with Gauss-Legendre Two-Point Rule and This is achieved by first obtaining the graphics of data of Table 6 of [10] and applying appropriate numerical method for the areas under the stress-strain curves. 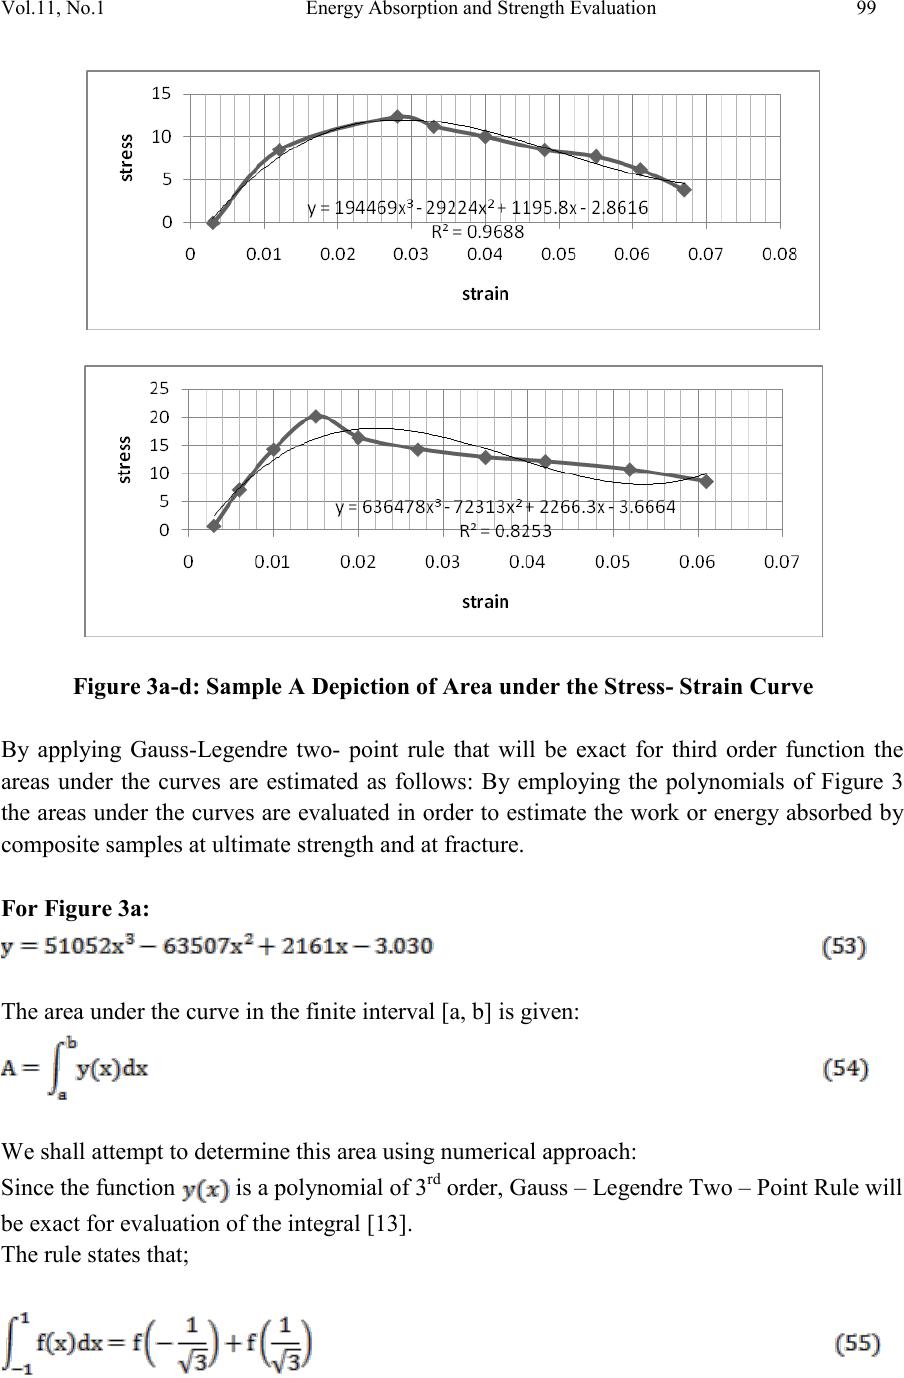 Vol.11, No.1 Energy Abs orption and S trength Evaluati on 99 Figure 3a-d: Sample A Depiction of Area under the Stress- Strain Curve By applying Gauss-Legendre two- point rule that will be exact for third order function the areas under the curves are estimated as follows: By employing the polynomials of Figure 3 the areas under the curves are evaluated in order t o estimate the work or energy absorbed by composite samples at ultimate strength and at fracture. For Figure 3a: The area under the curve in the finite interval [a, b] is given: We shall attempt to determine this area using numerical approach: Since the function is a polynomial of 3rd order, Gauss – Legendre Two – Point Rule will be exact for evaluation of the integral [13]. The rule states that; 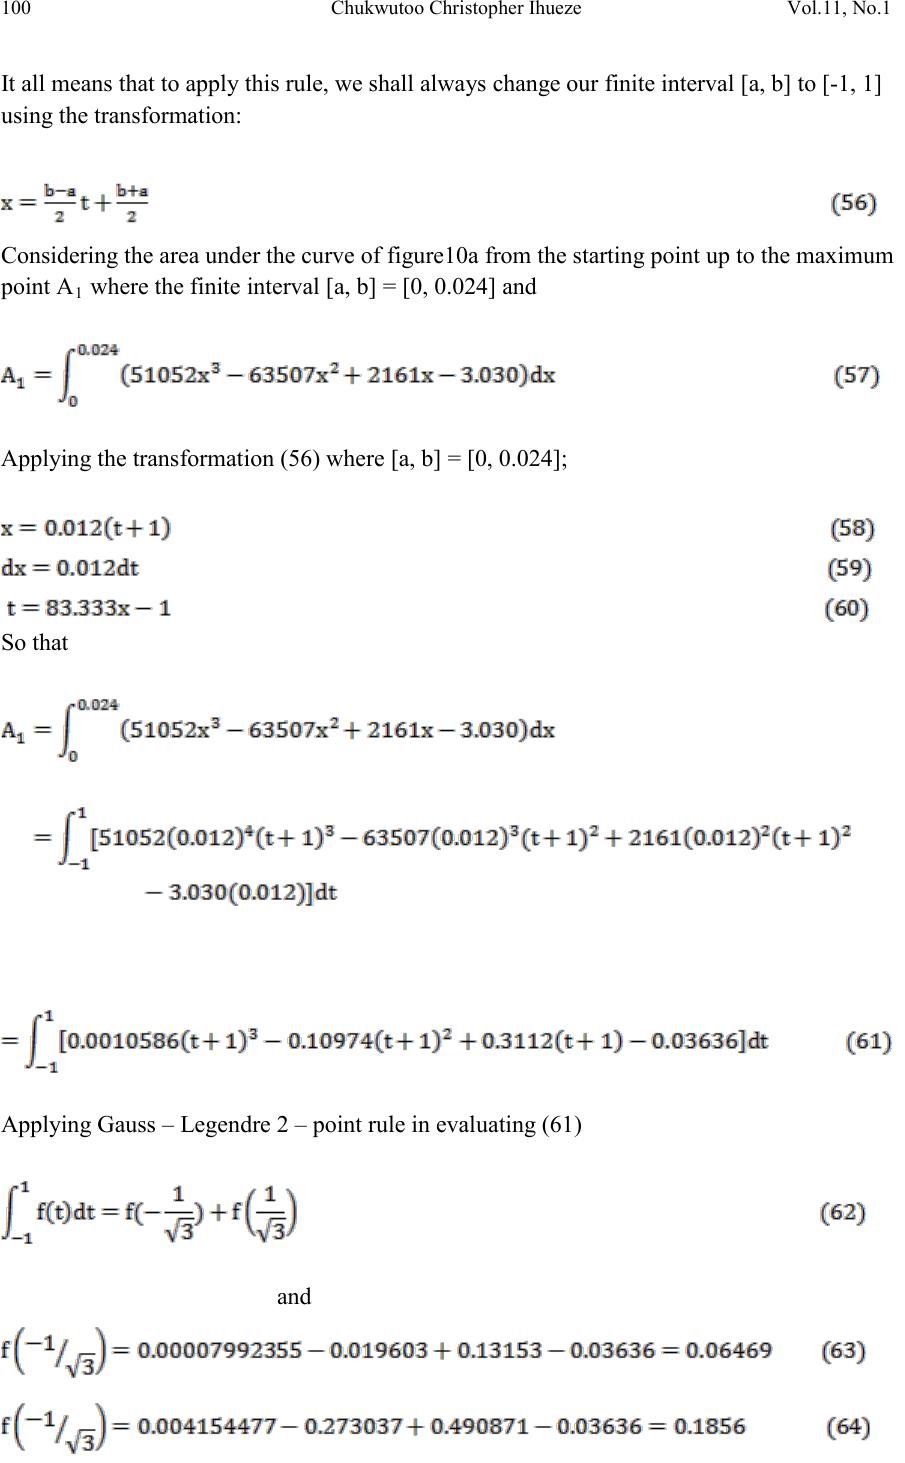 100 Chukwutoo Christopher Ihueze Vol.11, No.1 It all means that to apply this rule, we shall always change our finite interval [a, b] to [-1, 1] using the transformation: Considering the area under the curve of figure10a from the starting point up to the maximum point A1 where the finite interval [a, b] = [0, 0.024] and Applying the transformation (56) where [a, b] = [0, 0.024]; So that Applying Gauss – Legendre 2 – point rule in evaluating (61) and 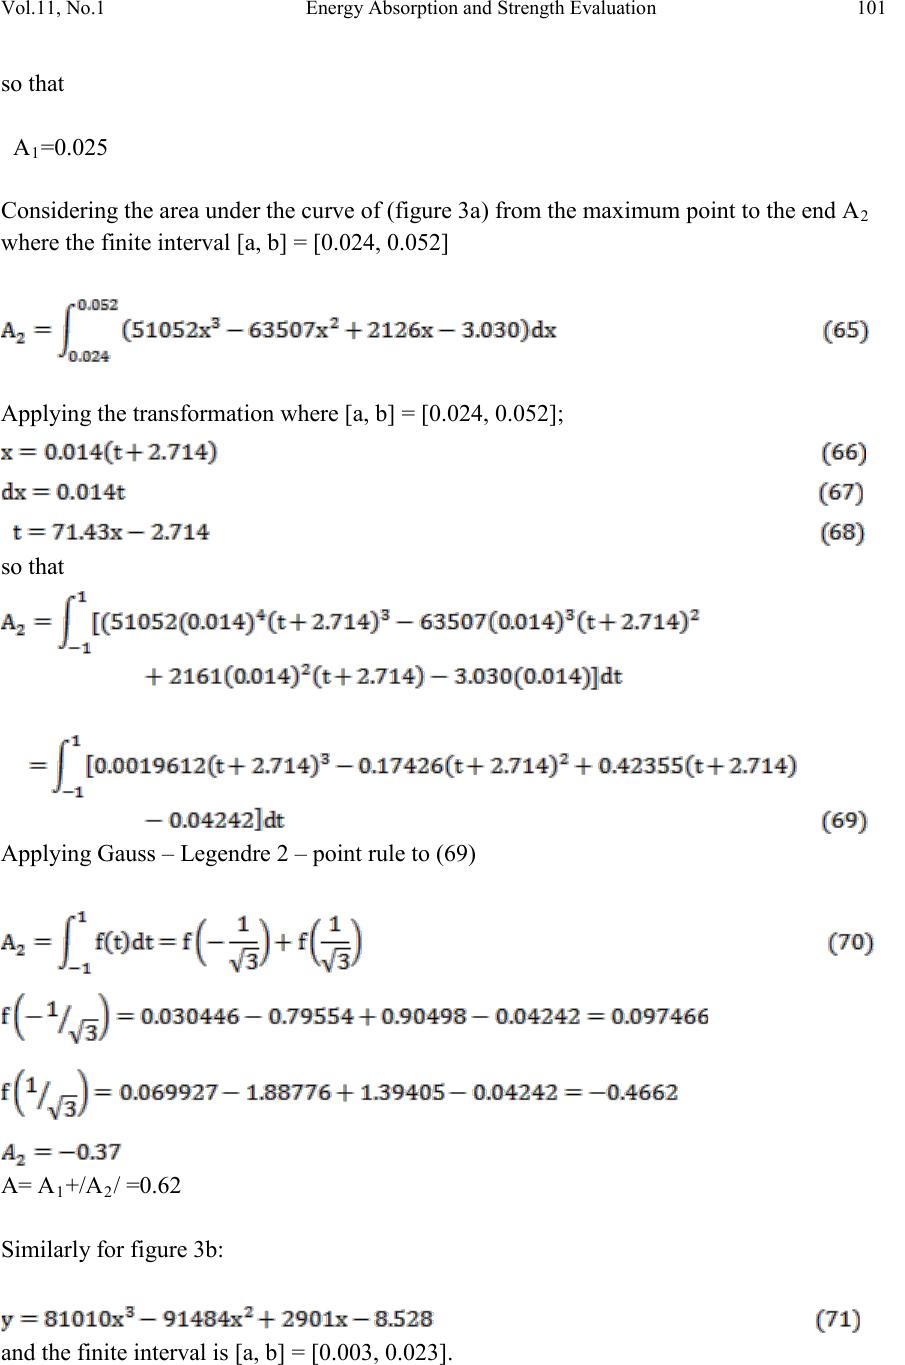 Vol.11, No.1 Energy Abs orption and S trength Evaluati on 101 so that A1=0.025 Considering the area under the curve of (figure 3a) from the maximum point to the end A2 where the finite interval [a, b] = [0.024, 0.052] Applying the transformation where [a, b] = [0.024, 0.052]; so that Applying Gauss – Legendre 2 – point rule to (69) A= A1+/A2/ =0.62 Similarly for figure 3b: and the finite interval is [a, b] = [0.003, 0.023]. 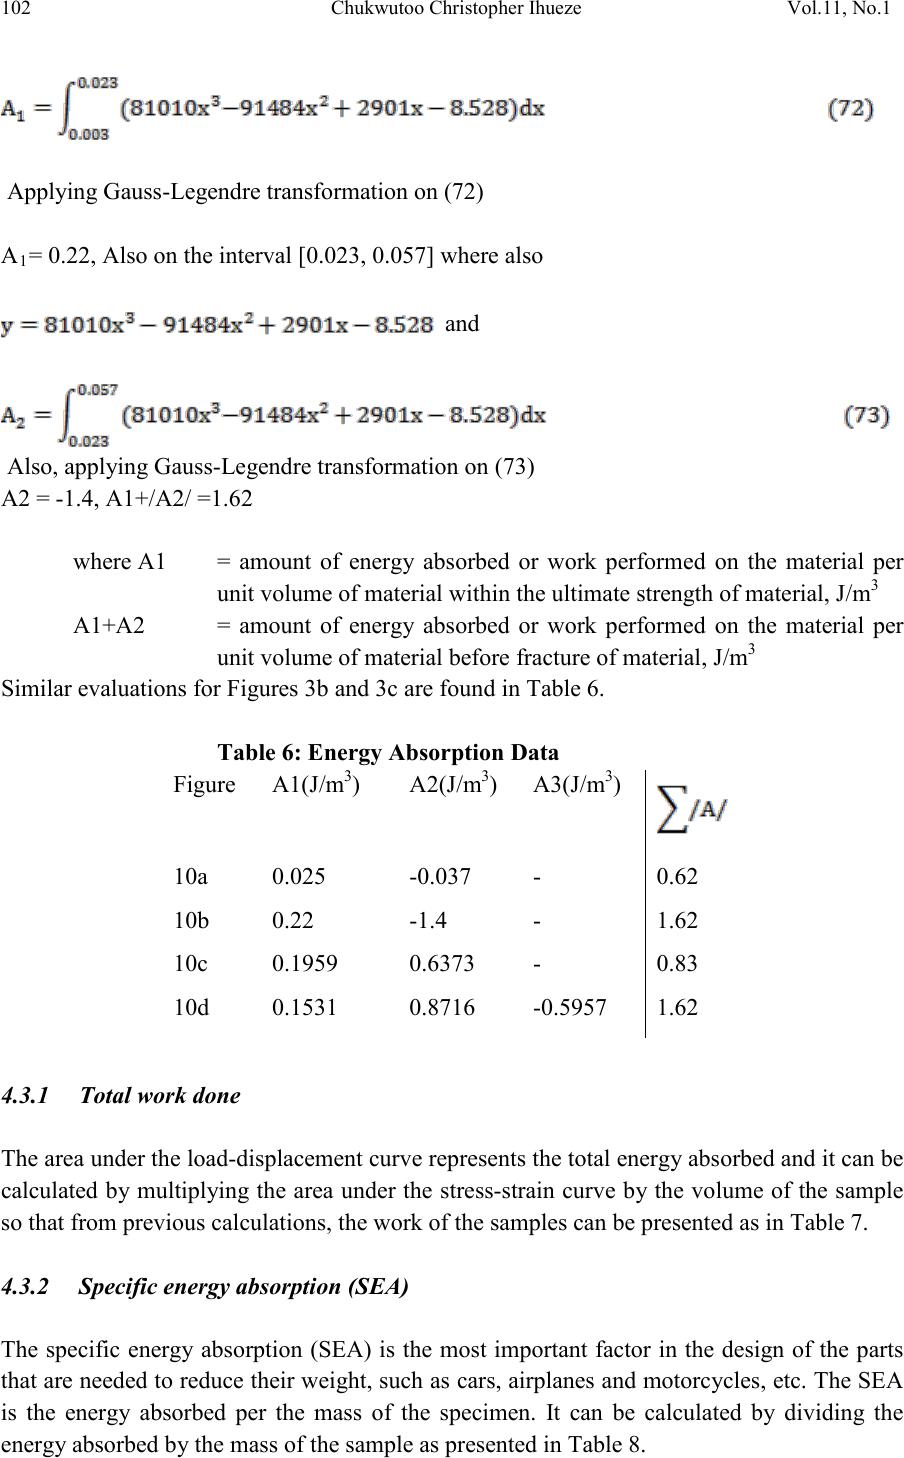 102 Chukwutoo Christopher Ihueze Vol.11, No.1 Applying Gauss-Legendre transformation on (72) A1= 0.22, Also on the interval [0.023, 0.057] where also and Also, applying Gauss-Legendre transformation on (73) A2 = -1.4, A1+/A2/ =1.62 where A1 = amount of energy absorbed or work performed on the material per unit volume of material within the ultimate strength of material, J/m3 A1+A2 = amount of energy absorbed or work performed on the material per unit volume of material before fracture of material, J/m3 Similar evaluations for Figures 3b and 3c are found in Table 6. Table 6: Energy Absorption Data Figure A1(J/m3) A2(J/m3) A3(J/m3) 10a 0.025 -0.037 - 0.62 10b 0.22 -1.4 - 1.62 10c 0.1959 0.6373 - 0.83 10d 0.1531 0.8716 -0.5957 1.62 4.3.1 Total work done The area u nder the load-d is pl acemen t cu rv e repres ent s t he t ot al en er g y abs orb ed and it can b e calculated by multiplying the area under the stress-strain curve by the volume of the sample so that from previous calculations, the work of the samples can be presented as in Table 7. 4.3.2 Specific energy absorption (SEA) The specific energy absorption (SEA) is the most important factor in the design of the parts that are need ed to r educe t heir wei ght, such as cars , airplanes and mo torc ycles, etc. The SEA is the energy absorbed per the mass of the specimen. It can be calculated by dividing the energy absorbed by the mass of the sample as presented in Table 8. 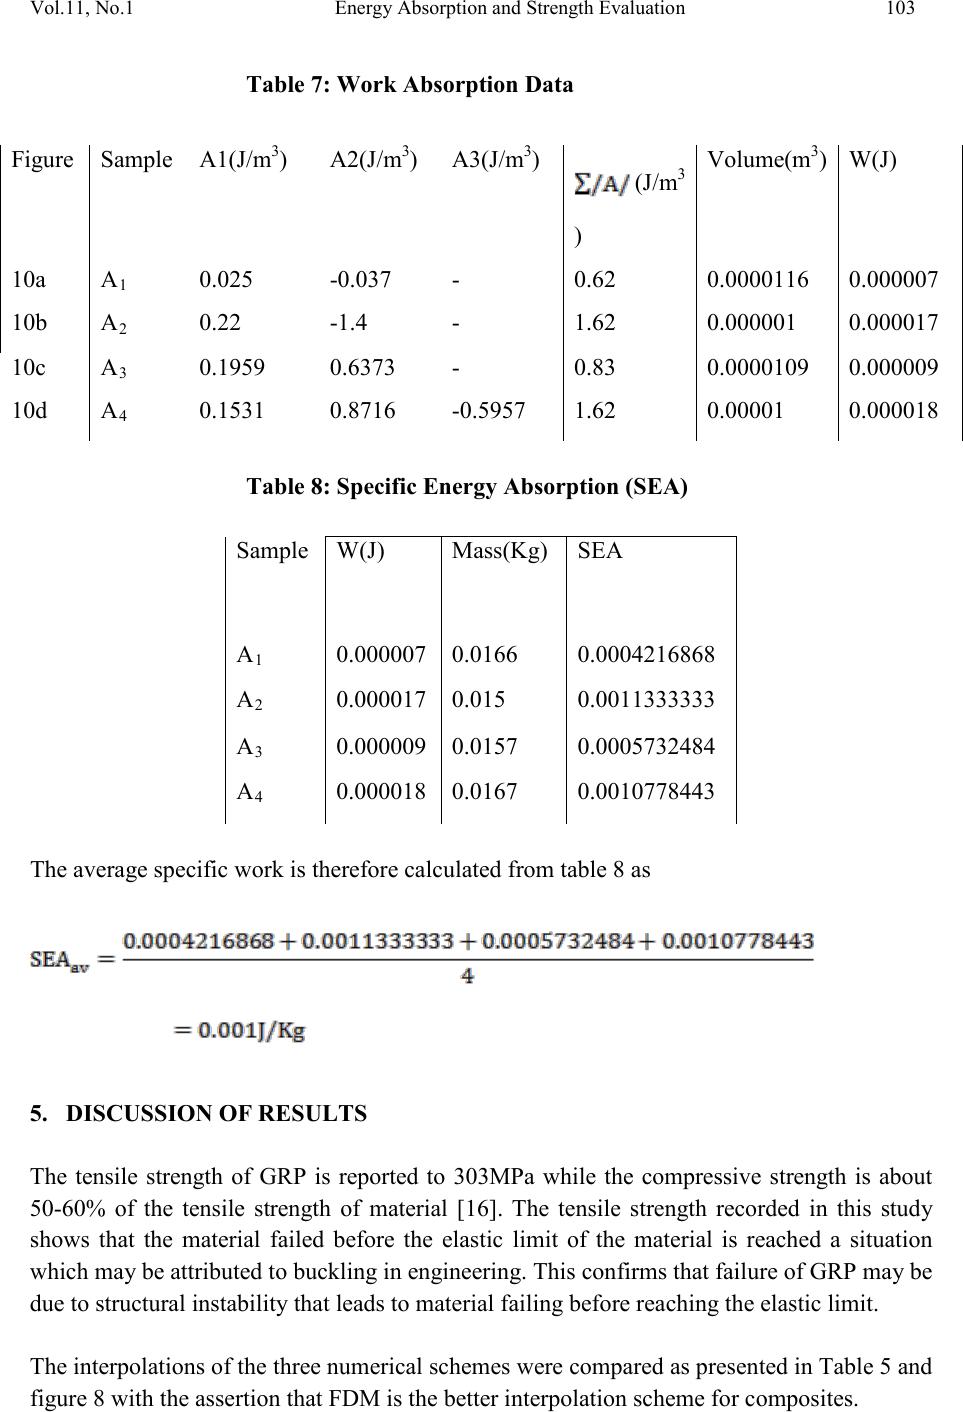 Vol.11, No.1 Energy Abs orption and S trength Evaluati on 103 Table 7: Work Absorption Data Figure Sample A1(J/m3) A2(J/m3) A3(J/m3) (J/m3 ) Volume(m3) W(J) 10a A 1 0.025 -0.037 - 0.62 0.0000116 0.000007 10b A 2 0.22 -1.4 - 1.62 0.000001 0.000017 10c A 3 0.1959 0.6373 - 0.83 0.0000109 0.000009 10d A 4 0.1531 0.8716 -0.5957 1.62 0.00001 0.000018 Table 8: Specific Energy Absorption (SEA) Sample W(J) Mass(Kg) SEA A 1 0.000007 0.0166 0.0004216868 A 2 0.000017 0.015 0.0011333333 A 3 0.000009 0.0157 0.0005732484 A 4 0.000018 0.0167 0.0010778443 The average specific work is therefore calculated from table 8 as 5. DISCUSSION OF RESULTS The tensile strength of GRP is reported to 303MPa while the compressive strength is about 50-60% of the tensile strength of material [16]. The tensile strength recorded in this study shows that the material failed before the elastic limit of the material is reached a situation which may be attributed to buckling in engineering. This confirms that failure of GRP may be due to structural instability that leads to material failing before reaching the elastic limit. The interpolations of the three numerical schemes were compared as presented in Table 5 and figure 8 with the assertion that FDM is the better interpolation scheme for composites. 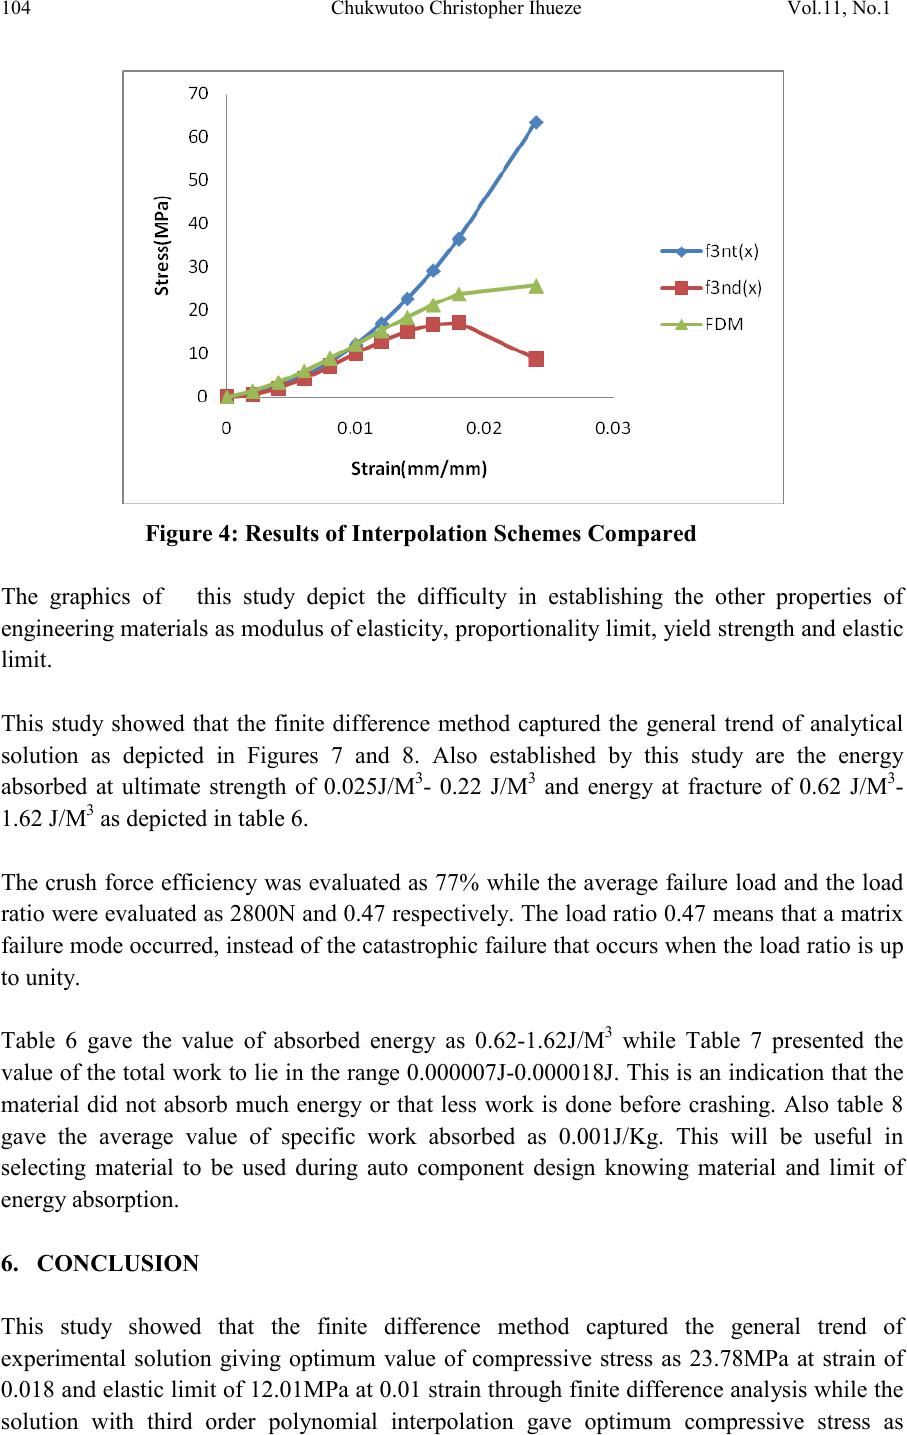 104 Chukwutoo Christopher Ihueze Vol.11, No.1 Figure 4: Results of Interpolation Schemes Compared The graphics of this study depict the difficulty in establishing the other properties of engineering materials as modulus of elasticity, proportionality limit, yield strength and elastic limit. This study showed that the finite difference method captured the general trend of analytical solution as depicted in Figures 7 and 8. Also established by this study are the energy absorbed at ultimate strength of 0.025J/M3- 0.22 J/M3 and energy at fracture of 0.62 J/M3- 1.62 J/M3 as depicted in table 6. The crush force efficiency was evaluated as 77% while the average failure load and the load ratio were evaluated as 2800N and 0.47 respectively. The load ratio 0.47 means that a matrix failure m ode occur red, i nst ead of the cat astro phic fai lure th at occurs when t he load ratio is up to unity. Table 6 gave the value of absorbed energy as 0.62-1.62J/M3 while Table 7 presented the value of the total work to lie in the range 0.000007J-0.000018J. This is an indication that the material did not absorb much energy or that less work is done before crashing. Also table 8 gave the average value of specific work absorbed as 0.001J/Kg. This will be useful in selecting material to be used during auto component design knowing material and limit of energy absorption. 6. CONCLUSION This study showed that the finite difference method captured the general trend of experimental solution giving optimum value of compressive stress as 23.78MPa at strain of 0.018 and elastic limit of 12.01MPa at 0.01 strain through finite difference anal ysis wh ile the solution with third order polynomial interpolation gave optimum compressive stress as  Vol.11, No.1 Energy Abs orption and S trength Evaluati on 105 36.57186MPa at 0.018 strain and elastic limit of 12.143MPa. Also established by this study are the compressive or buckling moduli of 1.2GPa, energy absorbed at ultimate strength of 0.025J/M3- 0.22 J/M3 and energy at crash of 0.62 J/M3- 1.62 J/M3 and specific work as 0.001J/Kg. Above all material with higher CFE will always be selected in design of energy absorbing systems. REFERENCES [1] www.woodheadpublishing [2] G.C. Jacob, J.F.Fellers,S.Simunovk and J.M.Sarbuck (2002). Energy Absorption in Polymer Composites for Automotive Crashworthiness, Journal of Composite Materials, April 2002, vol.36 (7), 813-850 [3] Budiansky, B. and Fleck, N.A., (19 94), Compressive kinking of fibre composites, Journal of Applied Mechanics, ASME, Vol. 47, No. 6 S 246 – 249. [4] Srinivasan Sridharan, (1994). Imperfection sensitivity of stiffened cylindrical shells under interactive buckling, ASME Journal of Applied Mechanics, Vo;. 47, No. 6, A 251 255 [5] Chung, I. and Weitsmam, .J.(1994), Model for Micro-Buckling/Micro-Kinking Compressive Response of Fibre Reinforced Composites ASME Journal of Applied Mechanics, Vol. 47, No. 6, S 256 – S 261 [6] Kyriakides, S., Perry, E.J., and Liechti, K.M. (1994): Instability and failure of fibre composites in compressive, ASME Journal of Applied Mechanics, Vol. 47, No. 6, S 262- 266 [7] HSU, S.Y., Vogler, T.J. and Kyriakides, S., (1998) Compressive Strength Predication for Fibre Composites, ASME Journal of Applied Mechanics, Vol. 65, Page 7-15. [8] Crawford, R.J., (1998), Plastics Engineering,3rd ed, Butterworth-Heinemann Publisher,Oxford [9] Foye, J.F., (1968) Technical Report AFML – TR – 68 – 91, North America Rockwell Corporation, Columbus, OH., USA. [10] Ihueze, C.C. (2005). Optimum Buckling Response Model of GRP Composites, Ph.D. Thesis. Mechanical Engineering Department, University of Nigeria [11] Hakim S. Sultan Aljibori (2010). Energy Absorption Characteristics and Crashing Parameters of Filament Glass Fiber /Epoxy Composite Tubes, European Journal of Scientific Research Vol.39 No.1 (2010), pp.111-121, EuroJournals Publishing, Inc. 2010 http://www.eurojournals.com/ejsr.htm [12] E.S. Shigley and C. R. Mishchke, Mechanical Designers Work Book: Corrosion and Wear, McGraw-Hill Publishing, (1989). [13] Steven C. Chapra and Raymond, P.C. (1998) Numerical Methods for Engineerings, 3ed, WCB/Mc Graw-Hill, Boston [14] Zill, D. G., and Cullen, M. R., (1989). Advanced Engineering Mathematics, Jones and Bartlett Publishers, Sudbury, Massachusetts [15] Tao Yin, Min Zhi Rong, Jingshen Wu, Haibin Chen and Ming Qiu Zhang. Healing of impact damage in woven glass fabric reinforced epoxy composites, J Applied Science and Manufacturing 2008; 39: 1479-1487 [16] Koshal, D., (1998). Manufacturing Engineers Reference book, Butterworth-Heinemann Publisher. |