

Paper Menu >>
Journal Menu >>
 Journal of Analytical Sciences, Methods and Instrumentation, 2012, 2, 98-102 http://dx.doi.org/10.4236/jasmi.2012.22018 Published Online June 2012 (http://www.SciRP.org/journal/jasmi) Developed New Procedure for Low Concentrations of Hydrazine Determination by Spectrophotometry: Hydrazine-Potassium Permanganate System S. Ganesh1, Fahmida Khan2, M. K. Ahmed1, P. Velavendan1, N. K. Pandey1, U. Kamachi Mudali1 1Reprocessing Group, Indira Gandhi Centre for Atomic Research, Kalpakkam, India; 2Department of Chemistry, National Institute of Technology, Raipur, India. Email: [email protected] Received October 12th, 2011; revised November 23rd, 2011; accepted January 9th, 2012 ABSTRACT An indirect, sensitive and accurate method for the determination of trace amounts of hydrazine is described. In this proposed the spectrophotometric method is based on its reduction properties of hydrazine with a known concentration of potassium permanganate to reduce the colour. The absorbance of unreduced permanganate is measured the colour difference at different wavelengths 546 and 526 nm which show an absorption spectrum with hydrazine. Hydrazine can be determined in the range of 100 - 700 µg/ml with correlation coefficient of 0.999 and relative standard deviation 1%. The method is successfully applied for the determination of hydrazine in water streams in nuclear reactors/purex proc- ess/boiler water and polluted water samples. Keywords: Hydrazine/Potassium Permanganate; UV-Vis Spectrophotometry; Reducing Property; Water Streams; Nuclear Reactors 1. Introduction Hydrazine and its analogues have found various applica- tions in many industrial, agriculture and other fields, in- cluding the manufacture of metal films, photographic chemicals, antioxidants, insecticides and blowing agents for plastics. In addition, hydrazines and their derivatives are suspected to be carcinogens. Hydrazine is widely used as a scavenger to remove traces of oxygen in boiler feed water system [1]. Several methods have been de- scribed for the determination of trace amounts of hydra- zine, including spectrophotometry, gas chromatography [2] and ion chromatography [3]. Most of these are based on the reaction of hydrazine with aromatic aldehydes such as benzaldehyde [4], salicylaldehyde [5], p-dimethyl- aminobenzaldehyde [6], pentafluorobenzaldehyde [7] and 5-nitro-2-hydroxybenzaldehyde [8] to form aldazines. Accordingly, their determination at the micro level is of great importance. Despite the accuracy of most of the redox methods [9,10] used for the determination of hy- drazines, only few are suitable for extremely dilute solu- tions, and some require carefully controlled conditions. Most of the spectrophotometric procedures available so far in the literatures [11-22] are tedious and involve the use of rare and expensive colour reagents. The present work describes a very simple, sensitive and accurate spectrophotometric procedure for the determination of ppm concentrations of hydrazine salts based on reaction with potassium permanganate and measurement of the decolourisation of permanganate. 2. Experimental 2.1. Instrumentation Fiber optic aided spectrophotometery with 1 cm path length probe is used for measuring absorbance. Metrohm make modular Ion-chromatograph equipped with 820 IC separation center, lambda 1010 IC detector (UV-VIS), 818 IC pump (Isocratic), 833 IC liquid han- dling unit and 830 IC interface and a Metrohm Post column derivatization kit were used. Sample was injected through a 20 µL PEEK loop fitted with injector. IC-net 2.3 metrohm software was used for instrument control and data acquisition. Ion Chromatographic Conditions Ion chromatograph: Metrohm modular Ion chromatog- raphy system Eluent concentration: 5 mM Hydrochloric acid Eluent flow rate: 0.4 ml/min Pressure: 13.5 MPa Detector: Lambda 1010 UV-VIS detector. Copyright © 2012 SciRes. JASMI 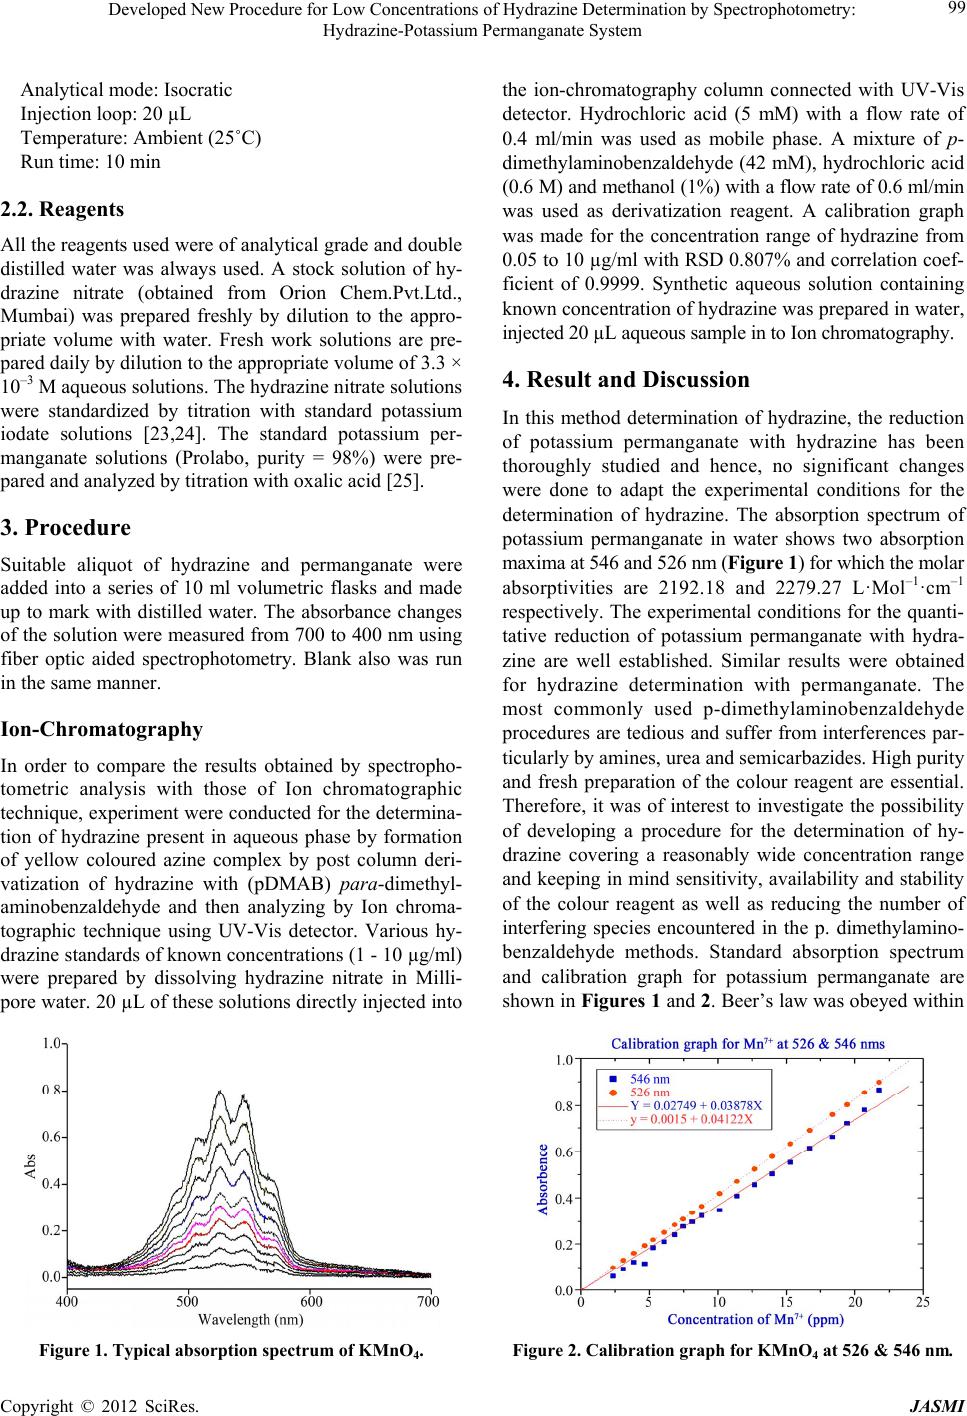 Developed New Procedure for Low Concentrations of Hydrazine Determination by Spectrophotometry: Hydrazine-Potassium Permanganate System 99 Analytical mode: Isocratic Injection loop: 20 µL Temperature: Ambient (25˚C) Run time: 10 min 2.2. Reagents All the reagents used were of analytical grade and double distilled water was always used. A stock solution of hy- drazine nitrate (obtained from Orion Chem.Pvt.Ltd., Mumbai) was prepared freshly by dilution to the appro- priate volume with water. Fresh work solutions are pre- pared daily by dilution to the appropriate volume of 3.3 × 10⁻³ M aqueous solutions. The hydrazine nitrate solutions were standardized by titration with standard potassium iodate solutions [23,24]. The standard potassium per- manganate solutions (Prolabo, purity = 98%) were pre- pared and analyzed by titration with oxalic acid [25]. 3. Procedure Suitable aliquot of hydrazine and permanganate were added into a series of 10 ml volumetric flasks and made up to mark with distilled water. The absorbance changes of the solution were measured from 700 to 400 nm using fiber optic aided spectrophotometry. Blank also was run in the same manner. Ion-Chromatography In order to compare the results obtained by spectropho- tometric analysis with those of Ion chromatographic technique, experiment were conducted for the determina- tion of hydrazine present in aqueous phase by formation of yellow coloured azine complex by post column deri- vatization of hydrazine with (pDMAB) para-dimethyl- aminobenzaldehyde and then analyzing by Ion chroma- tographic technique using UV-Vis detector. Various hy- drazine standards of known concentrations (1 - 10 µg/ml) were prepared by dissolving hydrazine nitrate in Milli- pore water. 20 µL of these solutions directly injected into In this method determination of hydrazine, the reduction of potassium permanganate with hydrazine has been thoroughly studied and hence, no significant changes were done to adapt the experimental conditions for the determination of hydrazine. The absorption spectrum of potassium permanganate in water shows two absorption maxima at 546 and 526 nm (Figure 1) for which the molar absorptivities are 2192.18 and 2279.27 L·Mol–1·cm–1 respectively. The experimental conditions for the quanti- tative reduction of potassium permanganate with hydra- zine are well established. Similar results were obtained for hydrazine determination with permanganate. The most commonly used p-dimethylaminobenzaldehyde procedures are tedious and suffer from interferences par- ticularly by amines, urea and semicarbazides. High purity and fresh preparation of the colour reagent are essential. Therefore, it was of interest to investigate the possibility of developing a procedure for the determination of hy- drazine covering a reasonably wide concentration range and keeping in mind sensitivity, availability and stability of the colour reagent as well as reducing the number of interfering species encountered in the p. dimethylamino- benzaldehyde methods. Standard absorption spectrum and calibration graph for potassium permanganate are shown in Figures 1 and 2. Beer’s law was obeyed within the ion-chromatography column connected with UV-Vis detector. Hydrochloric acid (5 mM) with a flow rate of 0.4 ml/min was used as mobile phase. A mixture of p- dimethylaminobenzaldehyde (42 mM), hydrochloric acid (0.6 M) and methanol (1%) with a flow rate of 0.6 ml/min was used as derivatization reagent. A calibration graph was made for the concentration range of hydrazine from 0.05 to 10 µg/ml with RSD 0.807% and correlation coef- ficient of 0.9999. Synthetic aqueous solution containing known concentration of hydrazine was prepared in water, injected 20 µL aqueous sample in to Ion chromatography. 4. Result and Discussion Figure 1. Typical absorption spectrum of KMnO4. Figure 2. Calibration graph for KMnO4 at 526 & 546 nm. Copyright © 2012 SciRes. JASMI 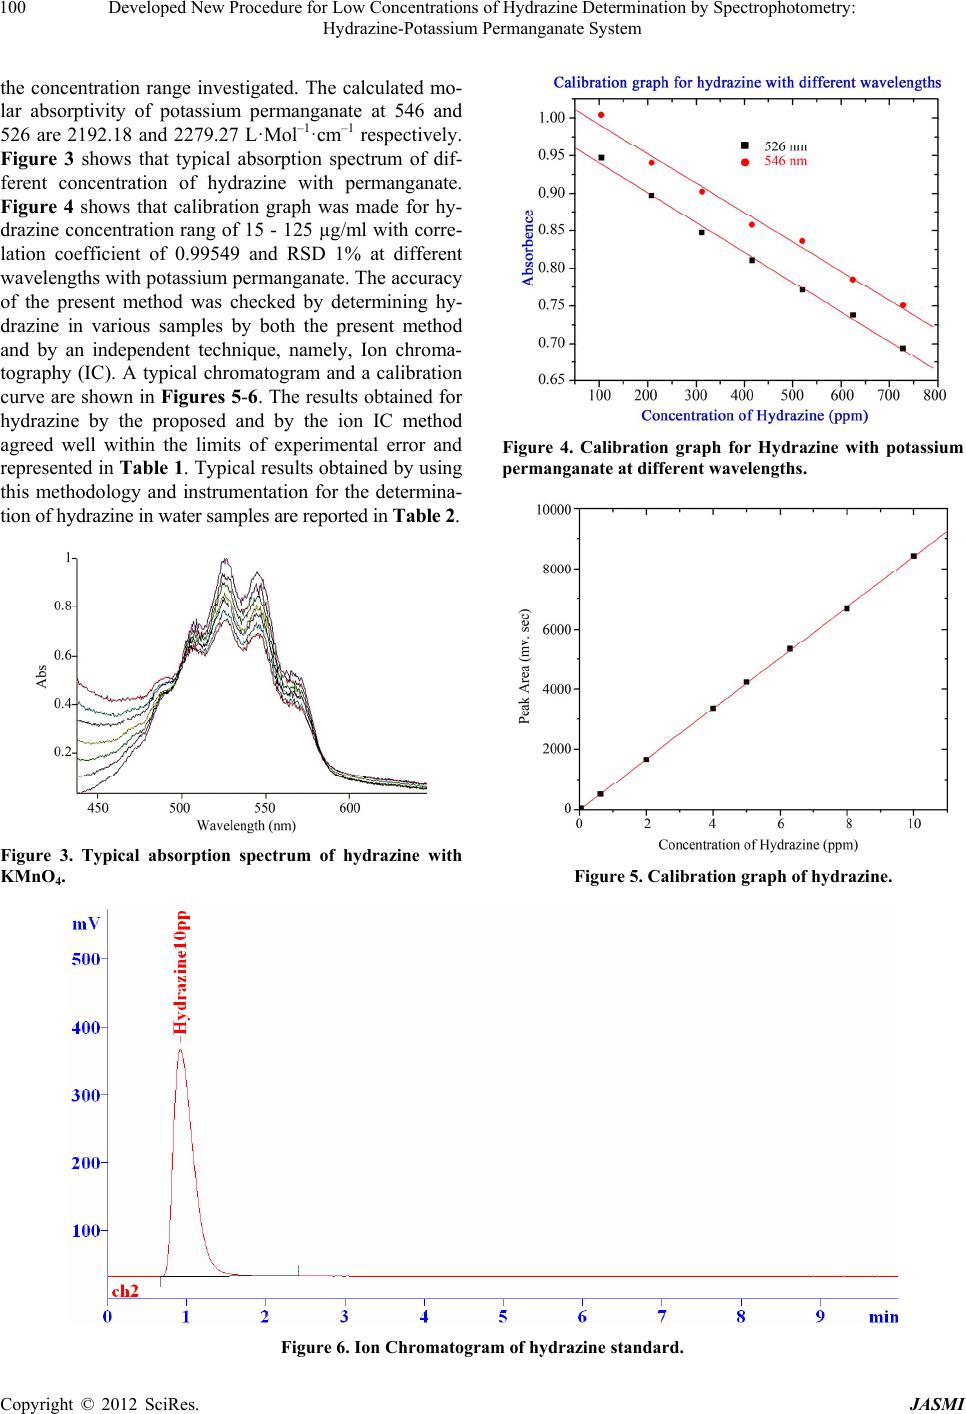 Developed New Procedure for Low Concentrations of Hydrazine Determination by Spectrophotometry: Hydrazine-Potassium Permanganate System 100 the concentration range investigated. The calculated mo- lar absorptivity of potassium permanganate at 546 and 526 are 2192.18 and 2279.27 L·Mol–1·cm–1 respectively. Figure 3 shows that typical absorption spectrum of dif- ferent concentration of hydrazine with permanganate. Figure 4 shows that calibration graph was made for hy- drazine concentration rang of 15 - 125 µg/ml with corre- lation coefficient of 0.99549 and RSD 1% at different wavelengths with potassium permanganate. The accuracy of the present method was checked by determining hy- drazine in various samples by both the present method and by an independent technique, namely, Ion chroma- tography (IC). A typical chromatogram and a calibration curve are shown in Figures 5-6. The results obtained for hydrazine by the proposed and by the ion IC method agreed well within the limits of experimental error and represented in Table 1. Typical results obtained by using this methodology and instrumentation for the determina- tion of hydrazine in water samples are reported in Table 2. Figure 3. Typical absorption spectrum of hydrazine with KMnO4. Figure 4. Calibration graph for Hydrazine with potassium permanganate at different wavelengths. Figure 5. Calibration graph of hydrazine. Figure 6. Ion Chromatogram of hydrazine standard. Copyright © 2012 SciRes. JASMI 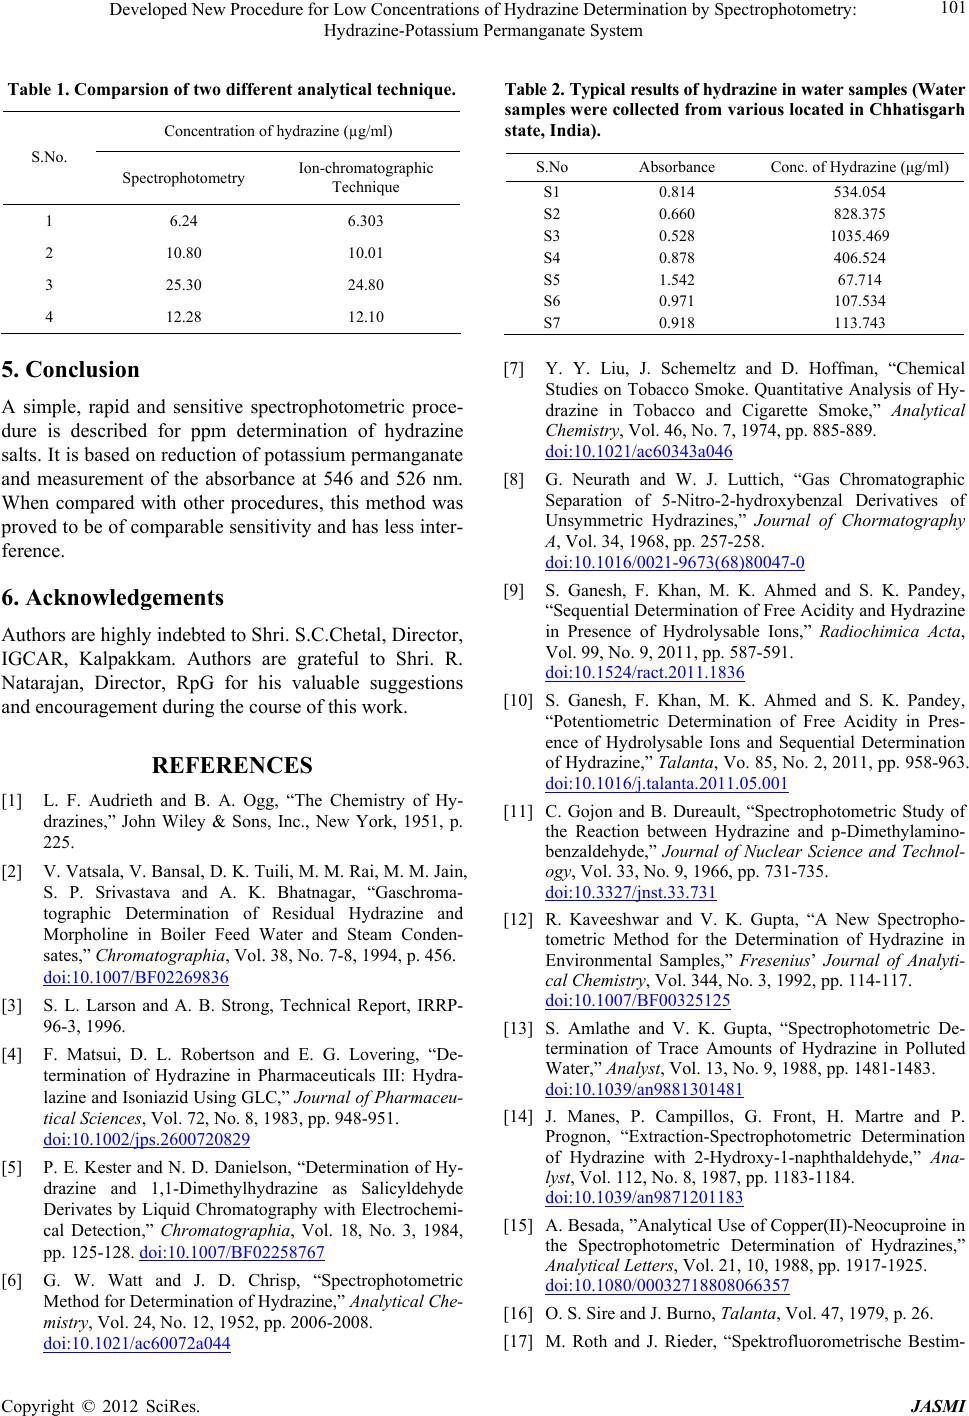 Developed New Procedure for Low Concentrations of Hydrazine Determination by Spectrophotometry: Hydrazine-Potassium Permanganate System 101 Table 1. Comparsion of two different analytical technique. Concentration of hydrazine (µg/ml) S.No. Spectrophotometry Ion-chromatographic Technique 1 6.24 6.303 2 10.80 10.01 3 25.30 24.80 4 12.28 12.10 Table 2. Typical results of hydrazine in water samples (Water samples were collected from various located in Chhatisgarh state, India). S.No Absorbance Conc. of Hydrazine (μg/ml) S1 0.814 534.054 S2 0.660 828.375 S3 0.528 1035.469 S4 0.878 406.524 S5 1.542 67.714 S6 0.971 107.534 S7 0.918 113.743 5. Conclusion A simple, rapid and sensitive spectrophotometric proce- dure is described for ppm determination of hydrazine salts. It is based on reduction of potassium permanganate and measurement of the absorbance at 546 and 526 nm. When compared with other procedures, this method was proved to be of comparable sensitivity and has less inter- ference. 6. Acknowledgements Authors are highly indebted to Shri. S.C.Chetal, Director, IGCAR, Kalpakkam. Authors are grateful to Shri. R. Natarajan, Director, RpG for his valuable suggestions and encouragement during the course of this work. REFERENCES [1] L. F. Audrieth and B. A. Ogg, “The Chemistry of Hy- drazines,” John Wiley & Sons, Inc., New York, 1951, p. 225. [2] V. Vatsala, V. Bansal, D. K. Tuili, M. M. Rai, M. M. Jain, S. P. Srivastava and A. K. Bhatnagar, “Gaschroma- tographic Determination of Residual Hydrazine and Morpholine in Boiler Feed Water and Steam Conden- sates,” Chromatographia, Vol. 38, No. 7-8, 1994, p. 456. doi:10.1007/BF02269836 [3] S. L. Larson and A. B. Strong, Technical Report, IRRP- 96-3, 1996. [4] F. Matsui, D. L. Robertson and E. G. Lovering, “De- termination of Hydrazine in Pharmaceuticals III: Hydra- lazine and Isoniazid Using GLC,” Journal of Pharmaceu- tical Sciences, Vol. 72, No. 8, 1983, pp. 948-951. doi:10.1002/jps.2600720829 [5] P. E. Kester and N. D. Danielson, “Determination of Hy- drazine and 1,1-Dimethylhydrazine as Salicyldehyde Derivates by Liquid Chromatography with Electrochemi- cal Detection,” Chromatographia, Vol. 18, No. 3, 1984, pp. 125-128. doi:10.1007/BF02258767 [6] G. W. Watt and J. D. Chrisp, “Spectrophotometric Method for Determination of Hydrazine,” Analytical Che- mistry, Vol. 24, No. 12, 1952, pp. 2006-2008. doi:10.1021/ac60072a044 [7] Y. Y. Liu, J. Schemeltz and D. Hoffman, “Chemical Studies on Tobacco Smoke. Quantitative Analysis of Hy- drazine in Tobacco and Cigarette Smoke,” Analytical Chemistry, Vol. 46, No. 7, 1974, pp. 885-889. doi:10.1021/ac60343a046 [8] G. Neurath and W. J. Luttich, “Gas Chromatographic Separation of 5-Nitro-2-hydroxybenzal Derivatives of Unsymmetric Hydrazines,” Journal of Chormatography A, Vol. 34, 1968, pp. 257-258. doi:10.1016/0021-9673(68)80047-0 [9] S. Ganesh, F. Khan, M. K. Ahmed and S. K. Pandey, “Sequential Determination of Free Acidity and Hydrazine in Presence of Hydrolysable Ions,” Radiochimica Acta, Vol. 99, No. 9, 2011, pp. 587-591. doi:10.1524/ract.2011.1836 [10] S. Ganesh, F. Khan, M. K. Ahmed and S. K. Pandey, “Potentiometric Determination of Free Acidity in Pres- ence of Hydrolysable Ions and Sequential Determination of Hydrazine,” Talanta, Vo. 85, No. 2, 2011, pp. 958-963. doi:10.1016/j.talanta.2011.05.001 [11] C. Gojon and B. Dureault, “Spectrophotometric Study of the Reaction between Hydrazine and p-Dimethylamino- benzaldehyde,” Journal of Nuclear Science and Technol- ogy, Vol. 33, No. 9, 1966, pp. 731-735. doi:10.3327/jnst.33.731 [12] R. Kaveeshwar and V. K. Gupta, “A New Spectropho- tometric Method for the Determination of Hydrazine in Environmental Samples,” Fresenius’ Journal of Analyti- cal Chemistry, Vol. 344, No. 3, 1992, pp. 114-117. doi:10.1007/BF00325125 [13] S. Amlathe and V. K. Gupta, “Spectrophotometric De- termination of Trace Amounts of Hydrazine in Polluted Water,” Analyst, Vol. 13, No. 9, 1988, pp. 1481-1483. doi:10.1039/an9881301481 [14] J. Manes, P. Campillos, G. Front, H. Martre and P. Prognon, “Extraction-Spectrophotometric Determination of Hydrazine with 2-Hydroxy-1-naphthaldehyde,” Ana- lyst, Vol. 112, No. 8, 1987, pp. 1183-1184. doi:10.1039/an9871201183 [15] A. Besada, ”Analytical Use of Copper(II)-Neocuproine in the Spectrophotometric Determination of Hydrazines,” Analytical Letters, Vol. 21, 10, 1988, pp. 1917-1925. doi:10.1080/00032718808066357 [16] O. S. Sire and J. Burno, Talanta, Vol. 47, 1979, p. 26. [17] M. Roth and J. Rieder, “Spektrofluorometrische Bestim- Copyright © 2012 SciRes. JASMI  Developed New Procedure for Low Concentrations of Hydrazine Determination by Spectrophotometry: Hydrazine-Potassium Permanganate System 102 mung von Hydrazinen und Deren Anwendungzur Quanti- tativen Bestimmung von Benzylhydrazin in Biologischen Proben,” Analytica Chimica Acta, Vol. 27, 1962, pp. 20- 26. doi:10.1016/S0003-2670(00)88442-1 [18] T. Pal, D. S. Maity and A. Ganguly, “Use of a Silver- Gelatin Complex for the Determination of Micro- Amounts of Hydrazine in Water,” Analyst, Vol. 111, No. 12, 1986, pp. 1413-1415. doi:10.1039/an9861101413 [19] A. Besada, “A Simple Spectrophotometric Method for the Determination of Hydrazine Salts by Reaction with Phos- phomolybdic Acid,” Mikrochimica Acta, Vol. 111, No. 5-6, 1985, pp. 343-346. doi:10.1007/BF01196832 [20] R. P. V. Krishna, R. R. Samba Siva and C. Rambabu, Acta Ciencia Indica, Vol. 4, 1978, p. 13. [21] M. George, K. S. Nagaraj and N. Balasubramanian, “Spectrophotometric Determination of Hydrazine,” Ta- lanta, Vol. 75, No. 1, 2008, pp. 27-31. doi:10.1016/j.talanta.2007.09.002 [22] A. M. Haji Shabani, S. Dadfarnia and K. Dehghan, “Indi- rect Spectrophotometric Determination of Trace Quanti- ties of Hydrazine,” Bulletin of the Korean Chemical Soci- ety, Vol. 25, No. 2, 2004, pp. 213-215. doi:10.5012/bkcs.2004.25.2.213 [23] J. Mendham, R. C. Denney, J. D. Barnes and M. Thomas, “Vogel’s Text Book of Quantitative Chemical Analysis,” 6th Edition, 2002, p. 441. [24] S. Ganesh, F. Khan, M. K. Ahmed and S. K. Pandey, “Sequential Determination of Uranium(IV), Free Acidity and Hydrazine in a Single Aliquot,” Journal of Radio- analytical and Nuclear Chemistry, Vol. 286, No. 1, 2010, pp. 33-37. doi:10.1007/s10967-010-0663-9 [25] J. Mendham, R. C. Denney, J. D. Barnes and M. Thomas, “Vogel’s Text book of Quantitative Chemical Analysis,” 6th Edition, 2002, p. 350. Copyright © 2012 SciRes. JASMI |