

Paper Menu >>
Journal Menu >>
 Journal of Environmental Protection, 2010, 1, 111-116 doi:10.4236/jep.2010.12014 Published Online June 2010 (http://www.SciRP.org/journal/jep) Copyright © 2010 SciRes. JEP Spectral Analysis of Solar Variability and their Possible Role on the Global Warming Mohamed Ali El-Borie1, Eman Shafik2, Aly Abdel-moneim Abdel-halim2, Shady Youssri El-Monier2 1Physics Department, Faculty of Science, Alexandria University, Alexandria, Egypt; 2Arab Academy for Science & Technology and Maritime Transport, Alexandria, Egypt. Email: [email protected] Received March 28th, 2010; revised April 25th, 2010; accepted April 29th, 2010. ABSTRACT Our understanding of the indirect effect of changes in solar output and feedbacks in the climate system is minimal. There is much need to refine our understanding of key natural forcing mechanisms of the climate, including solar ir- radiance changes, in order to reduce uncertainty in our projections of future climate change. Through the recent years, the conflict between researchers about whether global warming is a human-generated phenomenon or a result of solar variability has raised many question marks. The aim of this work is to try to answer some of these questions by studying the possible role of some solar variability parameters such as the geomagnetic index (aa) and the sunspot number (Rz) in global temperature changes. Here, we present a correlative study of the possible contributions for the two compo- nents that may be closely associated with the climate, throughout the last 130 years (1880-2008). We compared the correlation analysis and the power spectral density (PSD) of the Rz and aa with that of the continuous records of the GT in order to get a closer look at a possible connection between them. Our results displayed that the correlations be- tween both (aa & GST) and (Rz & GST) are +0.66 and +0.38, respectively when both parameters Rz and aa precedes by 2-3 yrs. The correlation of GST-aa is two times higher than that of GST-Rz. The GST spectrum reflected significant periods at 21.3-yr, 10.7-11.6 yr variations that observed in the considered geomagnetic and sunspot spectra. Keywords: Global Rurface Temperature, Geomagnetic Indices, Solar Variability 1. Introduction The debate concerning global warming has been the concern of researchers for a long time. Global warming is a term used to describe an increase over time of the average temperature of the Earth’s atmosphere and oceans. It plays an important role in the ongoing public debate concerning global warming and the risk of man-made climate change. Where the global surface temperature has increased by factor 0.8 ℃± 0.02℃ is observed in the last 150 yr [1]. Researchers have attrib- uted the increase in global surface temperature to the rise in greenhouse effect caused by the increase of carbon dioxide emitted by man made [2], others attributed global warming to the decrease of the sulfate aerosols. Climate models, driven by estimates of increasing CO2 and to a lesser extent by generally decreasing sulfate aerosols, predict that temperatures will increase (with a range of 1.4 ℃to 5.8 ℃for the years between 1990 and 2100). There are many other parameter that effect on the global surface temperature similar solar activity. The effect of solar cycle lengths upon global temperature changes has also been the concern of researchers [3,4]. Other [5] demonstrated a strong correlation between so- lar cycle lengths and Northern Hemisphere temperatures over the period 1860-1990. Following studies [3-6] have taken an update data of the same results. Indices of geomagnetic disturbances measure the re- sponse of energetic solar eruptions that actually affect the Earth. Geomagnetic activity aa seems to be the possible link through which the solar activity controls the Earth’s climate [1,7]. Near-Earth variations in the solar wind, measured by the aa geomagnetic activity index, have displayed good correlations with global temperature [1]. Study of [8] found that the total magnetic flux, leaving the Sun and driven by the solar wind, has risen by a fac- tor 2.3 since 1901, leading to the global temperature has increased by 0.5℃. In addition, the solar energetic erup- tions, which dragged out or/and organized by the ob- served variations in the solar wind, are closely correlated with the near-Earth environment [9,10].  Spectral Analysis of Solar Variability and Their Possible Role on the Global Warming 112 After work of [4], they found that the approximately 1.1℃ increase in global mean temperature since 1877 is unlikely to be entirely a product of internal climate vari- ability. Nearly 40% of the variation in global surface temperature could be accommodated by concurrent al- terations in geomagnetic aa and solar activity indices. Climate commitment studies predicted even if levels of greenhouse gases and solar parameters are to remain constant, the global climate is committed to 0.5℃ of warming over the next one hundred years due to the lag in warming caused by the oceans. There are many other parameters expel from Sun which have a high effect to changes in the global surface temperature as the ultra- violet radiation affect the ozone in the upper atmosphere, as well as the solar modulation effect on cosmic rays which in turn may affect the cloud cover and in turn lead temperature changes [11]. In the present work, we investigate the possibility role of some solar indices on climatic variable represented by changes of global surface temperature. Indices of solar disturbance measure the near-Earth variations in the solar wind, have been studied. Here, we present a correlative study of the possible contributions for the two compo- nents that may be closely associated with the climate, throughout the last 128 years (1880-2008). The two pa- rameters are geomagnetic activity aa and the sunspots number Rz. 2. Data and Analysis The yearly of GT, aa, and Rz for the period 1880-2008 have been used in the present work. Data for the global surface temperature over the period 1880-2008 are avail- able (http://data.giss.nasa.gov/gistemp/tabledata/GLB.Ts. txt). In addition, the sunspot numbers Rz were provided via the National Geophysics and Solar Terrestrial Data Center (http://www.ngdc.noaa.gov/stp/GEOMAG/aastar. shtml), as well as the geomagnetics aa were taken from the (http://www.wdcb.rssi.ru/stp/data/geomagni.ind/aa/aa/ AA_MONTH). Linear regression has been used to de- termine the degree of similarity between two signals with zero lag. If the signals are identical, then the correlation coefficient is 1; if they are totally different, the correla- tion coefficient is 0, and if the phase is shifted by exactly 180º, then the correlation coefficient is –1. Secondly, the running cross-correlation was applied to find the similar- ity between two signals with lag time (τ). Thirdly, a se- ries of power spectral density (PSD) have been per- formed to yield the power spectral density (PSD). The results were smoothed using the Hanning window func- tion. This is necessary since most of the disturbed fea- tures will completely disappear, while the significant peaks are clearly defined. Nevertheless, the particular window chosen dose not shifts the positions of the spec- tral peaks. Next, each spectrum is independently normal- ized to the largest peak in the complete spectrum. This restriction was chosen in order to avoid spurious strengths often associated with peaks near the start and end of the data set. This normalization dose not intro- duces any errors into our identification of the peaks be- cause it changes only the relative amplitude and not the position of the peak spectrum. 3. Results and Discussion The Sun expels several products of its activity to the inter- planetary medium, namely electromagnetic radiation, ener- getic particles, solar wind and transient ejecta with a frozen in magnetic field. The solar radiation is the fundamental source of energy that drives the Earth’s climate and sus- tains life. The variability of this output certainly affects our planet. The solar wind is pumped up with intense magnetic fields that extend far out into interplanetary space, blocking more cosmic rays that would be arrived the Earth. The resulting decrease in cosmic rays mean that fewer energetic particles penetrate to lower atmosphere where there may help produce cloud, particularly at higher latitudes where the shielding by Earth’s magnetic field is less. The reduc- tion of clouds that reflect sunlight, would explain why the global surface temperature gets hotter when the Sun is more active. Also, the variability in ultraviolet radiation expels from the Sun affects the ozone in the upper atmos- phere and thus may lead to a temperature change. Thus, solar variability provides a reasonable match to the detailed ups and downs of the temperature record [12]. The longest historical record of the solar variability is the sunspot num- ber. It is the number of the dark spot that appear in photo- sphere and it reflects the magnetic activity of the Sun. Fol- lowing, the aa index, the time series characterizing the geomagnetic activity disturbances, provides the longest data set of solar proxies which goes back to 1868 [13]. The role of geomagnetic activity in the climate change became a topic theme of many recent studies. Close relations during the last 60 years were found between the geomagnetic ac- tivity and surface air temperature [14]. Figure 1 shows the 5-year running averages of annual global surface temperature (GST), geomagnetic indices (aa) and sunspot number (Rz). Plot 1a shows the varia- tion of the global surface with time series from 1880- 2008. The considered period has been divided into three sub-periods. The first (1880-1940) named as the first warming period in which we can see that the annual mean temperature showed a sustained warming of about +0.36℃ (+0.06℃/decade). A second period (1940-1970) called global cooling period where there was a cooling of about –0.13℃ (~ –0.04℃/decade). The third period is the second warming period (1970-2008) which we can see that the annual mean temperature showed a sustained warming of about +0.76℃ (+0.19℃/decade). The in- crease in GST for the recent year (1970-2008) was faster and smoother than the first period (1880-1940). Plot 1b (solid line) shows the cyclic variation for geo- magnetic activity aa, where it has an increasing trend in Copyright © 2010 SciRes. JEP 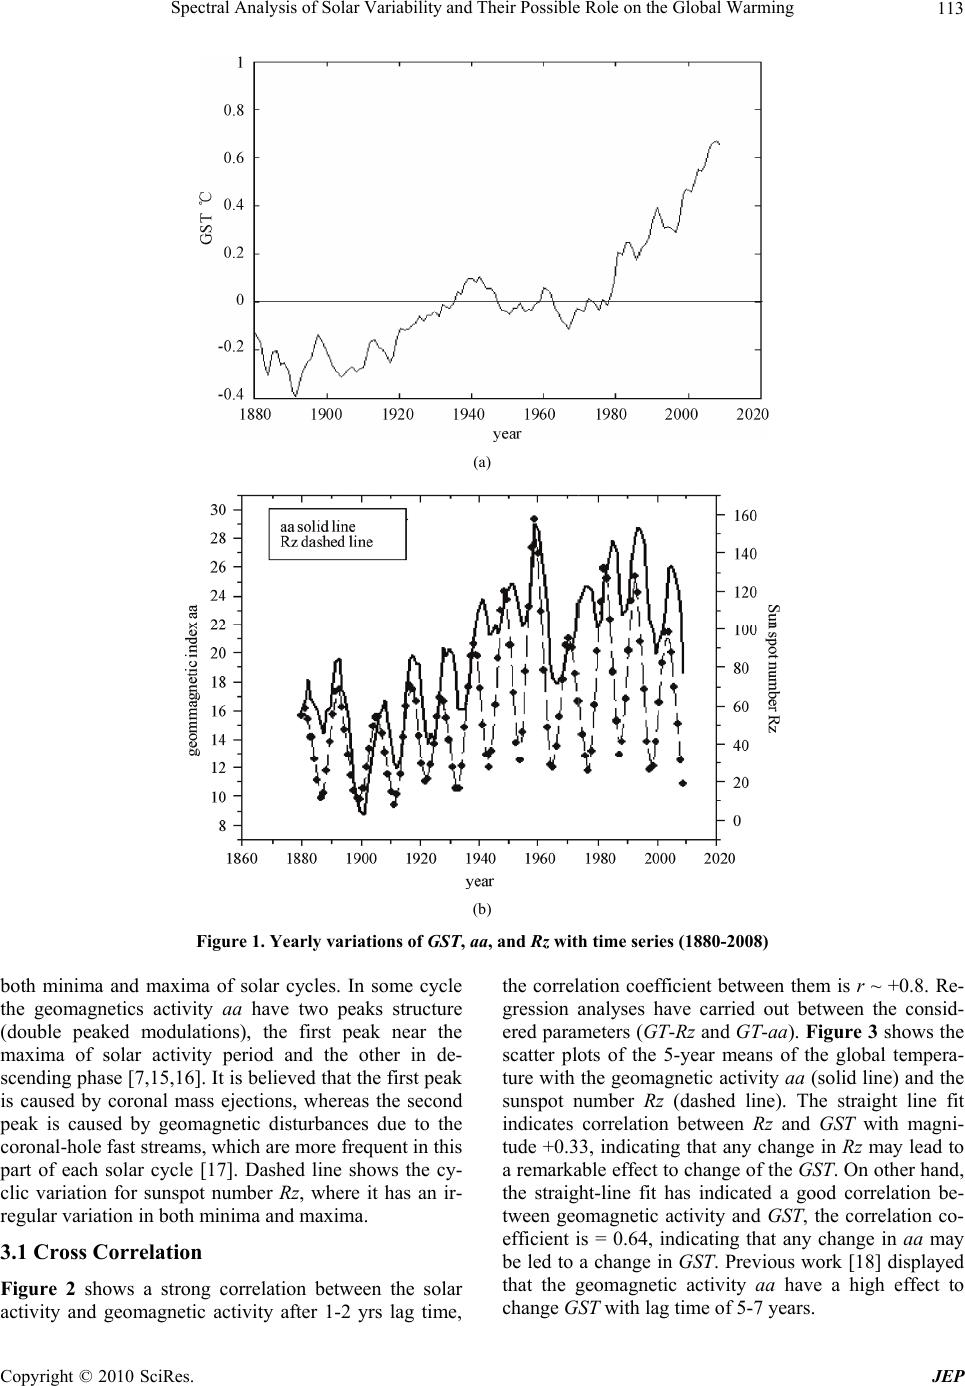 Spectral Analysis of Solar Variability and Their Possible Role on the Global Warming 113 (a) (b) Figure 1. Yearly variations of GST, aa, and Rz with time series (1880-2008) both minima and maxima of solar cycles. In some cycle the geomagnetics activity aa have two peaks structure (double peaked modulations), the first peak near the maxima of solar activity period and the other in de- scending phase [7,15,16]. It is believed that the first peak is caused by coronal mass ejections, whereas the second peak is caused by geomagnetic disturbances due to the coronal-hole fast streams, which are more frequent in this part of each solar cycle [17]. Dashed line shows the cy- clic variation for sunspot number Rz, where it has an ir- regular variation in both minima and maxima. 3.1 Cross Correlation Figure 2 shows a strong correlation between the solar activity and geomagnetic activity after 1-2 yrs lag time, the correlation coefficient between them is r ~ +0.8. Re- gression analyses have carried out between the consid- ered parameters (GT-Rz and GT-aa). Figure 3 shows the scatter plots of the 5-year means of the global tempera- ture with the geomagnetic activity aa (solid line) and the sunspot number Rz (dashed line). The straight line fit indicates correlation between Rz and GST with magni- tude +0.33, indicating that any change in Rz may lead to a remarkable effect to change of the GST. On other hand, the straight-line fit has indicated a good correlation be- tween geomagnetic activity and GST, the correlation co- efficient is = 0.64, indicating that any change in aa may be led to a change in GST. Previous work [18] displayed that the geomagnetic activity aa have a high effect to change GST with lag time of 5-7 years. Copyright © 2010 SciRes. JEP 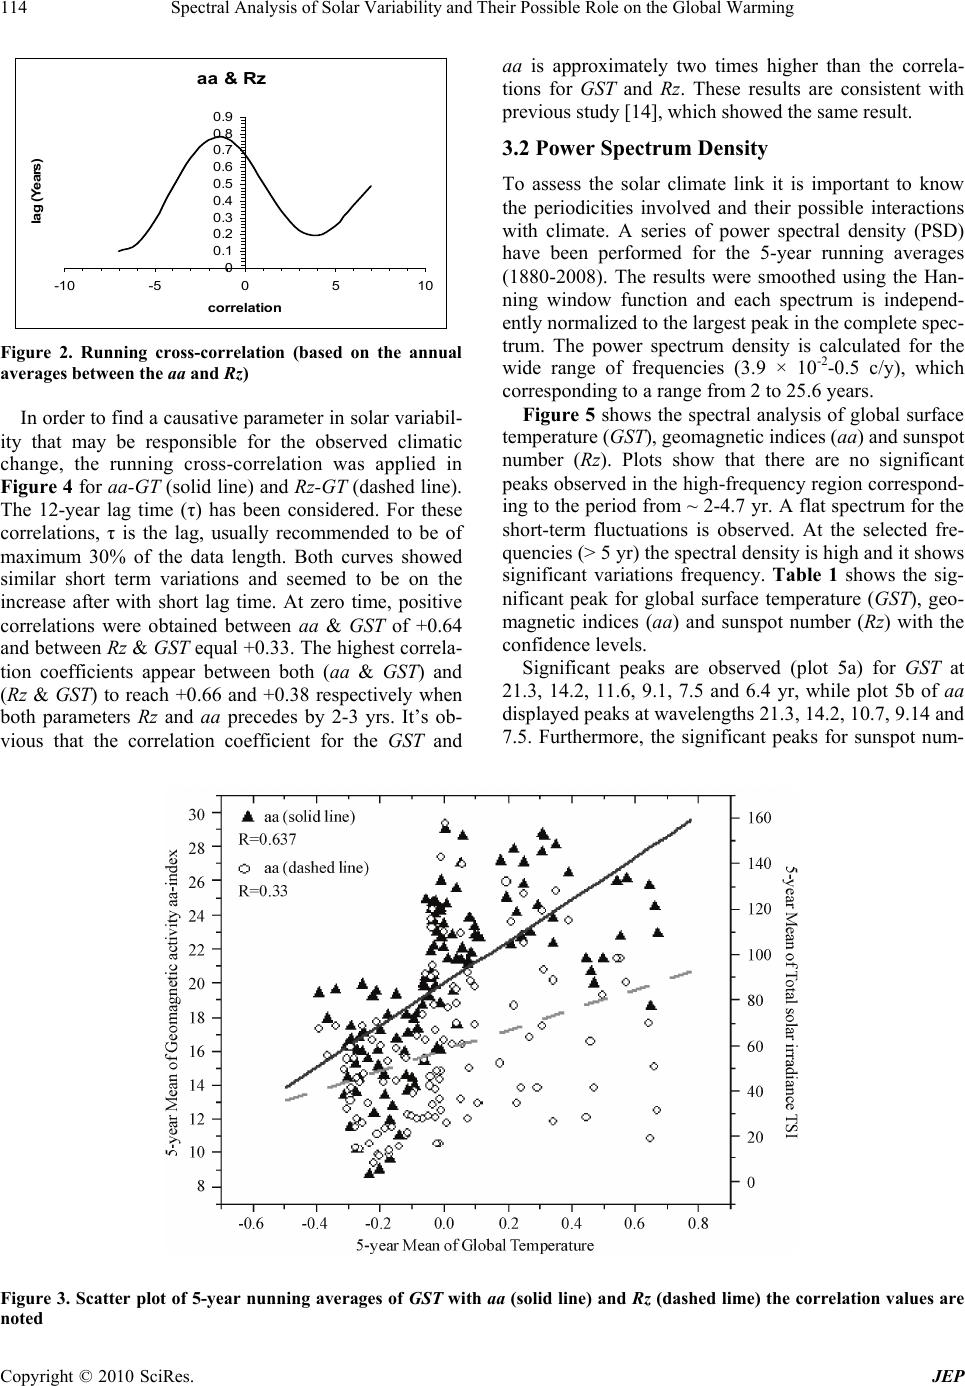 Spectral Analysis of Solar Variability and Their Possible Role on the Global Warming 114 aa & Rz 0 0.1 0.2 0.3 0.4 0.5 0.6 0.7 0.8 0.9 -10 -50510 correlation lag (Years) Figure 2. Running cross-correlation (based on the annual averages between the aa and Rz) In order to find a causative parameter in solar variabil- ity that may be responsible for the observed climatic change, the running cross-correlation was applied in Figure 4 for aa-GT (solid line) and Rz-GT (dashed line). The 12-year lag time (τ) has been considered. For these correlations, τ is the lag, usually recommended to be of maximum 30% of the data length. Both curves showed similar short term variations and seemed to be on the increase after with short lag time. At zero time, positive correlations were obtained between aa & GST of +0.64 and between Rz & GST equal +0.33. The highest correla- tion coefficients appear between both (aa & GST) and (Rz & GST) to reach +0.66 and +0.38 respectively when both parameters Rz and aa precedes by 2-3 yrs. It’s ob- vious that the correlation coefficient for the GST and aa is approximately two times higher than the correla- tions for GST and Rz. These results are consistent with previous study [14], which showed the same result. 3.2 Power Spectrum Density To assess the solar climate link it is important to know the periodicities involved and their possible interactions with climate. A series of power spectral density (PSD) have been performed for the 5-year running averages (1880-2008). The results were smoothed using the Han- ning window function and each spectrum is independ- ently normalized to the largest peak in the complete spec- trum. The power spectrum density is calculated for the wide range of frequencies (3.9 × 10⁻²-0.5 c/y), which corresponding to a range from 2 to 25.6 years. Figure 5 shows the spectral analysis of global surface temperature (GST), geomagnetic indices (aa) and sunspot number (Rz). Plots show that there are no significant peaks observed in the high-frequency region correspond- ing to the period from ~ 2-4.7 yr. A flat spectrum for the short-term fluctuations is observed. At the selected fre- quencies (> 5 yr) the spectral density is high and it shows significant variations frequency. Table 1 shows the sig- nificant peak for global surface temperature (GST), geo- magnetic indices (aa) and sunspot number (Rz) with the confidence levels. Significant peaks are observed (plot 5a) for GST at 21.3, 14.2, 11.6, 9.1, 7.5 and 6.4 yr, while plot 5b of aa displayed peaks at wavelengths 21.3, 14.2, 10.7, 9.14 and 7.5. Furthermore, the significant peaks for sunspot num- Figure 3. Scatter plot of 5-year nunning averages of GST with aa (solid line) and Rz (dashed lime) the correlation values are noted Copyright © 2010 SciRes. JEP 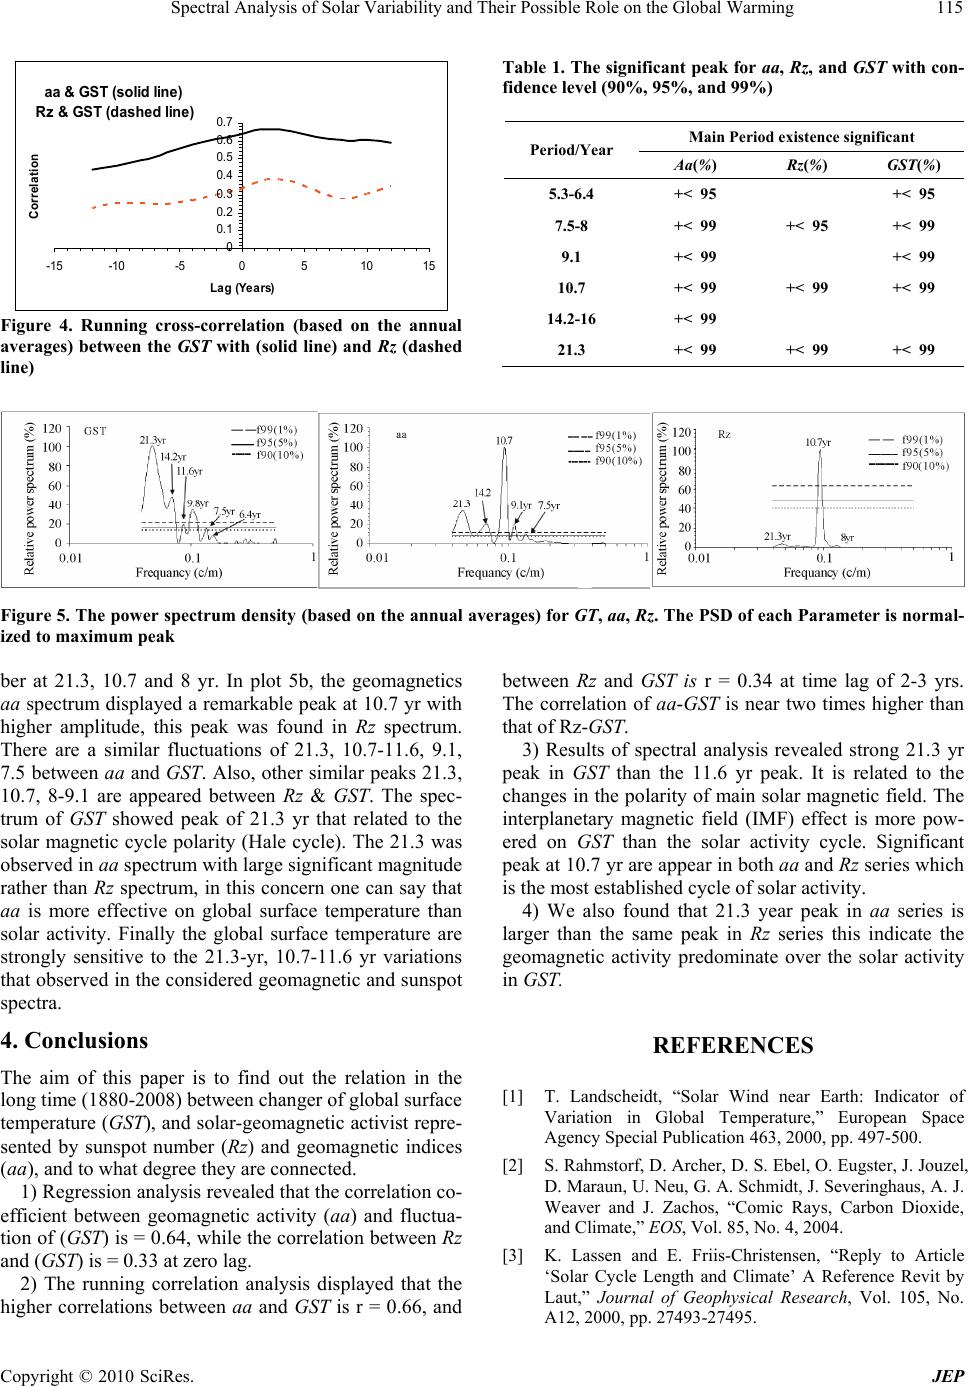 Spectral Analysis of Solar Variability and Their Possible Role on the Global Warming115 aa & GST (solid line) Rz & GST (dashed line) 0 0. 1 0. 2 0. 3 0. 4 0. 5 0. 6 0. 7 -15 -10-5051015 Lag (Years) Correl ation Figure 4. Running cross-correlation (based on the annual averages) between the GST with (solid line) and Rz (dashed line) Table 1. The significant peak for aa, Rz, and GST with con- fidence level (90%, 95%, and 99%) Main Period existence significant Period/Year Aa(%) Rz(%) GST(%) 5.3-6.4 +< 95 +< 95 7.5-8 +< 99 +< 95 +< 99 9.1 +< 99 +< 99 10.7 +< 99 +< 99 +< 99 14.2-16 +< 99 21.3 +< 99 +< 99 +< 99 Figure 5. The power spectrum density (based on the annual averages) for GT, aa, Rz. The PSD of each Parameter is normal- ized to maximum peak ber at 21.3, 10.7 and 8 yr. In plot 5b, the geomagnetics aa spectrum displayed a remarkable peak at 10.7 yr with higher amplitude, this peak was found in Rz spectrum. There are a similar fluctuations of 21.3, 10.7-11.6, 9.1, 7.5 between aa and GST. Also, other similar peaks 21.3, 10.7, 8-9.1 are appeared between Rz & GST. The spec- trum of GST showed peak of 21.3 yr that related to the solar magnetic cycle polarity (Hale cycle). The 21.3 was observed in aa spectrum with large significant magnitude rather than Rz spectrum, in this concern one can say that aa is more effective on global surface temperature than solar activity. Finally the global surface temperature are strongly sensitive to the 21.3-yr, 10.7-11.6 yr variations that observed in the considered geomagnetic and sunspot spectra. 4. Conclusions The aim of this paper is to find out the relation in the long time (1880-2008) between changer of global surface temperature (GST), and solar-geomagnetic activist repre- sented by sunspot number (Rz) and geomagnetic indices (aa), and to what degree they are connected. 1) Regression analysis revealed that the correlation co- efficient between geomagnetic activity (aa) and fluctua- tion of (GST) is = 0.64, while the correlation between Rz and (GST) is = 0.33 at zero lag. 2) The running correlation analysis displayed that the higher correlations between aa and GST is r = 0.66, and between Rz and GST is r = 0.34 at time lag of 2-3 yrs. The correlation of aa-GST is near two times higher than that of Rz-GST. 3) Results of spectral analysis revealed strong 21.3 yr peak in GST than the 11.6 yr peak. It is related to the changes in the polarity of main solar magnetic field. The interplanetary magnetic field (IMF) effect is more pow- ered on GST than the solar activity cycle. Significant peak at 10.7 yr are appear in both aa and Rz series which is the most established cycle of solar activity. 4) We also found that 21.3 year peak in aa series is larger than the same peak in Rz series this indicate the geomagnetic activity predominate over the solar activity in GST. REFERENCES [1] T. Landscheidt, “Solar Wind near Earth: Indicator of Variation in Global Temperature,” European Space Agency Special Publication 463, 2000, pp. 497-500. [2] S. Rahmstorf, D. Archer, D. S. Ebel, O. Eugster, J. Jouzel, D. Maraun, U. Neu, G. A. Schmidt, J. Severinghaus, A. J. Weaver and J. Zachos, “Comic Rays, Carbon Dioxide, and Climate,” EOS, Vol. 85, No. 4, 2004. [3] K. Lassen and E. Friis-Christensen, “Reply to Article ‘Solar Cycle Length and Climate’ A Reference Revit by Laut,” Journal of Geophysical Research, Vol. 105, No. A12, 2000, pp. 27493-27495. Copyright © 2010 SciRes. JEP 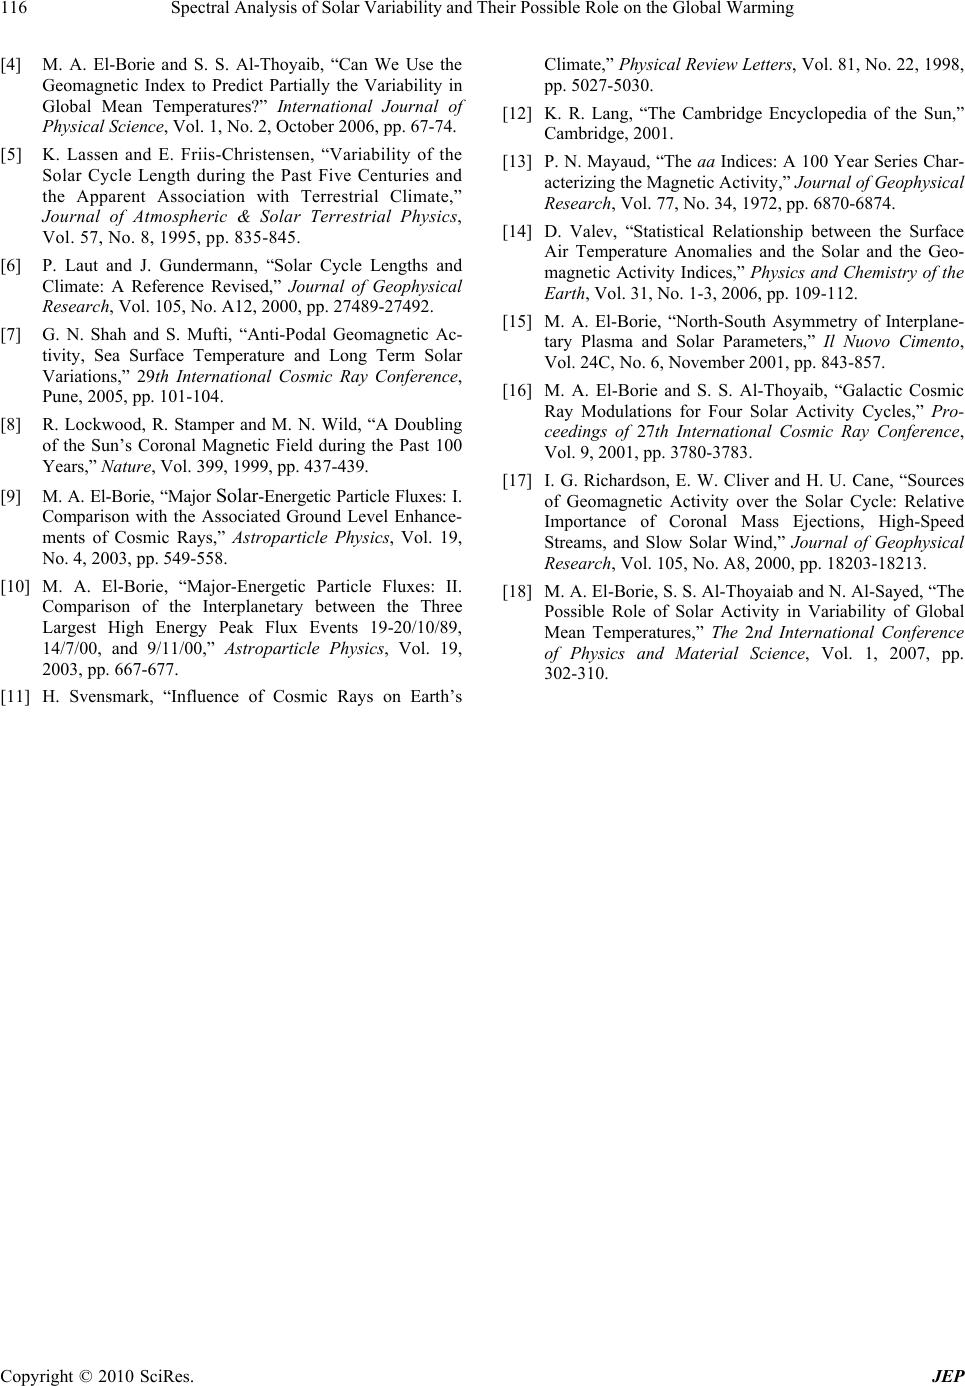 Spectral Analysis of Solar Variability and Their Possible Role on the Global Warming 116 [4] M. A. El-Borie and S. S. Al-Thoyaib, “Can We Use the Geomagnetic Index to Predict Partially the Variability in Global Mean Temperatures?” International Journal of Physical Science, Vol. 1, No. 2, October 2006, pp. 67-74. [5] K. Lassen and E. Friis-Christensen, “Variability of the Solar Cycle Length during the Past Five Centuries and the Apparent Association with Terrestrial Climate,” Journal of Atmospheric & Solar Terrestrial Physics, Vol. 57, No. 8, 1995, pp. 835-845. [6] P. Laut and J. Gundermann, “Solar Cycle Lengths and Climate: A Reference Revised,” Journal of Geophysical Research, Vol. 105, No. A12, 2000, pp. 27489-27492. [7] G. N. Shah and S. Mufti, “Anti-Podal Geomagnetic Ac- tivity, Sea Surface Temperature and Long Term Solar Variations,” 29th International Cosmic Ray Conference, Pune, 2005, pp. 101-104. [8] R. Lockwood, R. Stamper and M. N. Wild, “A Doubling of the Sun’s Coronal Magnetic Field during the Past 100 Years,” Nature, Vol. 399, 1999, pp. 437-439. [9] M. A. El-Borie, “Major Solar-Energetic Particle Fluxes: I. Comparison with the Associated Ground Level Enhance- ments of Cosmic Rays,” Astroparticle Physics, Vol. 19, No. 4, 2003, pp. 549-558. [10] M. A. El-Borie, “Major-Energetic Particle Fluxes: II. Comparison of the Interplanetary between the Three Largest High Energy Peak Flux Events 19-20/10/89, 14/7/00, and 9/11/00,” Astroparticle Physics, Vol. 19, 2003, pp. 667-677. [11] H. Svensmark, “Influence of Cosmic Rays on Earth’s Climate,” Physical Review Letters, Vol. 81, No. 22, 1998, pp. 5027-5030. [12] K. R. Lang, “The Cambridge Encyclopedia of the Sun,” Cambridge, 2001. [13] P. N. Mayaud, “The aa Indices: A 100 Year Series Char- acterizing the Magnetic Activity,” Journal of Geophysical Research, Vol. 77, No. 34, 1972, pp. 6870-6874. [14] D. Valev, “Statistical Relationship between the Surface Air Temperature Anomalies and the Solar and the Geo- magnetic Activity Indices,” Physics and Chemistry of the Earth, Vol. 31, No. 1-3, 2006, pp. 109-112. [15] M. A. El-Borie, “North-South Asymmetry of Interplane- tary Plasma and Solar Parameters,” Il Nuovo Cimento, Vol. 24C, No. 6, November 2001, pp. 843-857. [16] M. A. El-Borie and S. S. Al-Thoyaib, “Galactic Cosmic Ray Modulations for Four Solar Activity Cycles,” Pro- ceedings of 27th International Cosmic Ray Conference, Vol. 9, 2001, pp. 3780-3783. [17] I. G. Richardson, E. W. Cliver and H. U. Cane, “Sources of Geomagnetic Activity over the Solar Cycle: Relative Importance of Coronal Mass Ejections, High-Speed Streams, and Slow Solar Wind,” Journal of Geophysical Research, Vol. 105, No. A8, 2000, pp. 18203-18213. [18] M. A. El-Borie, S. S. Al-Thoyaiab and N. Al-Sayed, “The Possible Role of Solar Activity in Variability of Global Mean Temperatures,” The 2nd International Conference of Physics and Material Science, Vol. 1, 2007, pp. 302-310. Copyright © 2010 SciRes. JEP |