

Paper Menu >>
Journal Menu >>
 J. Service Science & Management, 2010, 3, 186-197 doi:10.4236/jssm.2010.32023 Published Online June 2010 (http://www.SciRP.org/journal/jssm) Copyright © 2010 SciRes. JSSM Modeling Customer Reactions to Congestion in Competitive Service Facilities Mohammad Saidi-Mehrabad, Ebrahim Teimory, Ali Pahlavani* Department of Industrial Engineering, Iran University of Science and Technology, Tehran, Iran. Email: [email protected] Received February 16th, 2010; revised March 21st, 2010; accepted April 25th, 2010. ABSTRACT This paper reviews classic approaches for modeling customers’ choice behavior in competitive facility planning prob- lems. They are either deterministic or probabilistic and work by a utility function based on some factors whether cus- tomer-independent or dependent. This paper focuses especially on congestion, the most important factor in customer to service or fixed-server systems. Various behaviors which customers may divulge when they face with a congested facil- ity are extensively studied. We also define a new congestion-sensitivity reaction which has not been considered in the literature. Relevant modeling approaches are proposed to formulate customers-sensitivity to congestion. An illustrative example is also given to analyze and compare the proposed approaches. Keywords: Competitive Planning Models, Customers’ Choice Behavior, Congestion, Waiting Time 1. Introduction A large part of planning problems which ask for firms’ location and pricing decisions occurs in a situation in which there exist other facilities providing the same or homogonous service or product. In the relevant models, planner aims to devise the better alternatives for a firm competing for customers’ purchasing power with other firms. For example, the problem of locating shop centers, banks, ATMs, super-markets and restaurants could be modeled using this paradigm [1]. This problem known as competitive facility location model maximizes market share, revenue or profit. Prior to coming to a decision using the model, it is re- quired to determine how customers behave or how they decide to choose a facility and furthermore what is their expected expenditure. There are two main categories on retail facilities choi- ce models: descriptive-determinist approach and explica- tive-stochastic approach. Descriptive approaches are based on observation. They rely on unreal assumptions such as customers choose the closest facility. Most classic location problems such as p-median [2] and MCLP [3] are often formulated based on this assumption. Hotelling [4] was the first on study- ing a competitive location planning model using a de- scriptive approach. MAXCAP [5] is a well known com- petitive location problem based on this approach. Cus- tomers’ purchasing power is distributed among different facilities according to a deterministic or zero-one ap- proach which is called also full capture [6]. In this case, the whole demand of a customer is captured by a facility which is the best for him/her according to a utility func- tion. Conventionally, the utility function is defined based on only distance or travelling time. This is true when differences between facilities are negligible, or in areas where shopping opportunities are few and transportation is difficult [7]. In many cases however, facilities are mul- tiform, i.e., they do differ in other aspects than the mere site where they are located, and customers will take these differences into account in the way they feel attracted to them [8]. In the explicative approach for formulating customers’ behavior, historical information is implemented to com- prehend dynamics of retail selling competition and how customers choose purchasing opportunities. Spatial in- teraction model as the most important branch of the ex- plicative approach is first developed by Huff [9]. Spatial interaction is the process whereby entities at different points in physical space make contacts, demand/supply decisions or locational choices [10]. Spatial interaction models postulate that customers compare alternatives based on their evaluation of the total utility of the facility and not merely on its location. Huff argued that when customers have several alterna- tives, they may consider visiting different facilities rather than restricting their patronage to only one facility. Based  Modeling Customer Reactions to Congestion in Competitive Service Facilities187 on this claim, Huff coined his idea that assumes the cus- tomers’ behavior to be probabilistic rather than determi- nistic. He defined a utility function as 2 . jij A d where A is the facility’s attraction measure and d is the distance to the facility and β 2 is the sensitivity of customers to dis- tance. In his model, the probability of patronizing facility j by customer i (xij) is determined as 2 2 .,, . ijj ij ij ik kik kE kE uAd x iNjE uAd (1) where the denominator of Equation (1) sums up the utili- ties of customer i from all facilities (E). As a result, if there are Di customers resided at demand point i, the expected number of customers visiting facil- ity j will be ., , iji ij EDxiNjE (2) Later, the inclusion of other characteristics in Huff's model originated other models. According to [11], char- acteristics of a retail facility could be categorized into two groups. The characteristics included in the first group are independent of customer’s origin (e.g. product quality, price, facility’s convenience level and its size). The other group includes characteristics that are depend- ent on the customer’s origin such as distance or travelling time. By a Multinomial Logit model [12], the above prob- ability is given as the following. exp() ,, exp( ) ij ij ik kE V x iNjE V y a central planner. (3) where Vij is the utility perceived by customer i from fa- cility j. Conventionally, this utility is expressed as a lin- ear additive function of facilities’ characteristics. As pointed before, in addition to distance there are other criteria affecting customer’s choice behavior. Au- thors in [13] developed a competitive location and design model in which customers decide based on distance and some other design variables. These may be quality, con- gestion level or offered price. Among them, congestion is very important especially in a competitive service market. In the service sector, customers’ impatience to being served has been considered as a main issue of competi- tive advantage. Convenience in terms of service speed is usually accounted for premier on price. In this atmos- phere, a competitor will succeed if it responses fairly to this requirement. Customers divulge their impatience by reacting to the level of congestion at facilities. For service-to-customer systems, the congestion is reflected to customers by wai- ting time or response time and for customer-to-service systems it is measured by waiting time or system occu- pancy level. For a competing firm that plans to maximize its market share, the congestion should be taken into account as a main customer’s choice criterion. A considerable part of the literature is devoted to an approach by which cus- tomers consider the congestion of facilities at their ori- gins. In this approach, it is assumed that customers know facilities’ congestion level at the beginning and decide a facility or a set of facilities based on a measure such as mean waiting time or mean occupancy level and/or total admissions. It has been extensively studied by various researchers. For instance, Lee and Cohen [14] studied the existence and uniqueness of equilibrium demand for service facili- ties serving congestion-sensitive customers. Congestion is considered by customers in their initial decisions. In [15] MAXCAP model is improved to include waiting time as a customers’ choice criterion along with travel- ling time. However it utilizes a deterministic choice ap- proach and assumes all facilities to be single server. A multi-server facility location problem was developed [16] in which customers’ demand is distributed according to a Multinomial Logit model based on travelling and waiting time. There have been also some simultaneous optimization models. A simultaneous location and capac- ity optimization model is presented for a competitor in a market with customers considering the mean waiting time in their initial choices [17]. Aboolian et al. [18] presented a competitive web server location and design problem in which customers make choice based on the difference in expected response times between new and old facilities. Demand elasticity to congestion has been also studied in facilities planning issues [14,19]. In a dif- ferent approach [20], the author formulated a model for locating multiple-server, congestible facilities. He de- fined demand to be elastic to travelling time and also system occupancy level. However the customers' alloca- tion is deterministic b This paper criticizes the common approach for model- ing congestion-sensitivity of customers involved in a competitive service market. We study the obvious reac- tions of customers that face by congested facilities. We also develop five different approaches for formulating such reactions in competitive planning models. Except one approach that presents a learning process on conges- tion level, the other approaches follow a two steps frame- work. In the first step customers decide probabilistically based on a utility function depending on distance and offered price. In the second step they take congestion into account and determine whether to patronize a facil- ity or not. The manner how they react to the congestion defines the behavior. The rest of the paper is organized as follows. Section 2 describes our proposed frameworks for modeling cus- tomers’ reactions to congestion. Section 3 gives some Copyright © 2010 SciRes. JSSM  Modeling Customer Reactions to Congestion in Competitive Service Facilities 188 experimental results on the models and finally Section 4 concludes the paper and proposes future research issues. 2. Our Modeling Frameworks Suppose that the market is a network that includes some nodes (N = {1, 2, ..., n}) as demand origins and also as potential facility sites. Let E ⊂ N (|E| = q) be the set of our firm's facilities and E' ⊂ N (|E'| = q') be the set of other competitors’ facilities. There are also some edges (G) each of them indicates the availability of a direct path between two nodes. The network is in a metric space equipped with distance d being the shortest path distance. Without loss of generality, it is assumed that custom- ers arrive from multiple infinite sources according to a Poisson process with mean demand generating rate , iiN . They are served with FIFO discipline in fa- cilities which utilize m servers all with exponentially distributed service time with mean 1/μ. Buffer volume of each facility is also limited to K. We have the following performance indicators: (Utilization factor) / (4) (Mean queue length) (5) ()P K n nm Lnm r (Mean waiting time) /wL (6) where λ is the arrival rate of a facility and defined as the sum of demand generating rates of demand nodes pa- tronizing the facility, is the effective arrival rate and Prn is the probability that there are n customers at a facil- ity. This probability is a function of the arrival rate, λ and is defined according to the structure of queuing system. With the conventional approach for formulating cong- estion-sensitivity as explained in Section 1, customers consider all criteria simultaneously and they have to make a definite decision on destination facilities when they are at their origins. The planner assumes that they cannot deviate from their initial decisions. Obviously this is not a real adaptation from human decision making. Since customers usually follow a changing mood and moreover don’t know all criteria simultaneously, they follow a sequential decision making process. Whether they employ a simultaneous or sequential de- cision making, the probability distribution of their de- mand should be determined. We define this probability according to Multinomial Logit model [12] as ,, ij ik c ij c kE E e x iNjEE e (7) where υ is a parameter defined as / 6, and σ is the standard deviation in taste of the customers [16]. The dispersion in facility choice increases with smaller values for υ resulted from higher values of σ. The main indicator of the probability is the cost in- curred by customers to being served, cij. The determining factors of this cost may differ for different customers. The manner through which the congestion is included in customers’ choices is the main issue considered by this paper. We describe different reactions of customers to congested competitive facilities and present appropriate approaches to determine the effective arrival rates of facilities and the firms’ market share. 2.1 Customers are Insensitive to Congestion For the case which the arriving customers are not con- gestion-sensitive, cij in Equation (7) is defined as the sum of offered price and cost of travelling time to the facility. ., , ij ijij cpft iNjEE (8) where tij is the travelling time between nodes i and j, pa- rameter f is the cost of unit time and pij is the service price offered by the facility located at j to customer i. We have the following term for the effective arrival rate of facility j. 1 ., n jj iij i x jEE (9) 2.2 Customers Revise their Decisions According to their New Observations on Waiting Times In this case the congestion level is stated by mean wait- ing time. It is assumed that customers initially don’t know anything about waiting time levels in a new estab- lished facility and they cannot foreknow congestion level. Therefore, at their first trip they choose facilities based on factors other than congestion. Their experienced wait- ing times are included in their second trip. This process will be continued until an equilibrium demand distribu- tion is found. Therefore cij is defined as the sum of offered price, cost of travelling time to the facility and cost of waiting time at the facility. .( ),, ij ijij j cpftw iNjEE (10) where wj is the mean waiting time of facility j according to Equation (6). The effective arrival rate in this case will be as the following (1Pr ), jj K jEE (11) where K is the maximum capacity of the system and probability PrK denotes the probability that there are K customers at the facility. The state probabilities of the considered queuing system are computed according to [21] as Copyright © 2010 SciRes. JSSM 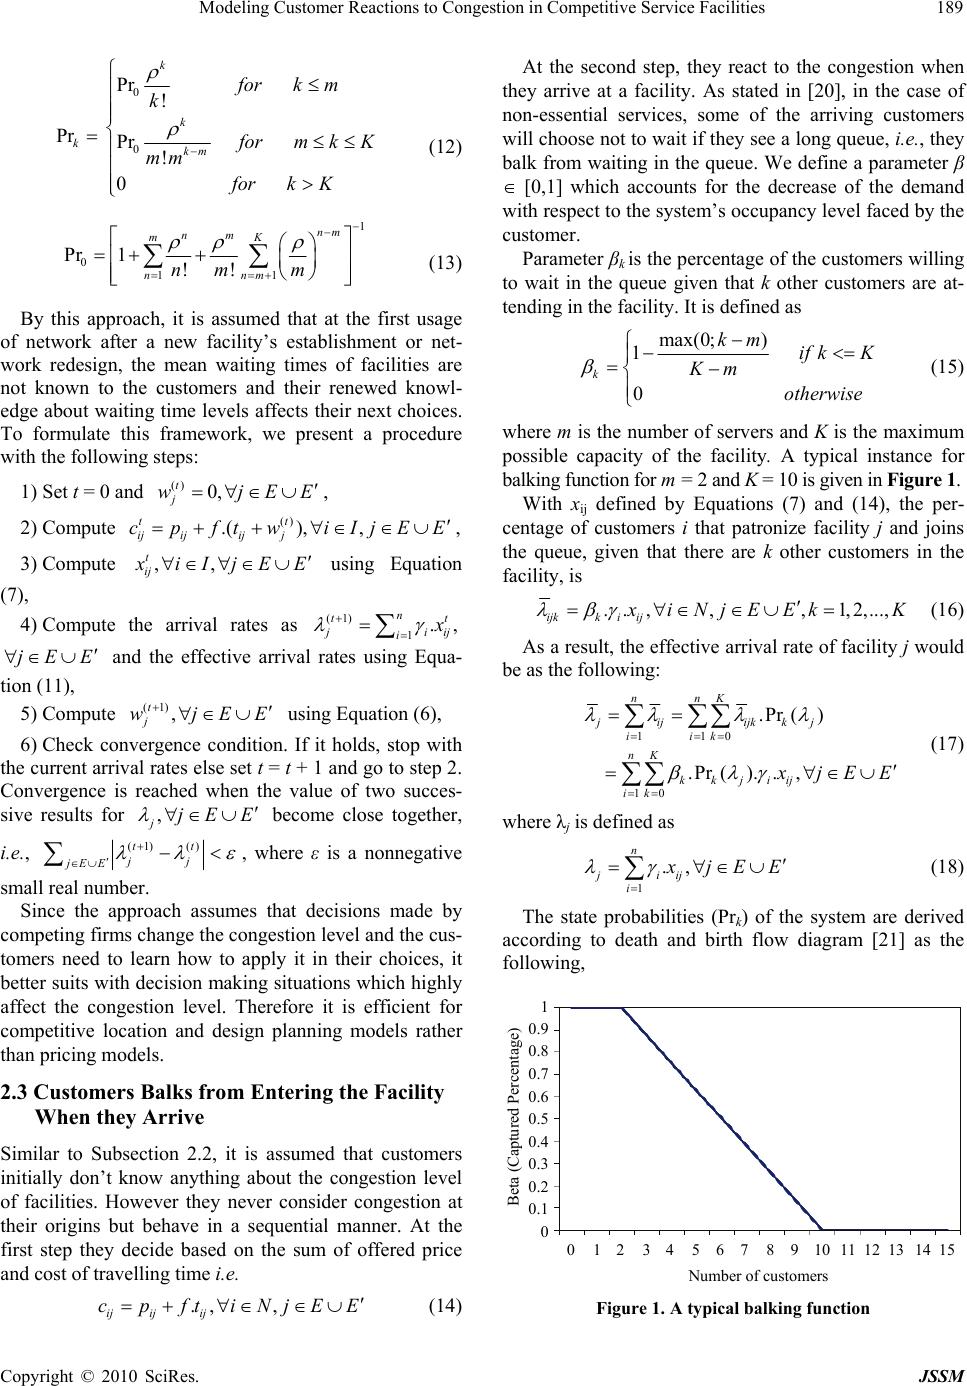 Modeling Customer Reactions to Congestion in Competitive Service Facilities189 Prk 0 0 Pr ! Pr ! 0 k k km fork m k f orm kK mm fork K (12) 1 0 11 Pr 1!! nm nm mK nnm nm m (13) By this approach, it is assumed that at the first usage of network after a new facility’s establishment or net- work redesign, the mean waiting times of facilities are not known to the customers and their renewed knowl- edge about waiting time levels affects their next choices. To formulate this framework, we present a procedure with the following steps: 1) Set t = 0 and E , () 0, t j wjE 2) Compute () .(), , tt ij ijij j cpftwiIjEE , 3) Compute ,, t ij x iIjEE using Equation (7), 4) Compute the arrival rates as (1) 1., n tt j iij i x jEE and the effective arrival rates using Equa- tion (11), 5) Compute E using Equation (6), (1) , t j wjE 6) Check convergence condition. If it holds, stop with the current arrival rates else set t = t + 1 and go to step 2. Convergence is reached when the value of two succes- sive results for , jjEE become close together, i.e., (1)()tt jj jE E , where ε is a nonnegative small real number. Since the approach assumes that decisions made by competing firms change the congestion level and the cus- tomers need to learn how to apply it in their choices, it better suits with decision making situations which highly affect the congestion level. Therefore it is efficient for competitive location and design planning models rather than pricing models. 2.3 Customers Balks from Entering the Facility When they Arrive Similar to Subsection 2.2, it is assumed that customers initially don’t know anything about the congestion level of facilities. However they never consider congestion at their origins but behave in a sequential manner. At the first step they decide based on the sum of offered price and cost of travelling time i.e. ., , ij ijij cp ft iNjEE (14) At the second step, they react to the congestion when they arrive at a facility. As stated in [20], in the case of non-essential services, some of the arriving customers will choose not to wait if they see a long queue, i.e., they balk from waiting in the queue. We define a parameter β [0,1] which accounts for the decrease of the demand with respect to the system’s occupancy level faced by the customer. Parameter βk is the percentage of the customers willing to wait in the queue given that k other customers are at- tending in the facility. It is defined as max(0; ) 1 0 k km if kK Km otherwise (15) where m is the number of servers and K is the maximum possible capacity of the facility. A typical instance for balking function for m = 2 and K = 10 is given in Figure 1. With xij defined by Equations (7) and (14), the per- centage of customers i that patronize facility j and joins the queue, given that there are k other customers in the facility, is ..,,,1, 2,..., ijkki ij x iNjEEk K (16) As a result, the effective arrival rate of facility j would be as the following: 110 10 .Pr () .Pr().., nnK jijijkk j iik nK kkjiij ik x jEE (17) where λj is defined as 1 ., n jiij i x jEE (18) The state probabilities (Prk) of the system are derived according to death and birth flow diagram [21] as the following, Number of customers Beta (Captured Percentage) 0 1 2 3 4 5 6 7 8 9 10 11 12 13 14 15 1 0.9 0.8 0.7 0.6 0.5 0.4 0.3 0.2 0.1 0 Figure 1. A typical balking function Copyright © 2010 SciRes. JSSM  Modeling Customer Reactions to Congestion in Competitive Service Facilities 190 0 12 0 0 Pr , ! ... Pr Pr, ! 0 n n nn m nnm nm n mnK mm nK (19) 1 12 0 01 ... 1 Pr !! n mK nnn m nm nnm nm m (20) 2.4 Joined Customers Renege from Waiting In the previous case, it is assumed that all the customers that join the queue stay until served by a server. However, it is also possible for an impatient customer to depart the queue, i.e., he/she may renege from waiting. In this case, after joining the queue each customer will wait a certain length of time to being served. If the service has not be- gun by then, he/she departs. This time is a random vari- able whose density function is () t rt e . Consequ- ently, the effective arrival rate will be as the following: 10 ..Pr().. nK j kkkj iij ik Rx (21) where λj, βk, γi and xij are the same as Subsection 2.3 and Rk is the probability that a new arrived customer will survive to be serviced given that there are k customers in the facility on arrival and given that it joins. In [22] it is proved that 1 k Rkm (22) where .m . The state probabilities are derived according to death and birth flow as the following, 0 12 0 0 Pr , ! ... Pr Pr, !(1) 0 n m nm nn m n nm nm n mn K m nK (23) 1 12 0 01 ... Pr !! (1) nm mK nm nn m nnm nm nm (24) where / . 2.5 Balked or Reneged Customers may Veer from their Initial Destinations In the case of essential services or a fierce competitive market, the balked or reneged customers may go directly to another facility rather than coming back to their origins, i.e., they veer and deviate from their initial decisions. In this case the second facility would indirectly capture their de- mand. We assume that customers do such upturns only for one cycle due to travelling time and cost issues. Figure 2 illustrates the two situations in a simple net- work where there is a single demand node with four cust- omers and three facilities are serving them. Initially three customers choose to patronize facility F1 and one of th- em chooses facility F2 (Figure 2(a)). Because of unbea- rable congestion at facility F1, the customers balk or re- nege from waiting and return to their origins (Figure 2(b)). But this is not the case for all situations. They may go di- rectly to another facility close to facility F1 with the aim of being served in a less congested facility (Figure 2(c)). We need to determine the percentage of customers which may divulge such behavior. Assume that PrB l is the balking prob- ability for the customers interested initially in facility l and 0(1).Pr(), K kkl klEE 0 Pr.(1).Pr ( K R lkk kR ), kl lEE is the reneging probability for them. To reflect the veering be- havior in the model, we also define a variable zlj which stands for the probability that a customer balked or re- neged from facility l, will choose facility j. This proba- Figure 2. An example for comparison of two congestion- sensitivity manners: (a) Customers dispatching from the demand node; (b) customers balk or renege and return to their origins; (c) Some of balked or reneged customers go to another facility (veer) Copyright © 2010 SciRes. JSSM  Modeling Customer Reactions to Congestion in Competitive Service Facilities191 bility depends on the difference of prices offered by two facilities and travelling time between them as follows: (1/).,, , lj lk c ljl mc kE E e zQd lEEkj e l j (25) .,, , ljijillj cppftjlEEl (26) where dm is the maximum distance between two nodes in the network and Ql is the centrality index for facility l. It is defined as , '1 lj jl l d Ql qq EE (27) We implement the centrality index to determine how far the facility is from other facilities, i.e., the density of network’s areas. The density measure is utilized to define what part of balked or reneged customers from a facility will go to other facilities. For a facility established in a dense area, the probability that a balked or reneged cus- tomer will go directly to another facility will be higher than that for sparse areas. Figure 3 illustrates the effect of centrality index for the example depicted by Figure 2. 2.5.1 Only Balked Customers Choose to Go to Another Facility In this case, the arrival rate could be partitioned into two parts, one part for directly captured demand and another one for indirectly captured demand of balked customers. Therefore, Equation (18) becomes 1 ..Pr., lj nB jiijilllj ilEEiN x zjEE (28) Figure 3. An example illustrating the effect of centrality index: (a) Facility F3 is closer to F1 and larger part of balked or reneged customers decide to go to F3; (b) Facility F3 is farther to F1 and smaller part of them decide to go to F3 The effective arrival rate in this case is the same as Equation (17) where probabilities Prk are computed using Equations (19)-(20). 2.5.2 Both Balked and Reneged Customers Choose to Go to Another Facility In this case, the arrival rate could be partitioned into three parts, the first part for directly captured demand, the second part for indirectly captured demand of balked customers and the third part for indirectly captured de- mand of reneged customers. Therefore, Equation (18) becomes 1 ..Pr. .Pr., lj lj nB jiijilllj ilEEiN R illlj lE EiN xz zjEE (29) The effective arrival rate in this case is the same as Equation (21) where probabilities Prk are computed from Equations (23)-(24). Obviously, the right-hand side of Equations (28) and (29) is a function of λjs (jEE ). Therefore, it can be written as a system of equations, (), jjEE (30) where is the vector of facilities’ arrival rates. Since (.) is a non-linear function and there are (q + q') facili- ties, Equation (30) indicates a non-linear system of (q + q') equations and (q + q') variables. For solving this system of equations we employ a pro- cedure similar to fixed point iteration approach [23]. This procedure has the following steps: 1) Compute ,, ij x iNjEE using Equations (7) and (14); 2) Set t = 0 and () 0 t . Compute () Pr (), t kj k 0,1, 2,..., K using Equations (19)-(20) or Equations (23)-(24); 3) Compute using Equation (28) or (29); )( )(t j 4) Compute a new value )().1(. )()()1(ttt , 10 (31) where Γ is the vector of right hand side functions of Equation (28) or (29),(.) and θ is a problem-depen- dant factor. 5) Check the convergence condition. If it holds, stop with the current solution else set t = t + 1 and go to step 3. Convergence is reached when the value of two su- ccessive results for become close together i.e. )()1( tt , where ε is a nonnegative small real number. Copyright © 2010 SciRes. JSSM  Modeling Customer Reactions to Congestion in Competitive Service Facilities Copyright © 2010 SciRes. JSSM 192 Having defined the possible reactions of impatient customers in congestible facilities, we can analyze them in a competitive planning model. The utilized measure for this purpose is the market share of firms or their fa- cilities. However, other measures could also be derived. The market share of our firm is defined as 1 / n j i jE i MS (32) In the next section we test the approaches through an illustrative example. 3. An Illustrative Example Suppose that an area is formed as a network that includes 50 demand nodes. Three firms are competing with each other for customers’ purchasing power. They have just established some facilities. The deployment outline of the demand nodes and also the firms’ facilities is exhib- ited by Figure 4. Note that all nodes in the network indicate a demand node. An oval node indicates that a facility of firm 1 has been located in that node. A square node indicates that a facility belonging to firm 2 has been established in the node and a diamond node shows a facility of firm 3. The circles show the demand nodes with no established facility. The length of available direct paths in the network is known and the shortest distance between each pair of nodes could be determined. Table 1 gives the demand generating rates for demand nodes. Table 2 gives the queuing parameters for the competing firms. The price charged for customers is as- sumed to be p = 12, the same for all three firms. The val- ues for other parameters are given in Table 3. Now we apply different congestion-sensitivity reac- tions and their relevant modeling approaches on the de- fined problem. The obtained results are given in Table 4. The table gives the market share of competing firms and their facilities from demand nodes. The last column gives the percentage of total captured demand of the market. Table 4 illustrates also the results for the case which disregards congestion effects (Subsection 2.1). It is given only for comparison purposes. Figure 4. An outline of the market area in the example Table 1. The nodes’ demand generating rates Node Rate Node Rate Node Rate Node Rate Node Rate 1 1.2 11 3.9 21 1.9 31 1.1 41 3.8 2 1.7 12 1.8 22 2.7 32 4 42 3.7 3 4.1 13 4 23 1.2 33 2.3 43 0.1 4 1.5 14 0.8 24 1.1 34 2.1 44 4 5 3.3 15 0.7 25 1 35 2.4 45 1 6 2 16 1.5 26 2.2 36 1.5 46 2.6 7 1.5 17 1.7 27 0.9 37 2.9 47 2.2 8 0.8 18 1.3 28 1.7 38 1.7 48 1.3 9 3.1 19 0.7 29 0.1 39 0.4 49 3.3 10 2.8 20 1 30 2.3 40 1.2 50 0.2 Table 2. The queuing specifications of the firms Firm Number of FacilitiesFacility Nodes (No. of Servers) System Capacity (K) Service Rate (μ) Firm 1 2 37 (2), 39 (3) 10 5 Firm 2 7 2 (2), 11 (1), 14 (2), 21 (2), 34 (1), 38 (1), 45 (3)8 4 Firm 3 2 4 (2), 29 (2) 15 5  Modeling Customer Reactions to Congestion in Competitive Service Facilities193 Table 3. Other parameters of the network Measure Value Customers’ behavior uniformity (υ) 0.1 Cost of travelling and waiting time (f) 1 Reneging rate (α) 5 As it can be seen from Table 4, in the cases which customers are congestion-insensitive or decide at origin based on their knowledge on waiting time levels, the whole available demand of the market is captured. This is because that; in these two cases the customers don’t escape from congestion but accept it as a usual phe- nomenon. The case of “Balking and reneging” results in the least market capture because the congestion-sensitive or impa- tient customers leave highly congested facilities and re- turn to their origins. When a part of those leaving cus- tomers doesn’t return and decides to being served by other facilities, the overall capture increases. This is re- flected by “Balking, reneging and veering” case. A simi- lar analysis could be stated for “Balking” and “Balking and veering” cases. It is interesting to note that facility F2 of firm 1 cap- tures maximum share of the market except for conges- tion-insensitivity case. This is because of its better loca- tion and also its larger number of servers. In the contrast, facility F2 of firm 2 captures the minimum share of the market except for congestion-insensitivity case. This is because that it has only one server and its system capac- ity and service rate are smaller than other facilities. In the congestion-insensitivity case, since the congestion effect is disregarded, the only parameters affecting customers’ behavior are price and facilities’ location. Since price is assumed to be the same for all facilities, their locations play the main role in determining market share. There- fore it is expected that a facility located at a dense area would capture a larger share of the market. In the second set of experiments we analyze the effect of different parameters such as the default number of servers, mean service rate and system capacity on the firms’ market shares. The results are given by Figures 5-8. Figure 5 presents the analysis with respect to the firm 3’s mean service rate which changes by −80% to +80% (in steps of 40%) around its base value (µ0 = 5). Table 4. The market share of firms and facilities (percentage) Firm 1 Firm 2 Firm 3 Customer behavior F1 F2 Total F1 F2F3F4 F5F6F7TotalF1 F2 Total Overall Capture Congestion-insensitive 9.3 9.9 19.1 9.1 8.7 7.910.09.89.78.863.98.0 8.9 17.0100.0 Learning to revise 9.6 10.4 20.0 9.3 8.08.110.18.98.99.362.68.3 9.1 17.4100.0 Balking 8.4 9.4 17.9 8.0 6.47.08.7 7.17.18.352.47.6 8.4 16.086.3 Balking and veering 9.4 10.6 20.0 8.7 7.07.79.5 8.18.09.158.18.2 9.2 17.495.4 Balking and reneging 7.4 9.0 16.3 6.7 4.36.07.2 4.74.67.841.26.6 7.2 13.971.4 Balking, reneging and veering 9.3 11.1 20.4 8.2 5.8 7.59.0 6.96.99.453.77.8 8.8 16.690.8 (a) (b) Copyright © 2010 SciRes. JSSM 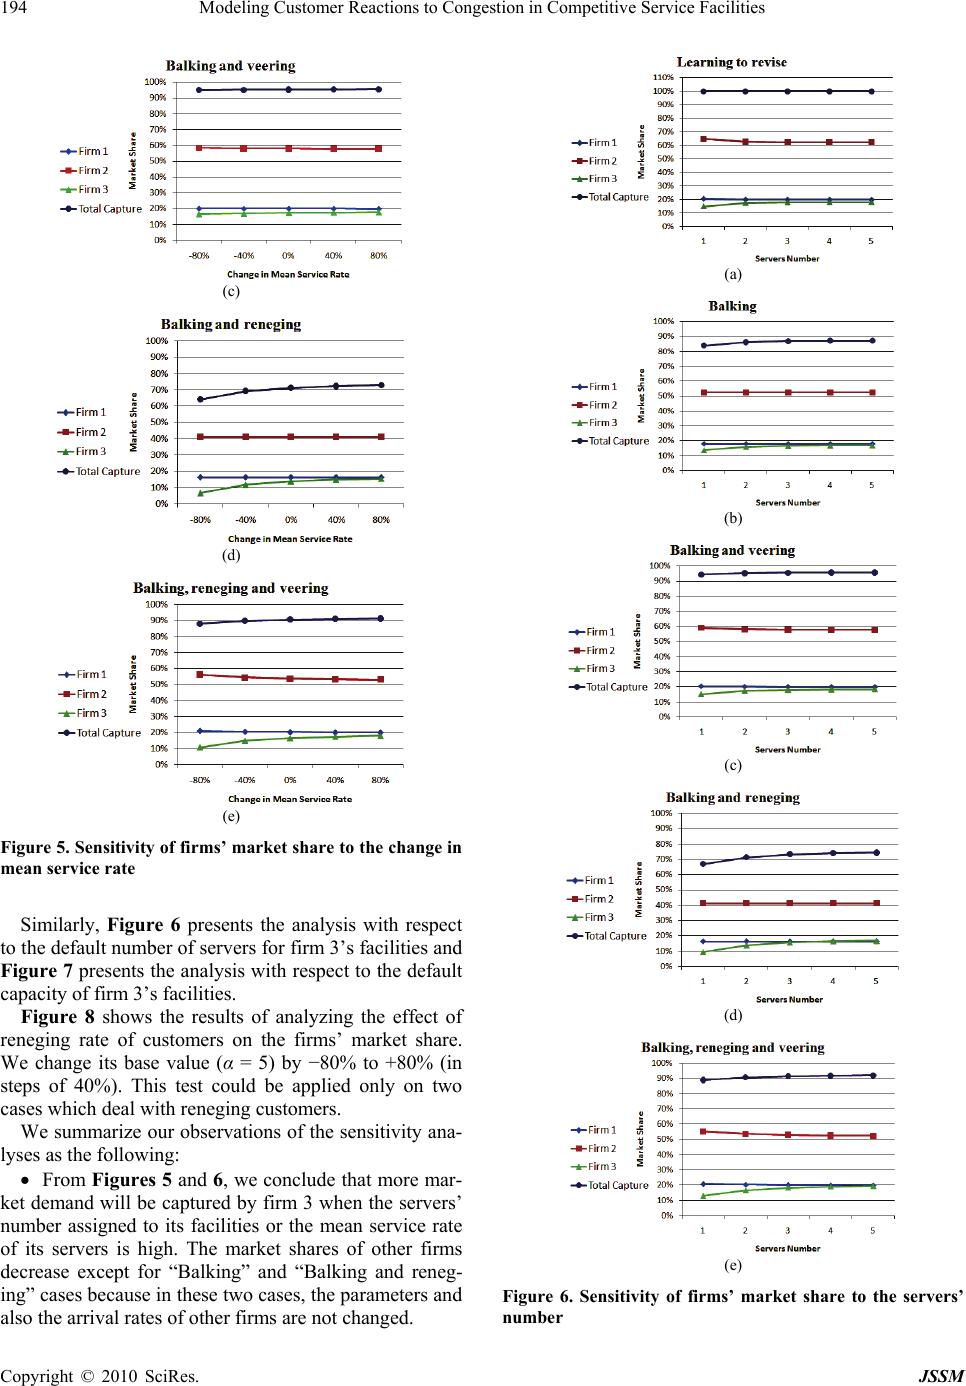 Modeling Customer Reactions to Congestion in Competitive Service Facilities 194 (c) (d) (e) Figure 5. Sensitivity of firms’ market share to the change in mean service rate Similarly, Figure 6 presents the analysis with respect to the default number of servers for firm 3’s facilities and Figure 7 presents the analysis with respect to the default capacity of firm 3’s facilities. Figure 8 shows the results of analyzing the effect of reneging rate of customers on the firms’ market share. We change its base value (α = 5) by −80% to +80% (in steps of 40%). This test could be applied only on two cases which deal with reneging customers. We summarize our observations of the sensitivity ana- lyses as the following: From Figures 5 and 6, we conclude that more mar- ket demand will be captured by firm 3 when the servers’ number assigned to its facilities or the mean service rate of its servers is high. The market shares of other firms decrease except for “Balking” and “Balking and reneg- ing” cases because in these two cases, the parameters and also the arrival rates of other firms are not changed. (a) (b) (c) (d) (e) Figure 6. Sensitivity of firms’ market share to the servers’ number Copyright © 2010 SciRes. JSSM  Modeling Customer Reactions to Congestion in Competitive Service Facilities195 The result achieved from analyzing the effect of sys- tem capacity (Figure 7) is similar to the mean service rate and servers’ number except for the case of “Learning to revise” in which a larger system capacity has a nega- tive effect on firm 3’s market share. This can be reasoned regarding the fact that a larger system capacity will cause longer waiting time. From Figure 8, we conclude that high reneging rates lower the market share of all firms. The decrement slope in the case of “Balking and reneging” is high be- cause all reneged customers return to their homes. Variation of other parameters such as price, demand rates and time to cost parameter has not considerable impacts on the final results. (a) (b) (c) (d) (e) Figure 7. Sensitivity of firms’ market share to the system capacity (a) (b) Figure 8. Sensitivity of firms’ market share to reneging rate Copyright © 2010 SciRes. JSSM  Modeling Customer Reactions to Congestion in Competitive Service Facilities 196 4. Conclusions and Future Research In this paper we have considered customers' patronizing behavior in a competitive market. It has been concluded that the better approach for formulating customers’ cho- ice behavior in spatial competitive modeling is a prob- abilistic model based on three variables, distance, waiting time and price. With emphasis on congestion effects, we have also studied customers’ reactions to congested fac- ilities. These are especially balking, reneging and veering. This is the first paper considering congestion-sensitivity reactions in competitive congested systems and the first work studying veering as a usual event in congested sys- tems. By veering we mean the case in which after a cus- tomer balked or reneged from a facility, he/she may de- cide to patronize another facility rather than coming back to his/her origin. Although the prevailing approach in the literature as- sumes that customers take congestion into account at their origins, it has been claimed that they initially don’t know a lot about facilities’ congestion level. Our pro- posed approaches retain customers unaware until they reach at the facilities. The first approach assumes that customers amend their future decisions according to the waiting time faced by them at the previous experiences. The four other approaches assume that customers react to the congestion when they reach at the facilities. They may balk, renege, veer or divulge a combination of them. An illustrative example has also given to demonstrate differences between the outcomes of proposed ap- proaches. We have seen that congestion-sensitivity of customers has a considerable effect on the firms’ market share. Therefore, a much attention must be paid for for- mulating the congestion-sensitivity of customers in spa- tial planning models. We have tried to study all possible reactions to the congestion. However, a special type of queues has been considered. It will be interesting to study other types of queuing systems. REFERENCES [1] T. Drezner and Z. Drezner, “Finding the Optimal Solution to the Huff Based Competitive Location Model,” Com- putational Management Science, Vol. 1, No. 2, 2004, pp. 193-208. [2] S. L. Hakimi, “Optimum Locations of Switching Centres and the Absolute Centres and Medians of a Graph,” Op- erations Research, Vol. 12, No. 3, 1964, pp. 450-459. [3] R. L. Church and C. ReVelle, “The Maximal Covering Location Problem,” Papers of Regional Science Associa- tion, Vol. 32, No. 1, 1974, pp. 101-118, [4] H. Hotelling, “Stability in Competition,” Economic Jour- nal, Vol. 39, No. 153, 1929, pp. 41-57. [5] C. ReVelle, “The Maximum Capture or Sphere of Influ- ence Location Problem: Hotelling Revisited on a Net- work,” Journal of Regional Science, Vol. 26, No. 2, 1986, pp. 343-358. [6] R. Aboolian, O. Berman and D. Krass, “Competitive Facility Location Model with Concave Demand,” Euro- pean Journal of Operational Research, Vol. 181, No. 1, 2007, pp. 598-619. [7] M. D. Garcia Perez, P. F. Hernandez and B. P. Pelegrin, “On Price Competition in Location-Price Models with Spatially Separated Markets,” TOP, Vol. 12, No. 2, 2004, pp. 351-374. [8] F. Plastria, “Static Competitive Facility Location: An Overview of Optimisation Approaches,” European Jour- nal of Operational Research, Vol. 129, No. 3, 2001, pp. 461-470. [9] D. Huff, “Defining and Estimating a Trading Area,” Journal of Marketing, Vol. 28, No. 3, 1964, pp. 34-38. [10] J. R. Roy and J. C. Thill, “Spatial Interaction Modeling,” Papers in Regional Science, Vol. 83, No. 4, 2004, 339- 361. [11] A. Jain and V. Mahajan, “Evaluating the Competitive Environment in Retailing Using the Multiplicative Com- petitive Interactive Model,” In: J. Sheth, Ed., Research in Marketing, JAI Press, Greenwich, Vol. 2, 1979, pp. 217- 235. [12] D. McFadden, “Conditional Logit Analysis of Qualitative Choice Behaviour,” In: P. Zarembka, Ed., Frontiers in Econometrics, Academic Press, New York, 1974. [13] R. Aboolian, O. Berman and D. Krass, “Competitive Fac- ility Location and Design Problem,” European Journal of Operational Research, Vol. 182, No. 1, 2007, pp. 40-62. [14] H. Lee and M. Cohen, “Equilibrium Analysis of Disagg- Regate Facility Choice System Subject to Congestion- Elastic Demand,” Operations Research, Vol. 33, No. 2, 1985, pp. 293-311, [15] F. Silva and D. Serra, “Incorporating Waiting Time in Competitive Location Models,” Networks and Spatial Economics, Vol. 7, No. 1, 2007, pp. 63-76. [16] V. Marianov, M. Rios and M. J. Icaza, “Facility Location for Market Capture When Users Rank Facilities by Shorter Travel and Waiting Times,” European Journal of Operational Research, Vol. 191, No. 1, 2008, pp. 32-44. [17] A. M. Kwasnica and E. Stavrulaki, “Competitive Loca- tion and Capacity Decisions for Firms Serving Time- Sensitive Customers,” Naval Research Logistics, Vol. 55, No. 7, 2008, pp. 704-721. [18] R. Aboolian, Y. Sun and G. J. Koehler, “A Location– Allocation Problem for a Web Services Provider in a Competitive Market,” European Journal of Operational Research, Vol. 194, No. 1, 2009, pp. 64-77. [19] M. L. Brandeau, S. S. Chiu, S. Kumar and T. A. Gro- ssman, “Location with Market Externalities,” In: Z. Dre- zner, Ed., Facility Location, Springer-Verlag, 1995, pp. 121-150. [20] V. Marianov, “Location of Multiple-Server Congestible Facilities for Maximizing Expected Demand, When Serv- Ices are Non-Essential,” Annals of Operations Research, Copyright © 2010 SciRes. JSSM  Modeling Customer Reactions to Congestion in Competitive Service Facilities Copyright © 2010 SciRes. JSSM 197 Vol. 123, No. 4, 2003, pp. 125-141. [21] D. Gross and C. M. Harris, “Fundamentals of Queuing Theory,” 3rd Edition, John Wiley and Sons, New York, 2002. [22] D. Q. Yue and Y. P. Sun, “Waiting Time of M/M/C/N Queuing System with Balking, Reneging, and Multiple Synchronous Vacations of Partial Servers,” Systems En- gineering-Theory & Practice, Vol. 28, No. 2, 2008, pp. 89-97. [23] C. T. Kelley, “Iterative Methods for Linear and Nonlinear Equations,” No. 16 in Frontiers in Applied Mathematics, SIAM, Philadelphia, 1995. |