

Paper Menu >>
Journal Menu >>
 Natural Resources, 2012, 3, 42-47 http://dx.doi.org/10.4236/nr.2012.32007 Published Online June 2012 (http://www.SciRP.org/journal/nr) Estimation of Natural Gas Production, Import and Consumption in Brazil Based on Three Mathematical Models Antonio Carlos Gracias1,2*, Sérgio Ricardo Lourenço1, Marat Rafikov1 1Engineering, Modeling and Applied Social Sciences Center (CECS), Federal University of ABC, Santo André, Brazil; 2Department of Mathematics, University Center of FEI, São Bernardo do Campo, Brazil. Email: *[email protected] Received January 6th, 2012; revised March 2nd, 2012; accepted March 10th, 2012 ABSTRACT A mathematical model capable of providing a forecast of future consumption and import of natural gas is essential for the planning of the Brazilian energy matrix. The aim of this study is to compare three mathematical models, logistic model or model of Verhulst, exponential model or the model of Malthus and the model of von Bertalanffy to analyze the possibilities of these models to describ e the evolution of production, import and consumption of natural gas in Bra- zil, from data provided by the energy balance of the Ministry of Mines and Energy (MME) from 1970 to 2009. A pro- jection of the production and the import of natural gas up to 2017 is made with the models studied in this article and compared with the Brazilian Ten-Year Plan for Expansion of Energy (PDE). At the end of this paper a comparison with the Hubbert model for Brazilian natural gas production is made. These data were adjusted to use the differential equa- tions which describe th e models of population growth. All the computer work used in this article: graphics, resolution of differential equations, calculations of linearization and the least squares fitting was prepared in the software MatLab. The results obtained by means of graphs show that the population dynamics models (logistic, exponential and von Ber- talanffy) can be applied in modeling the production, import and consumption of natural gas in Brazil. Keywords: Natural Gas; Mathematical Modeling; Logistic Model; Exponential Mod e l; Model of Von Bertalanffy 1. Introduction The federal government, through a policy of development, aims to extend the participation of natural gas in the en- ergy matrix from 2% to 12% in the next ten years [1]. A mathematical model capable of providing a forecast of future consumption and impo rt of natural gas is essential for the planning of the Brazilian energy matrix. The incr ease in supply of el ectric energy in Brazil will only occur with the generation of heat by natural gas. However, the Brazilian reserves of natural gas have two main characteristics: 80% is associated gas and 55% is located in deep water. In consequence, the supply of natu- ral gas is influenced and very dependent on oi l product ion. World consumption of natural gas will increase at a rate of 2.3% per year un til 2025 [2]. Th is increase in g lo- bal consumption will be felt also in Brazil, with the in- creasing participation of natural gas in the energy ma- trix, especially after the crisis in the electrical sector in 2001. The supply of natural gas has been dependent on Bolivia, since the end of the construction of the pipeline in 1999. This dependence has reached 50% in 2006 [3], which led to supply problems due to the political crisis faced by Bolivia in 2006. These problems caused a crisis in supply of gas in Brazil, which led Petróleo Brasileiro (PETROBRAS) to review the dependencies on Bolivian gas aiming to reduce the dependence to the maximum of 22% until 2016 [3]. Around the world, the use of natural gas is growing both in industry and in transport and the generation of electricity with the use of thermoelectric power plants for a number of reasons, including price, environmental concerns, fuel diversification, issues security, deregula- tion and economic growth worldwide marketing. Studies show the relationship between natural gas consumption and economic growth [4]. 2. Description of the Models The dynamics of populations [5] deals with changes in time and space the densities and sizes of populations. The study of population dynamics is not restricted only to the understanding of the variation in the number of *Corresponding a uthor. Copyright © 2012 SciRes. NR  Estimation of Natural Gas Production, Import and Consumption in Brazil Based on Three Mathematical Models 43 individuals of a given population, but also in the study of biological control of pests [6], the growth strategies of animals [7] strategies and growth of cities. The models dealing with population growth are the models logistic, exponential and von Bertalanffy. The application of these models in the study of production and import of natural gas is possible because the data presented in Tables 1 and 2 show characteristics of population growth. 2.1. Exponential Models The exponential m odel i s the simplest m odel that describes the population growth of some species. It is represented by a differential equation of first order establishing the rate of change of population in relation to time. The differen- tial equation for this model is: dN = rN dt (1) where dN/dt is the rate of the populational change and r is the rate of population growth r = (1 + ) and is the rate population growth average = (Nt/N0)1/2 – 1. Nt is the population after a period of t years in relation to ini- tial population N0. The solution of the Equa tion (1) is: rt 0 N(t)N e (2) where N0 is the initial population. Table 1. Production of natural gas. Year Production (106 m3) Year Production (106 m3) 1970 1264 1990 6279 1971 1178 1991 6597 1972 1241 1992 6976 1973 1180 1993 7355 1974 1488 1994 7756 1975 1625 1995 7955 1976 1642 1996 9156 1977 1808 1997 9825 1978 1933 1998 10788 1979 1899 1999 11898 1980 2205 2000 13283 1981 2475 2001 13998 1982 3030 2002 15568 1983 4013 2003 15792 1984 4902 2004 16971 1985 5467 2005 17699 1986 5686 2006 17706 1987 5781 2007 18152 1988 6076 2008 21593 1989 6105 2009 21142 Source: MME, 2010. 2.2. Logistic Model The logistic model assumes that a population will grow to a maximum limit, i.e., the p opulation tends to stabilize. This stability of the population in the logistic model is related to the ability to support the way that people live. The differential equation for this model is: dN N rN 1 dt K (3) where r is the rate of population growth and K is the level of the population saturation. The solution of the Equation (3) is obtained by the method of separab le variables [8]: 0rt 00 KN N(t) N KNe (4) where N0 is the initial population. The logistic model [9] was used to model annual and seasonal natural gas consumption for residential and com- mercial sectors in Iran. The logistics parameters were es- timated using optimization techniques as NLP (nonlinear programm i ng) and GA (genetic algorithm). 2.3. Von Bertalanffy Model The von Bertalanffy model is the logistic model modified to model fish weight growth [10]. The differential equa- tion for this model is: 1/3 23 dN N rN 1 dt K (5) where r is the rate of population growth and K is the level of the population saturation. The solution of the Equation (5) is obtained solving Bernoulli equation [8]: 1/3 3 rt 1/3 03K N N(t)K11()e K (6) where N0 is the initial population. 2.4. Hubbert Model The Hubbert model was developed by M. K. Hubbert in 1956 to project the discoveries and production in US-48 in the USA [11]. The equation for th e Hubbert model [12] for the annual production P is simple when related to the annual peak production Pm occurring at year tm: 2Pm P(t) 1cosh bttm (7) where b is 5/c, P is production in t, Pm is production at peak, tm is the peak period and c is the duration of the half life from a cut-off at 0.027 Pm. Copyright © 2012 SciRes. NR  Estimation of Natural Gas Production, Import and Consumption in Brazil Based on Three Mathematical Models 44 3. Methodology The study was conducted from data on production, import and consumption of natural gas from the energy balance of the Ministry of Mines and Energy [13] described in Ta- bles 1-3. Ta ble 1 presents data fro m the production, Table 2 presents data from the import and Table 3 presents data from the consumption of natural gas in B razil. To use the models applied to population dynamics in the production, import and consumption of natural gas the data were adjusted to use the differential equations which describe the models. Some parameters of the dif- ferential equations were linearized and others obtained by the least squares fitting. 4. Results and Discussions The results for production, import and consumption of natural gas will be presented separately. In each set of data, production, import and consumption of natural gas, we applied the best model to describe the data. In the final section a comparison with the model used in the Ten Year Energy Plan (PDE) 2008-2019 [14] was ma de. 4.1. Production of Natural Gas The results for the exponential model with the data of Table 1 are presented in Figure 1. For the exponential model to average growth rate of production is given by: 39 21142 15001 (8) where: N0 = 1500 × 106 m3 of gas. 4.2. Import of Natural Gas Brazil began to import natural gas in 1999, therefore, there were few points to apply the von Bertalanffy model, as Table 2. The same procedure done for the production of natural gas was applied to the import of natural gas. For the von Bertalanffy model shown in Figure 2, the value of K used was 11,330 × 106 m3 of gas. Table 2. Import of natural gas. Year Import (106 m3) 1999 400 2000 2.211 2001 4608 2002 5269 2003 5055 2004 8086 2005 8998 2006 9789 2007 10334 2008 11314 2009 8543 Source: MME, 2010. Table 3. Consumption of natural gas. Year Energy (106 m3)Industry (106 m3)Home (106 m3) Other (106 m3)Total (106 m3) 1970 74 3 0 3 80 1971 93 12 0 21 126 1972 100 22 0 51 173 1973 98 23 0 77 198 1974 137 163 0 81 381 1975 149 173 0 92 414 1976 146 183 0 148 477 1977 160 312 0 123 595 1978 156 294 0 333 783 1979 161 311 0 386 858 1980 188 363 0 452 1003 1981 197 381 0 322 900 1982 391 413 0 482 1286 1983 489 449 0 801 1739 1984 628 519 0 877 2024 1985 911 680 0 948 2539 1986 1050 871 0 1037 2958 1987 1062 1131 1 1108 3302 1988 935 1198 0 1191 3324 1989 894 1246 0 1268 3408 1990 859 1535 2 1018 3414 1991 768 1617 5 1068 3458 1992 840 1806 6 1043 3695 1993 974 1947 6 1089 4016 1994 1025 2025 20 1193 4263 1995 989 2353 30 1063 4435 1996 1199 2860 52 983 5094 1997 1226 3194 72 916 5408 1998 1471 3133 81 1054 5739 1999 1696 3517 87 1015 6315 2000 2278 4343 79 1265 7965 2001 2419 5141 114 1576 9250 2002 2722 6343 140 2067 11272 2003 2938 6658 154 2438 12188 2004 3168 7572 196 2729 13665 2005 3500 8209 206 3129 15044 2006 3712 8595 217 3556 16080 2007 4013 9149 236 3841 17239 2008 5227 9605 251 3469 18552 2009 5414 8137 260 3118 16929 Source: MME, 2010. The Figure 2, shows that the import of gas tends to stabilize according to what was described by Santana et al. [3], especially with the reduction of dependence on Bolivian gas. 4.3. Consumption of Natural Gas The natural gas consumption in Brazil is primarily Indus- trial as Figure 3. In 2007, industrial use accounted for 54% of the Brazilian natural gas demand [15]. The par- ticipation of home consumption in Brazil’s energy matrix Copyright © 2012 SciRes. NR  Estimation of Natural Gas Production, Import and Consumption in Brazil Based on Three Mathematical Models Copyright © 2012 SciRes. NR 45 is very small when compared with countries such as Po- land [16], Iran [9] and Turkey [17]. Aydinalp et al. [18] used neural network (NN) to model residential energy consumption in Canada. then stay at around that level until 2013, when it will begin a further period of increase until 2016. The impor- tation of natural gas from Bolivia and Argentina is ex- pected to stabilize at a level of 30 MMm3/day. For the logistic model shown in Figure 4, the terms K and r of Equation (4) were obtained by least squares fit- ting of the Equation (3). The value of K used was 50,000 × 106 m3 of gas. The Figure 5 shows the forecast of natural gas pro- duction until 2017 from exponential model. Comparing the results in Table 4 with the results of the exponential model, we found out that between 2009 and 2017 the points are near the projection. 4.4. Projection of Production and Import of Natural Gas by 2017 with the Use of Population Dynamics Models The Figure 6 shows the forecast of natural gas import until 2017 from von Bertalanffy model. Comparing the results in Table 4 with the results of the von Bertalanffy model, it’s possible to see that results are close to the projection. The results from the logistic model showed 30.9 MMm3/day in 2015 and the value of Table 4 for the same period was 30.1 MMm3/day. Table 4 represents the forecasted daily production and importation of natural gas in the PDE from 2008 to 2017. Total production (TP) is expected to increase year-on- year until 2010, reaching a level of 95 MMm3/day. It will Figure 1. Production of natural gas as function of time with the exponential model. Figure 2. Import of natural gas as function of time with the von Bertalanffy model. Figure 3. Consumption of natural gas in Brazil. 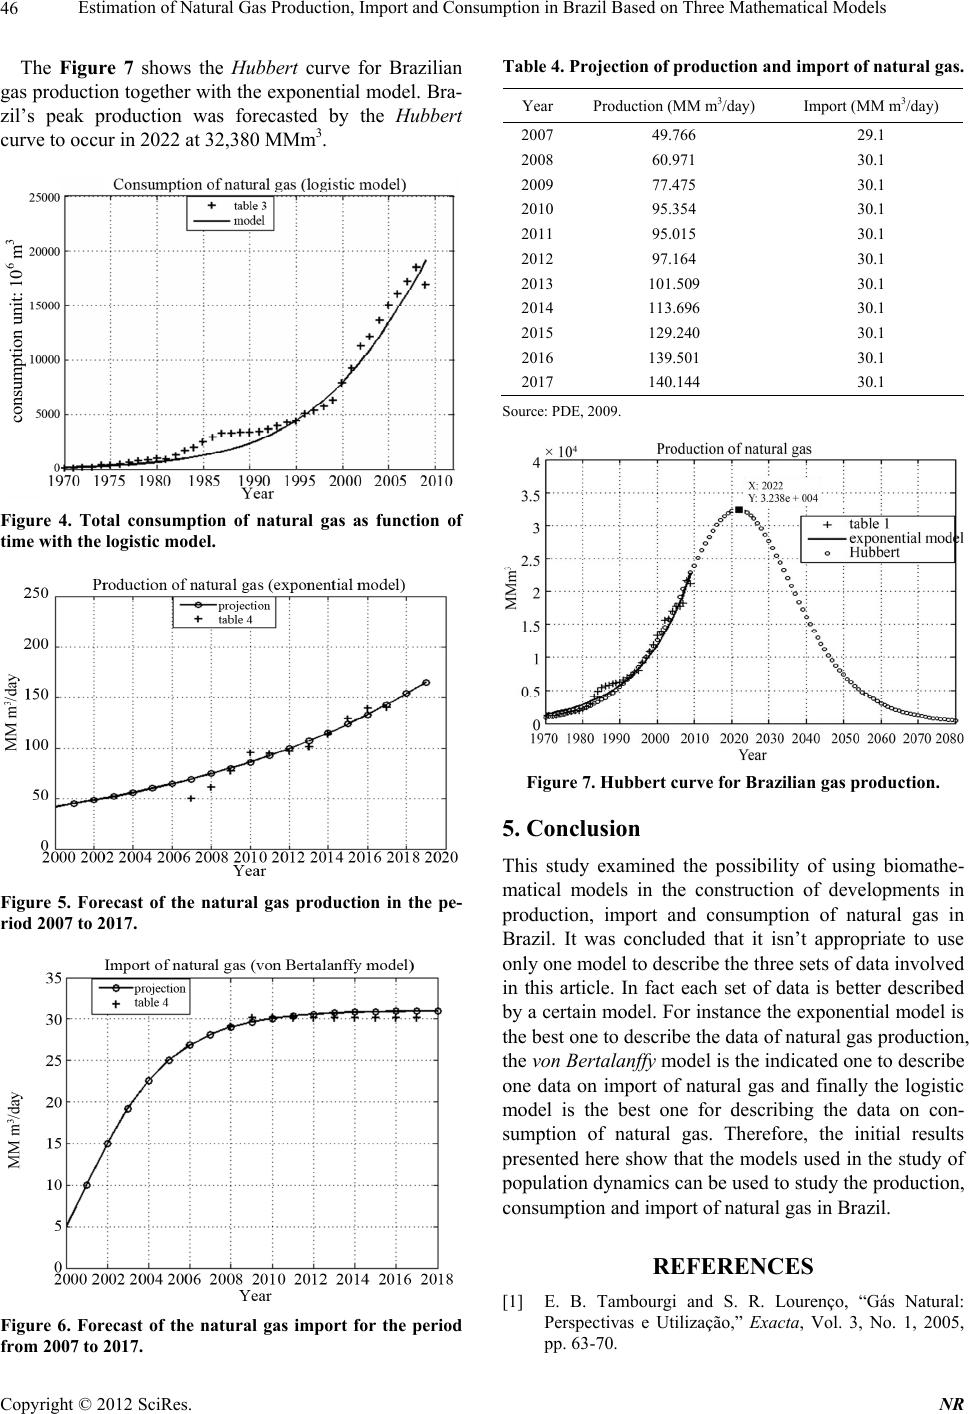 Estimation of Natural Gas Production, Import and Consumption in Brazil Based on Three Mathematical Models 46 The Figure 7 shows the Hubbert curve for Brazilian gas production together with the exponential model. Bra- zil’s peak production was forecasted by the Hubbert curve to occur in 2022 at 32,380 MMm3. consum p tion unit: 10 6 m 3 Figure 4. Total consumption of natural gas as function of time with the logistic model. Figure 5. Forecast of the natural gas production in the pe- riod 2007 to 2017. Figure 6. Forecast of the natural gas import for the period from 2007 to 2017. Table 4. Projection of production and import of natural gas. Year Production (MM m3/day) Import (MM m3/day) 2007 49.766 29.1 2008 60.971 30.1 2009 77.475 30.1 2010 95.354 30.1 2011 95.015 30.1 2012 97.164 30.1 2013 101.509 30.1 2014 113.696 30.1 2015 129.240 30.1 2016 139.501 30.1 2017 140.144 30.1 Source: PD E, 2009. Figure 7. Hubbert curve for Brazilian gas production. 5. Conclusion This study examined the possibility of using biomathe- matical models in the construction of developments in production, import and consumption of natural gas in Brazil. It was concluded that it isn’t appropriate to use only one model to describe the three sets of data involved in this article. In fact each set of data is better described by a certain model. For instance the exponential model is the best one to describe the data of natural gas production, the von Bertalanffy model is the indicated one to describe one data on import of natural gas and finally the logistic model is the best one for describing the data on con- sumption of natural gas. Therefore, the initial results presented here show that the models used in the study of population dynamics can be used to study the production, consumption and import of natural gas in Brazil. REFERENCES [1] E. B. Tambourgi and S. R. Lourenço, “Gás Natural: Perspectivas e Utilização,” Exacta, Vol. 3, No. 1, 2005, pp. 63-70. Copyright © 2012 SciRes. NR 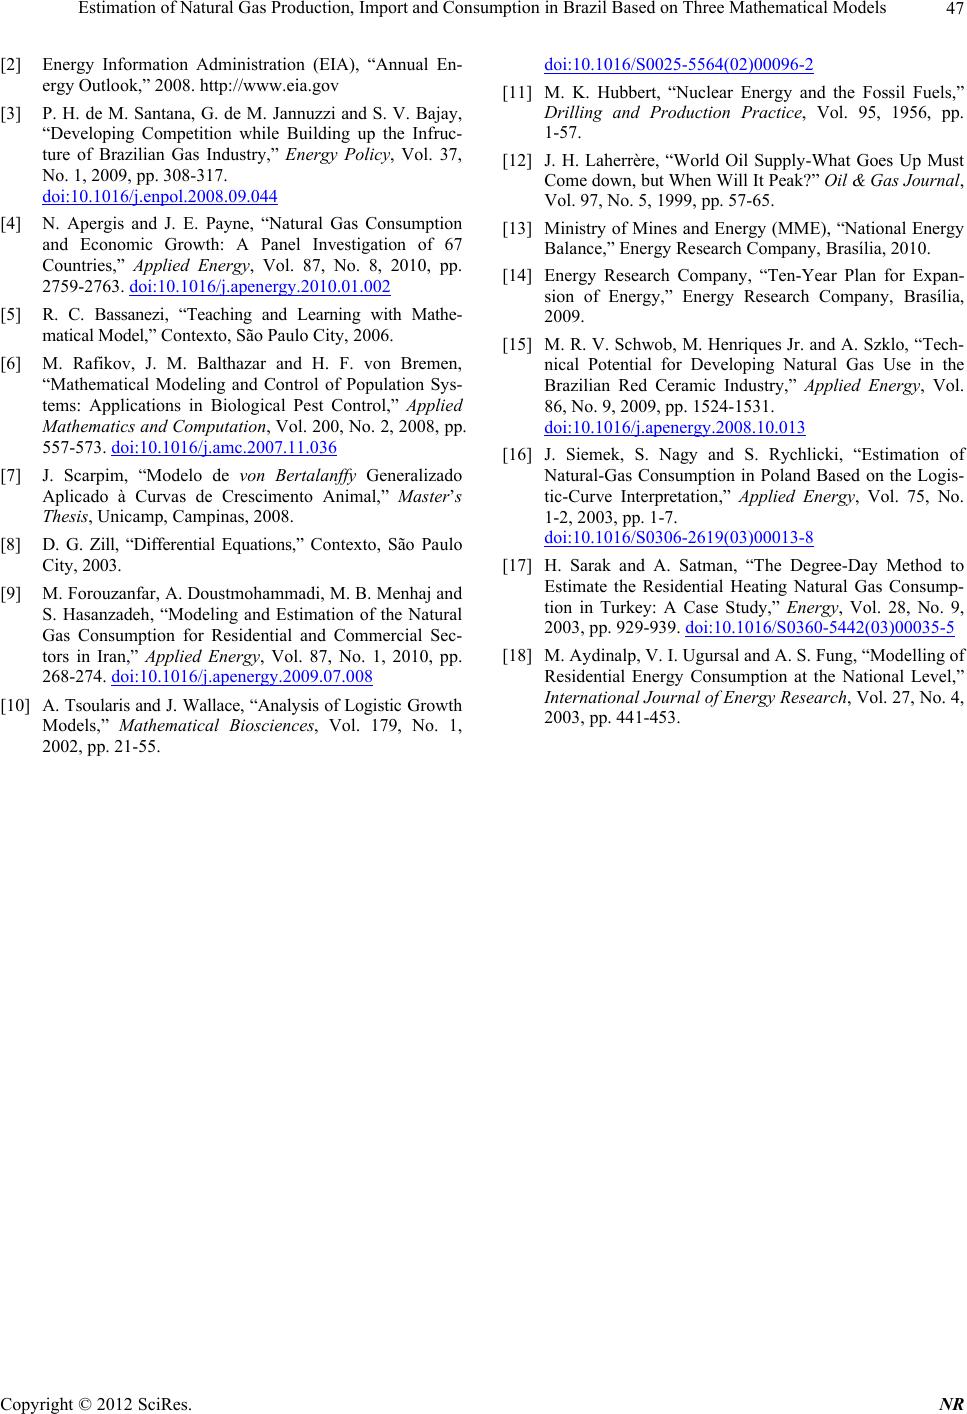 Estimation of Natural Gas Production, Import and Consumption in Brazil Based on Three Mathematical Models 47 [2] Energy Information Administration (EIA), “Annual En- ergy Outlook,” 2008. http://www.eia.gov [3] P. H. de M. Santana, G. de M. Jannuzzi and S. V. Bajay, “Developing Competition while Building up the Infruc- ture of Brazilian Gas Industry,” Energy Policy, Vol. 37, No. 1, 2009, pp. 308-317. doi:10.1016/j.enpol.2008.09.044 [4] N. Apergis and J. E. Payne, “Natural Gas Consumption and Economic Growth: A Panel Investigation of 67 Countries,” Applied Energy, Vol. 87, No. 8, 2010, pp. 2759-2763. doi:10.1016/j.apenergy.2010.01.002 [5] R. C. Bassanezi, “Teaching and Learning with Mathe- matical Model,” Contexto, São Paulo City, 2006. [6] M. Rafikov, J. M. Balthazar and H. F. von Bremen, “Mathematical Modeling and Control of Population Sys- tems: Applications in Biological Pest Control,” Applied Mathematics and Computation, Vol. 200, No. 2, 2008, pp. 557-573. doi:10.1016/j.amc.2007.11.036 [7] J. Scarpim, “Modelo de von Bertalanffy Generalizado Aplicado à Curvas de Crescimento Animal,” Master’s Thesis, Unicamp, Campinas, 2008. [8] D. G. Zill, “Differential Equations,” Contexto, São Paulo City, 2003. [9] M. Forouzanfar, A. Doustmohammadi, M. B. Menhaj and S. Hasanzadeh, “Modeling and Estimation of the Natural Gas Consumption for Residential and Commercial Sec- tors in Iran,” Applied Energy, Vol. 87, No. 1, 2010, pp. 268-274. doi:10.1016/j.apenergy.2009.07.008 [10] A. Tsoularis and J. Wallace, “Analysis of Logistic Gro wth Models,” Mathematical Biosciences, Vol. 179, No. 1, 2002, pp. 21-55. doi:10.1016/S0025-5564(02)00096-2 [11] M. K. Hubbert, “Nuclear Energy and the Fossil Fuels,” Drilling and Production Practice, Vol. 95, 1956, pp. 1-57. [12] J. H. Laherrère, “World Oil Supply-What Goes Up Must Come down, but When Will It Peak?” Oil & Gas Journal, Vol. 97, No. 5, 1999, pp. 57-65. [13] Ministry of Mine s and Energy (MME ), “National Energy Balance,” Energy Research Company, Brasília, 2010. [14] Energy Research Company, “Ten-Year Plan for Expan- sion of Energy,” Energy Research Company, Brasília, 2009. [15] M. R. V. Schwob, M. Henriques Jr. and A. Szklo, “Tech- nical Potential for Developing Natural Gas Use in the Brazilian Red Ceramic Industry,” Applied Energy, Vol. 86, No. 9, 2009, pp. 1524-1531. doi:10.1016/j.apenergy.2008.10.013 [16] J. Siemek, S. Nagy and S. Rychlicki, “Estimation of Natural-Gas Consumption in Poland Based on the Logis- tic-Curve Interpretation,” Applied Energy, Vol. 75, No. 1-2, 2003, pp. 1-7. doi:10.1016/S0306-2619(03)00013-8 [17] H. Sarak and A. Satman, “The Degree-Day Method to Estimate the Residential Heating Natural Gas Consump- tion in Turkey: A Case Study,” Energy, Vol. 28, No. 9, 2003, pp. 929-939. doi:10.1016/S0360-5442(03)00035-5 [18] M. Aydinalp, V. I. Ugursal and A. S. Fung, “Modelling of Residential Energy Consumption at the National Level,” International Journal of Energy Research, Vol. 27, No. 4, 2003, pp. 441-453. Copyright © 2012 SciRes. NR |