

Paper Menu >>
Journal Menu >>
 Open Journal of Soil Science, 2012, 2, 133-145 http://dx.doi.org/10.4236/ojss.2012.22019 Published Online June 2012 (http://www.SciRP.org/journal/ojss) 133 Effect of Industrial Sludge Application on Soil Nitrogen and Wheat Plant Response Sutapa Bose1,2*, Asim K. Bhattacharyya1 1School of Environmental Sciences, Jawaharlal Nehru University, New Delhi, India; 2Department of Earth Sciences, Indian Institute of Science Education and Research (IISER) Kolkata PO: BCKV Main Campus, Mohanpur Nadia, India. Email: *[email protected] Received January 5th, 2012; revised February 10th, 2012; accepted February 23rd, 2012 ABSTRACT Wazirpur industrial area of Delhi generates a huge quantity of sludge per day, which is highly acid ic in nature (pH 2.7 to 4.4) and contains macronutrients, micronutrients as well as toxic metals. A pot-culture experiment was conducted by taking the two soils (JNU and Chhattarpur) amended with sludge (0%, 10%, 20%, 30%), pretreated with lime (0%, 0.5% and 1%). Two wheat seedlings were planted per pot containing 3 kg sludge amended or control soil and the experiment was carried out till harvesting (four months) in a glass house. Lime treatments enhanced the N content in wheat plant in almost all cases. Sludge and lime treatments enhanced dry weight in wheat plants grown in Chhattarpur soil and dry weight increased with time. Maximum growth was observed in 0.5 lime treated and 20% sludge amended soils. But we have to take an account about any kind of metal toxicity before disposal of this waste to land. Keywords: Industrial Sludge; Lime Treatment; Land Disposal; Soil Nitrogen; Wheat Plant 1. Introduction Like many countries in South Asia, India is regarded as an agricultural country. Indian agricultural soils have been used extensively for crop production for extended period of time and are usually low in soil organic matter and essential plant nutrients fo r crop. Addition of chemi- cal fertilizers is most commonly used, which increased the cost of crops. To re duce such expenditure an d to ma- nage the soil quality o f land, sludge app lication (which is considered an organic fertilizer) is an alternative source of plant nutrients for crops. Land application of industrial sludge is an option for safe and economic methods for waste disposal. The ap- plication of urban industrial sludge mixed with sewage sludge to agricultural soil is generally most economic outlet for waste disposal, in this way it is possible to re- cycled the plant nutrients such as N, P and organic matter and many more macro and micro nutrients. On the other hand it can affect the soil fertilit y, food safety and natural ecosystem in general. Many researches have been carried out on the effect of applying sewage to agricultural soil as regards both the potential effects due to sewage toxic components [1-11]. Sewage sludge provides labile or- ganic matter in sufficient quantities to stimulate soil mi- croorganisms. This kind of organic residue improves the soil physical characteristics: increasing soil’s water hold- ing capacity and percentage of stable aggregates and en- hanced the nutritional quality of soils [12]. It can im- prove the physical properties of soils [13] by increasing soil porosity, and the stability of soil aggregation [14]. So, sludge can be used as soil fertilizer provided that pre- treatments have done for its metal contents. Liming to soil offers a mean of minimizing the risk of food chain contamination by reducing the plant uptake of sludge- born heavy metals [15-17]. Urban sludge application on land increased the dry matter yield of maize over control [18]. According to several studies the effectiveness of liming varies depending on the soil, metal, pH value of the limed soils and crop species [19,20]. Matula and Pechová [21] studied that application of lime in lower pH value increased nitrification in soil. Nitrogen supply in plants mainly depends on soil available nitrogen so be- fore cultivation it is necessary to estimate N release from mineralization. In a field experiment the shoot dry weight of lowland rice (Oryza sativa L.) increased with the in- crease in shoot N uptake up to flowering stage of plant growth. At harvest, N uptake in the shoot decreased due to translocation to th e grain. The aim of the present study is to investigate the be- havior of sludge amended soil in respect to available ni- trogen in soils and response of wheat p lants in context of root shoot length, dry weight and nitrogen content in it. The industrial sludge, which was used for the experiment, *Corresponding a uthor. Copyright © 2012 SciRes. OJSS  Effect of Industrial Sludge Application on Soil Nitrogen and Wheat Plant Response 134 was acidic in nature, so that, sludge was treated with dif- ferent dosages of lime and then the sludge was mixed with soils collected from two different parts of Delhi. A pot culture experiment was conducted in a glass house to see the response of wheat plants grown in lime treated or untreated industrial sludge amended soils. 2. Material and Methods 2.1. Samples Collection Samples were collected from different location of of Wazirpur industrial area, Delhi (Figure 1) for each sea- son (summer, monsoon and winter) from road-side dumps by following the standard methods. Soil samples were collected from 5 different spots from JNU as well as from Chhattarpur and were homogenized separately. Soil sampling was done once during the study period. Soon after the collection of sludge and soils, the pH Electrical Conductivity (EC), Water Holding Capacity (WHC) and Moisture Content (MC) were measured [22] and remaining samples were kept for drying. Then air- dried sludge samples were grinded and pass through 2 mm sieve and homogenized to make a representative sample. Soil samples were also processed by following the same methods. 2.2. Preparation for Glass House Experiment The homogenized sludges were treated with three diffe- rent dosages of lime (0%, 0.5% and 1%) separately. Then the lime treated and untreated sludges were mixed with two soils (Chhattarpur and JNU) separately at the rate of 0%, 10% 20% and 30% (dry weight basis). Then the sludge amended and control soils were put in new ear- then pots (3 kg/pot). The wheat grains (HD1553) were collected from Na- tional Seed Corporation (NSC), Pusa, New Delhi. The plants were grown in two trays with two different soils. Two wheat seedlings of 10 days old were transferred per pots containing 3 kg sludge amended soil or control soil. Figure 1. Showing the sampling sites (Wazirpur industrial area in NCT De lhi). Copyright © 2012 SciRes. OJSS  Effect of Industrial Sludge Application on Soil Nitrogen and Wheat Plant Response 135 Distilled water was given to plants to maintained 50% moisture of WHC in sludge amended and control soils throughout the experiment. Whole experiment was car- ried out in a glass house maintaining the temperature at 20˚C - 30˚C. The experiment was performed with three replicates and was continued from January to April 2004. 2.3. Collection and Preservation of Soil and Plant Samples Plants and soils samples were taken out from the pots in different stages of plant growth, viz. planting, tillering, flowering, grain formation and harvesting respectively. At each harvest plants were removed carefully and washed first with tap water followed by de-ionized water. Root and shoot were separated and lengths were mea- sured. Then folded it in brown paper and kept in oven at 80˚C for 48 hrs. After drying root and shoot weights were taken separately. Wheat grains were also measured after harvesting stage of wheat plant growth. The soil samples were air-dried at ambient room temperature, and passed through 2 mm sieve for chemical analysis. The available (mineralizable) nitrogen analyzed by following Subbian and Asija [23] method. The soil samples were stored in an airtight polythene bags and kept at 4˚C to prevent any kind of microbial degradation. The total ni- trogen of plant samples was an alyzed through acid diges- tion followed by Kjeldahl method [24]. The parameters were carried out in triplicate for better results. 2.4. Data Analysis In the present study, the plant total nitrogen and soil available (mineralizable) nitrogen (amended with differ- ent proportion of lime treated sludge) were monitored on five growth stages of plants (days). Similarly, plant’s nitrogen was also monitored on four growth stages of plants. These parameters were studied for root and shoot separately. Each set of data was arranged to accomplish two sets of 2-factor ANOVA as follows: 1) Keeping sludge treatment constant, growth period and lime treatment were taken as two factors. 2) Keeping lime treatment constant, growth period and sludge amendment were taken as two factors. 3. Results and Discussion 3.1. Available (Mineralizable) Nitrogen in Soils The available nitrogen of Chhattarpur control soil (49 ± 2.9 ppm) was higher than JNU control soil (42 ± 2.2 ppm). Sludge application increased the available nitrogen in both soils. Sludge amendment enhanced the available nitrogen in alkaline so il than acidic soil [25]. Lime treat- ment (0.5%) decreased the available nitrogen in Chhat- tarpur soil, whereas 1% lime application enhanced the available nitrogen in sludge amended Chhattarpur soil. In JNU soil lime treatment gradually and slowly increased and got stabilized the available nitrogen concentration in sludge amended JNU soil, in most of the cases. ANOVA results show the variation in available nitrogen, were highly significant. With the successive stages of plant growth the changes in available (mineralizable) nitrogen in soils were also highly significant. It is clear that higher amount of lime application had neutralized the acidity of amended soil. Hence, there was an increase amount of available nitrogen in those soils. Lime treatment gradu- ally, but slowly increased (or stabilized in some cases) the available (mineralizable) nitrogen concentration in waste amended JNU soil. Both mineralization and im- mobilization take place simultaneously and may not be quantified separately. Gaseous N loss would also depend on pH and temperature regimes of soil. The pH inhibits mineralization only at the levels whose pH is below 5 and higher than 8. Nitrogen mineralization dynamics are predominantly determined by the soil properties such as total C, total N, soil texture and water holdidg capacity [26]. A sufficiently long latent time (8 weeks) was needed for tolerant microorganisms to release or to start nitrogen minerilazation. The nitrogen mineralization was positive in the presence of metals in most of the cases [27]. Figures 2 and 3 showing that available (mineralizable) nitrogen in soils increased till flowering stage and the gradually decreased with the successive stages of wheat plant growth which indicated that the rate of release of available (mineralizable) N was higher than the uptake or immobilization on nitrogen in waste amended soil till flowering stage of wheat plant growth. The changes in available (mineralizable) nitrogen were significant with lime treatments, sludge amendment as well as with growth periods (P < 0.05). 3.2. Dry Weight of Wheat Plant’s Root-Shoot-Grain Sludge amendments increased plant growth significantly as compared to the control soil and the growth was higher in the plant grown in Chhattarpur pure soil than JNU soil. Lime amendment showed a positive effect on plant growth at each sludge amendment, which is likely due to neutralizing pH, reducin g the availability o f heavy metals. The dry wt. of crops increased with increasing soil pH [4] which was also observed in th e present study. The control soils were alkaline in nature viz. pH of Chhattarpur soil was 8.66 and JNU soil was 8.37 whereas, the sludge was very acidic (pH 3.05) in nature [17,28]. The dry weights of harvested grains were higher in wheat plants grown in JNU soil than Chhattarpur soil. Sludge application increased the dry weight of grains in all cases. Copyright © 2012 SciRes. OJSS  Effect of Industrial Sludge Application on Soil Nitrogen and Wheat Plant Response 136 Lime treatment increased the dry weight of grain. The changes in shoot dry weight were significant with lime treatments, sludge amendment as well as with growth periods (P < 0.05). (Table 1) The changes in root dry weight were significant with lime treatments as well as with growth periods while these were insignificant with sludge amendment (P < 0.05). 3.3. Lengths of Wheat Plant’s Root-Shoot The length of wheat plant’s shoot was higher in plants grown in JNU control soil than Chhattarpur control soil (Table 2). 10% sludge application reduced the shoot length as compared with control one. But 20% and 30% sludge application increased the shoot length. The changes in root-shoot length were almost insignificant with lime treatments, sludge amendment as well as with growth periods (P < 0.05). Lime treatment increased the shoot length slightly. Length of wheat plant’s root in- creased with increasing percent of sludge (10% and 20%) but decreased at 30% sludge amendment, which showed that application of sludge had some, limiting factors, which prevents the growth of plants. Lime treatments in- creased the root length. Over the time (i.e. stages of plant growth) the root length increased significantly. 3.4. Total Nitrogen in Wheat Plant The total nitrogen in wheat plant’s shoot and root were 0.44% ± 0.02% and 0.15% ± 0% of dry weight at the d ay of plantation respectively. The nitrogen concentration in wheat plant’s shoot increased with the successive stages of plants growths in most of the cases. It was observed that the available nitrogen in sludge amended soil de- creased during grain formation to harvesting, which may be due to higher uptake of nitrogen in wheat plants (Fig- ures 2, 3). Sludge application (20% and 30%) decreased the N content in wheat plants, which might be due to toxic effects of heavy metals. But, the total nitrogen in- creased in wheat plants shoots grown in 10% sludge amended Chhattarpur soil. The changes in total nitrogen in wheat shoot were almost insignificant with lime treat- ments, sludge amendment as well as growth periods (P < 0.05). The changes in total nitrogen in wheat root were largely significant with lime treatments as well as sludge amendment while insignificant with growth periods (P < 0.05). The sludge contained higher concentration of heavy metals, which caused the stress of nutrients to the plants [17,28,29]. Sludge application in Chhattarpur soil enhanced the total nitrogen in wheat plant’s root, except 30% sludge amended Chhattarpur soil (Figure 4). The Table 1 . Dry weight (g/P ot) of wheat plant’s shoot and root grown in s ludg e amended soils in different stages of plant growth. Stages of plant growth Tillering Flowering Grainform Harvesting Sample code Shoot Root Shoot Root Shoot Root Shoot Root C-0-0 1.22 ± 0.02 0.34 ± 0.02 3.1 ± 0.06 0.52 ± 0.04 3.85 ± 0.04 0.92 ± 0.05 5.21 ± 0.02 1.25 ± 0.03 C-10-0 1.04 ± 0.03 0.31 ± 0.01 2.8 ± 0.05 0.48 ± 0.04 3.42 ± 0.05 0.68 ± 0.05 5.34 ± 0.07 0.95 ± 0.05 C-10-0.5 1.15 ± 0.06 0.35 ± 0.02 3 ± 0.04 0.53 ± 0.03 3.66 ± 0.05 0.72 ± 0.06 5.56 ± 0.07 1.08 ± 0.05 C-10-1.0 1.21 ± 0.05 0.33 ± 0.03 3.2 ± 0.02 0.55 ± 0.04 3.79 ± 0.02 0.75 ± 0.04 5.84 ± 0.05 1.15 ± 0.05 C-20-0 1.54 ± 0.06 0.34 ± 0.04 3.6 ± 0.03 0.42 ± 0.05 3.91 ± 0.03 0.75 ± 0.06 5.92 ± 0.04 0.95 ± 0.04 C-20-0.5 1.68 ± 0.03 0.38 ± 0.04 3.8 ± 0.04 0.46 ± 0.04 4.16 ± 0.04 0.81 ± 0.06 6.13 ± 0.06 1.02 ± 0.05 C-20-1.0 1.98 ± 0.02 0.41 ± 0.02 3.86 ± 0.02 0.51 ± 0.03 4.28 ± 0.02 0.85 ± 0.07 6.28 ± 0.05 1.05 ± 0.06 C-30-0 1.86 ± 0.06 0.44 ± 0.05 4.3 ± 0.05 0.5 ± 0.01 4.76 ± 0.05 0.71 ± 0.07 6.11 ± 0.06 0.89 ± 0.06 C-30-0.5 2.05 ± 0.05 0.49 ± 0.06 4.1 ± 0.07 0.53 ± 0.02 4.55 ± 0.08 0.82 ± 0.07 6.42 ± 0.07 0.95 ± 0.07 C-30-1.0 2.21 ± 0.08 0.51 ± 0.05 4.5 ± 0.04 0.57 ± 0.04 4.62 ± 0.09 0.88 ± 0.07 6.44 ± 0.08 0.99 ± 0.03 J-0-0 1.14 ± 0.05 0.27 ± 0.05 2.54 ± 0.05 0.33 ± 0.02 2.75 ± 0.05 0.73 ± 0.07 4.88 ± 0.04 1.11 ± 0.03 J-10-0 1.08 ± 0.02 0.24 ± 0.02 2.33 ± 0.03 0.28 ± 0.03 2.55 ± 0.04 0.57 ± 0.07 4.73 ± 0.05 0.86 ± 0.05 J-10-0.5 1.28 ± 0.02 0.28 ± 0.03 2.62 ± 0.02 0.31 ± 0.02 2.75 ± 0.03 0.59 ± 0.07 4.95 ± 0.03 0.97 ± 0.05 J-10-1.0 1.34 ± 0.03 0.27 ± 0.04 2.6 ± 0.02 0.33 ± 0.01 2.76 ± 0.07 0.63 ± 0.08 5.06 ± 0.02 0.99 ± 0.07 J-20-0 1.35 ± 0.04 0.3 ± 0.03 2.91 ± 0.03 0.35 ± 0.03 2.99 ± 0.07 0.68 ± 0.05 5.16 ± 0.07 0.79 ± 0.07 J-20-0.5 1.45 ± 0.05 0.34 ± 0.05 3.12 ± 0.04 0.37 ± 0.03 3.22 ± 0.03 0.73 ± 0.05 5.37 ± 0.08 0.82 ± 0.06 J-20-1.0 1.49 ± 0.02 0.35 ± 0.04 3.05 ± 0.04 0.39 ± 0.04 3.29 ± 0.05 0.77 ± 0.05 5.52 ± 0.09 0.88 ± 0.04 J-30-0 1.38 ± 0.02 0.38 ± 0.05 3.15 ± 0.02 0.43 ± 0.04 3.29 ± 0.08 0.56 ± 0.06 5.11 ± 0.08 0.77 ± 0.07 J-30-0.5 1.55 ± 0.03 0.4 ± 0.03 3.36 ± 0.03 0.46 ± 0.04 3.54 ± 0.08 0.64 ± 0.06 5.38 ± 0.06 0.81 ± 0.08 J-30-1.0 1.67 ± 0.06 0.42 ± 0.04 3.45 ± 0.04 0.5 ± 0.02 3.62 ± 0.06 0.68 ± 0.05 5.49 ± 0.08 0.85 ± 0.05 [C = Chhattarpur soil, J = JNU soil; 0, 10, 20, 30 (% of sludge amendments); 0, 0.5, 1 (% of Lime treatments). All the values are mean of three replicates]. Copyright © 2012 SciRes. OJSS 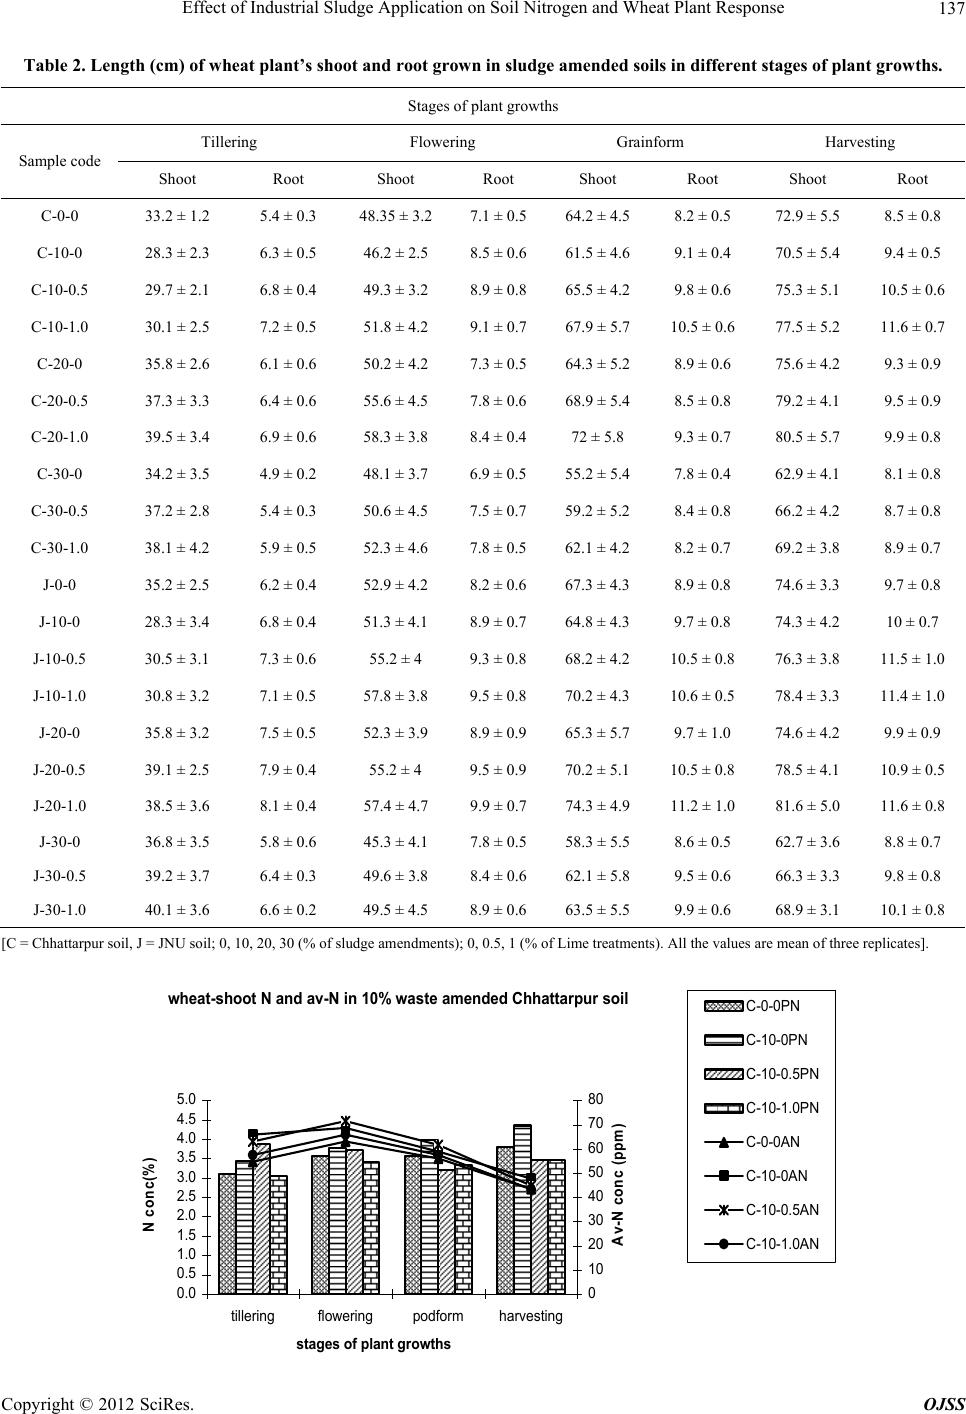 Effect of Industrial Sludge Application on Soil Nitrogen and Wheat Plant Response 137 Table 2. Length (cm) of wheat plant’s shoot and root grown in sludge amended soils in different stages of plant growths. Stages of plant growths Tillering Flowering Grainform Harvesting Sample code Shoot Root Shoot Root Shoot Root Shoot Root C-0-0 33.2 ± 1.2 5.4 ± 0.3 48.35 ± 3.2 7.1 ± 0.5 64.2 ± 4.5 8.2 ± 0.5 72.9 ± 5.5 8.5 ± 0.8 C-10-0 28.3 ± 2.3 6.3 ± 0.5 46.2 ± 2.5 8.5 ± 0.6 61.5 ± 4.6 9.1 ± 0.4 70.5 ± 5.4 9.4 ± 0.5 C-10-0.5 29.7 ± 2.1 6.8 ± 0.4 49.3 ± 3.2 8.9 ± 0.8 65.5 ± 4.2 9.8 ± 0.6 75.3 ± 5.1 10.5 ± 0.6 C-10-1.0 30.1 ± 2.5 7.2 ± 0.5 51.8 ± 4.2 9.1 ± 0.7 67.9 ± 5.7 10.5 ± 0.6 77.5 ± 5.2 11.6 ± 0.7 C-20-0 35.8 ± 2.6 6.1 ± 0.6 50.2 ± 4.2 7.3 ± 0.5 64.3 ± 5.2 8.9 ± 0.6 75.6 ± 4.2 9.3 ± 0.9 C-20-0.5 37.3 ± 3.3 6.4 ± 0.6 55.6 ± 4.5 7.8 ± 0.6 68.9 ± 5.4 8.5 ± 0.8 79.2 ± 4.1 9.5 ± 0.9 C-20-1.0 39.5 ± 3.4 6.9 ± 0.6 58.3 ± 3.8 8.4 ± 0.4 72 ± 5.8 9.3 ± 0.7 80.5 ± 5.7 9.9 ± 0.8 C-30-0 34.2 ± 3.5 4.9 ± 0.2 48.1 ± 3.7 6.9 ± 0.5 55.2 ± 5.4 7.8 ± 0.4 62.9 ± 4.1 8.1 ± 0.8 C-30-0.5 37.2 ± 2.8 5.4 ± 0.3 50.6 ± 4.5 7.5 ± 0.7 59.2 ± 5.2 8.4 ± 0.8 66.2 ± 4.2 8.7 ± 0.8 C-30-1.0 38.1 ± 4.2 5.9 ± 0.5 52.3 ± 4.6 7.8 ± 0.5 62.1 ± 4.2 8.2 ± 0.7 69.2 ± 3.8 8.9 ± 0.7 J-0-0 35.2 ± 2.5 6.2 ± 0.4 52.9 ± 4.2 8.2 ± 0.6 67.3 ± 4.3 8.9 ± 0.8 74.6 ± 3.3 9.7 ± 0.8 J-10-0 28.3 ± 3.4 6.8 ± 0.4 51.3 ± 4.1 8.9 ± 0.7 64.8 ± 4.3 9.7 ± 0.8 74.3 ± 4.2 10 ± 0.7 J-10-0.5 30.5 ± 3.1 7.3 ± 0.6 55.2 ± 4 9.3 ± 0.8 68.2 ± 4.2 10.5 ± 0.8 76.3 ± 3.8 11.5 ± 1.0 J-10-1.0 30.8 ± 3.2 7.1 ± 0.5 57.8 ± 3.8 9.5 ± 0.8 70.2 ± 4.3 10.6 ± 0.5 78.4 ± 3.3 11.4 ± 1.0 J-20-0 35.8 ± 3.2 7.5 ± 0.5 52.3 ± 3.9 8.9 ± 0.9 65.3 ± 5.7 9.7 ± 1.0 74.6 ± 4.2 9.9 ± 0.9 J-20-0.5 39.1 ± 2.5 7.9 ± 0.4 55.2 ± 4 9.5 ± 0.9 70.2 ± 5.1 10.5 ± 0.8 78.5 ± 4.1 10.9 ± 0.5 J-20-1.0 38.5 ± 3.6 8.1 ± 0.4 57.4 ± 4.7 9.9 ± 0.7 74.3 ± 4.9 11.2 ± 1.0 81.6 ± 5.0 11.6 ± 0.8 J-30-0 36.8 ± 3.5 5.8 ± 0.6 45.3 ± 4.1 7.8 ± 0.5 58.3 ± 5.5 8.6 ± 0.5 62.7 ± 3.6 8.8 ± 0.7 J-30-0.5 39.2 ± 3.7 6.4 ± 0.3 49.6 ± 3.8 8.4 ± 0.6 62.1 ± 5.8 9.5 ± 0.6 66.3 ± 3.3 9.8 ± 0.8 J-30-1.0 40.1 ± 3.6 6.6 ± 0.2 49.5 ± 4.5 8.9 ± 0.6 63.5 ± 5.5 9.9 ± 0.6 68.9 ± 3.1 10.1 ± 0.8 [C = Chhattarpur soil, J = JNU soil; 0, 10, 20, 30 (% of sludge amendments); 0, 0.5, 1 (% of Lime treatments). All the values are mean of three replicates]. wheat- shoot N and a v - N in 10% was t e am e nded Chha t t a rpur soil 0.0 0.5 1.0 1.5 2.0 2.5 3.0 3.5 4.0 4.5 5.0 tilleringfloweringpodform harvesting stages of plant growths N conc(%) 0 10 20 30 40 50 60 70 80 A v -N con c (p pm) C-0-0PN C-10-0PN C-10-0.5PN C-10-1.0PN C-0-0AN C-10-0AN C-10-0.5AN C-10-1.0AN Copyright © 2012 SciRes. OJSS 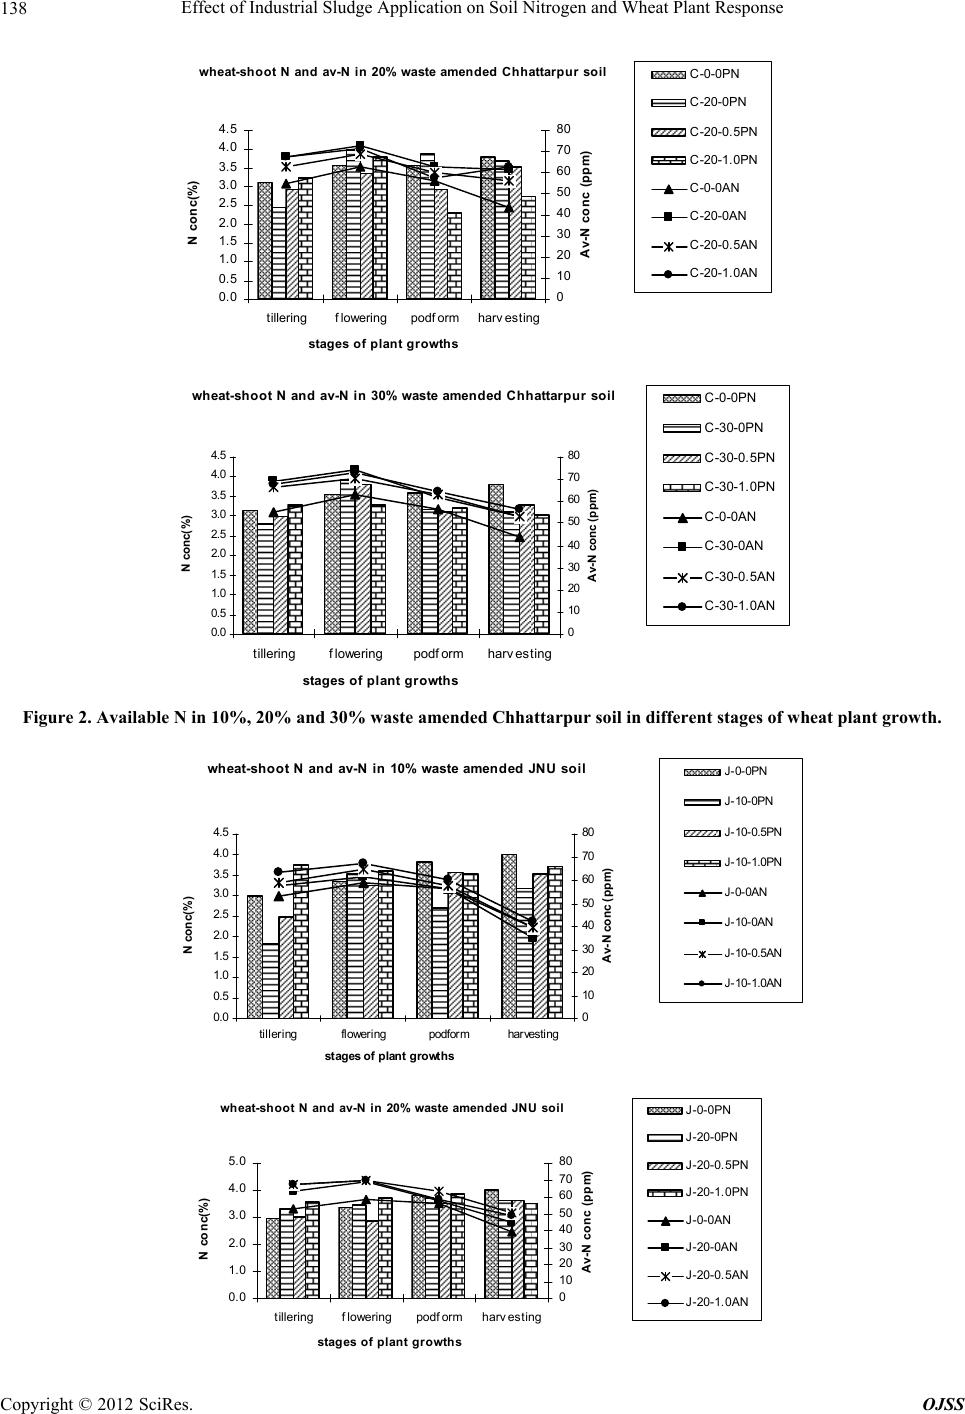 Effect of Industrial Sludge Application on Soil Nitrogen and Wheat Plant Response 138 wheat-shoot N and av-N in 20% waste amended Chhattarpur soil 0.0 0.5 1.0 1.5 2.0 2.5 3.0 3.5 4.0 4.5 tilleringfloweringpodform harvesting stages of plant growths N conc(%) 0 10 20 30 40 50 60 70 80 Av-N conc (ppm) C-0-0PN C-20-0PN C-20-0.5PN C-20-1.0PN C-0-0AN C-20-0AN C-20-0.5AN C-20-1.0AN wheat-shoot N and av-N in 30% waste amended Chhattarpur soil 0.0 0.5 1.0 1.5 2.0 2.5 3.0 3.5 4.0 4.5 tilleringfloweringpodf ormharv esting stages of p l an t g r o wths N c onc(% ) 0 10 20 30 40 50 60 70 80 Av -N c onc (ppm) C-0-0PN C-30-0PN C-30-0.5PN C-30-1.0PN C-0-0AN C-30-0AN C-30-0.5AN C-30-1.0AN Figure 2. Available N in 10%, 20% and 30% waste amended Chhattarpur soil in different stages of wheat plant growth. wh eat-sh o o t N an d av-N i n 10% waste amen d ed JN U so i l 0.0 0.5 1.0 1.5 2.0 2.5 3.0 3.5 4.0 4.5 tilleringfloweringpodformharvesting s tages of plant growths N c onc(%) 0 10 20 30 40 50 60 70 80 Av -N c onc (ppm ) J -0-0PN J -10-0PN J -10-0.5PN J -10-1.0PN J -0-0AN J -10-0AN J -10-0.5AN J -10-1.0AN wh eat-sh o o t N an d av-N i n 20% waste amen d e d JN U soil 0.0 1.0 2.0 3.0 4.0 5.0 tilleringfloweringpodform harvesting stag es o f p l an t g r o wth s N conc(%) 0 10 20 30 40 50 60 70 80 A v-N co n c (p p m) J-0-0PN J-20-0PN J-20-0.5PN J-20-1.0PN J-0-0AN J-20-0AN J-20-0.5AN J-20-1.0AN Copyright © 2012 SciRes. OJSS 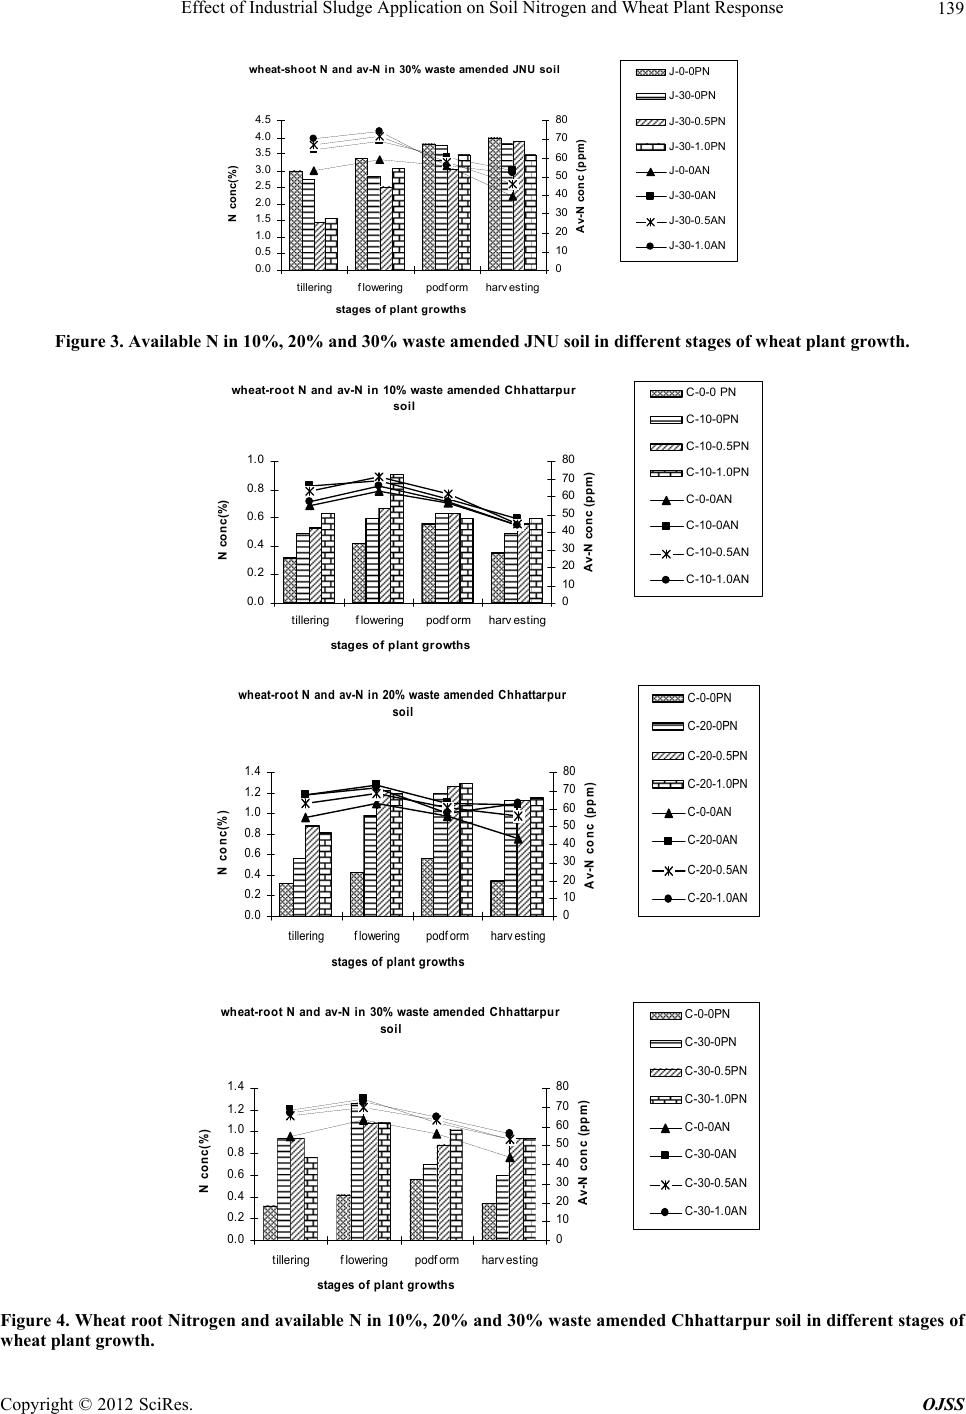 Effect of Industrial Sludge Application on Soil Nitrogen and Wheat Plant Response 139 wheat-shoot N and av-N in 30% waste amended JNU soil 0. 0 0. 5 1. 0 1. 5 2. 0 2. 5 3. 0 3. 5 4. 0 4. 5 tilleringfloweringpodform harvesting stages of plant growths N conc(%) 0 10 20 30 40 50 60 70 80 A v-N co n c (p p m) J-0-0PN J-30-0PN J-30-0. 5PN J-30-1. 0PN J-0-0AN J-30-0AN J-30-0. 5AN J-30-1. 0AN Figure 3. Available N in 10%, 20% and 30% waste amended JNU soil in different stages of wheat plant growth. wheat-root N and av-N in 10% waste amended Chhattarpur so il 0.0 0.2 0.4 0.6 0.8 1.0 tilleringfloweringpodf ormharv esting stag es o f p l an t g rowth s N conc(%) 0 10 20 30 40 50 60 70 80 A v-N co n c (p p m) C-0-0 PN C-10-0PN C-10-0.5PN C-10-1.0PN C-0-0AN C-10-0AN C-10-0.5AN C-10-1.0AN wh eat-r o o t N and av-N i n 20% waste amend ed C h h attar p u r soil 0.0 0.2 0.4 0.6 0.8 1.0 1.2 1.4 tilleringfloweringpodform harvesting stag es o f p l an t g r o wth s N conc(%) 0 10 20 30 40 50 60 70 80 A v-N c o n c (p p m ) C-0-0PN C-20-0PN C-20-0.5PN C-20-1.0PN C-0-0AN C-20-0AN C-20-0.5AN C-20-1.0AN wheat-root N and av-N in 30% waste amen ded Chhattarpu r soil 0.0 0.2 0.4 0.6 0.8 1.0 1.2 1.4 tilleringfloweringpodformharv esting stag es o f p l an t gro wth s N conc(%) 0 10 20 30 40 50 60 70 80 A v-N co n c (p p m ) C-0-0PN C-30-0PN C-30-0.5PN C-30-1.0PN C-0-0AN C-30-0AN C-30-0.5AN C-30-1.0AN Figure 4. Wheat root Nitrogen and available N in 10%, 20% and 30% waste amended Chhattarpur soil in different stages of wheat plant growth. Copyright © 2012 SciRes. OJSS 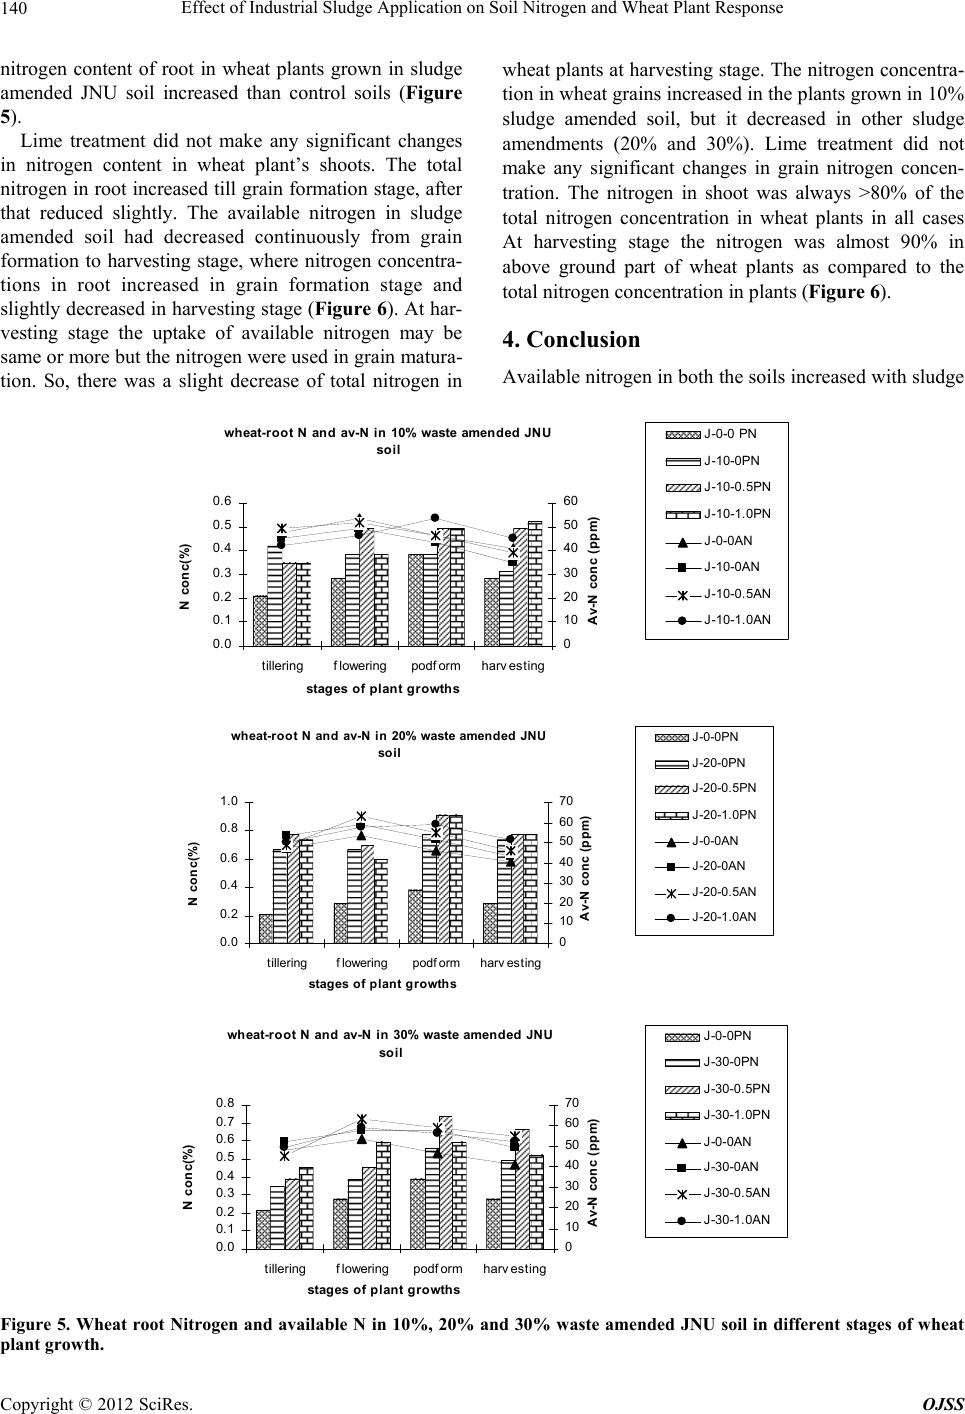 Effect of Industrial Sludge Application on Soil Nitrogen and Wheat Plant Response Copyright © 2012 SciRes. OJSS 140 nitrogen content of root in wheat plants grown in sludge amended JNU soil increased than control soils (Figure 5). wheat plants at harvesting stage. The nitrogen concentra- tion in wheat grains increased in the plants grown in 10% sludge amended soil, but it decreased in other sludge amendments (20% and 30%). Lime treatment did not make any significant changes in grain nitrogen concen- tration. The nitrogen in shoot was always >80% of the total nitrogen concentration in wheat plants in all cases At harvesting stage the nitrogen was almost 90% in above ground part of wheat plants as compared to the total nitrogen co ncentration in plants (Figure 6). Lime treatment did not make any significant changes in nitrogen content in wheat plant’s shoots. The total nitrogen in root in creased till grain formation stage, after that reduced slightly. The available nitrogen in sludge amended soil had decreased continuously from grain formation to harvesting stage, where nitrogen concentra- tions in root increased in grain formation stage and slightly decreased in harvesting stag e (Figure 6). At har- vesting stage the uptake of available nitrogen may be same or more but the nitrogen were used in grain matura- tion. So, there was a slight decrease of total nitrogen in 4. Conclusion Available nitrogen in both the so ils increased with sludge wh eat-r oo t N an d av-N i n 10% waste amend ed JN U soil 0.0 0.1 0.2 0.3 0.4 0.5 0.6 tilleringfloweringpodform harvesting stag es of p l an t g r o wth s N conc(%) 0 10 20 30 40 50 60 Av-N conc (ppm) J -0-0 PN J-10-0PN J-10-0.5PN J-10-1.0PN J-0-0AN J-10-0AN J-10-0.5AN J-10-1.0AN wh eat-r o o t N an d av-N i n 20% waste amen d ed JN U soil 0. 0 0. 2 0. 4 0. 6 0. 8 1. 0 tilleringfloweringpodf ormharv esting stag es o f p l an t g r o wth s N conc(%) 0 10 20 30 40 50 60 70 Av-N conc (ppm) J-0-0PN J-20-0PN J-20-0. 5PN J-20-1. 0PN J-0-0AN J-20-0AN J-20-0. 5AN J-20-1. 0AN wh eat-ro o t N an d av-N i n 30% waste amend ed JN U soil 0.0 0.1 0.2 0.3 0.4 0.5 0.6 0.7 0.8 tilleringfloweringpodform harvesting stages of plant growths N conc(%) 0 10 20 30 40 50 60 70 A v-N co n c (p p m) J-0-0PN J-30-0PN J-30-0.5PN J-30-1.0PN J-0-0AN J-30-0AN J-30-0.5AN J-30-1.0AN Figure 5. Wheat root Nitrogen and available N in 10%, 20% and 30% waste amended JNU soil in different stages of wheat plant growth.  Effect of Industrial Sludge Application on Soil Nitrogen and Wheat Plant Response 141 0% 10% 20% 30% 40% 50% 60% 70% 80% 90% 100% C-0-0C-10-0 C-10- 0.5 C-1 0- 1.0 C-20-0 C-20- 0.5 C-20- 1.0 C-30-0 C-30- 0.5 C-3 0- 1.0 tr e atments Percentage of total Nitrogen in shoot-root-grain of wheat plants grown in Chhattarpur soil at harvesting sta ge Grain shoot root 0% 10% 20% 30% 40% 50% 60% 70% 80% 90% 100% J-0-0J-10-0J-10-0.5 J-10-1.0J-20-0J-20-0.5J-20-1.0J-30-0J-30-0.5 J-30-1.0 treatments Percentag e of total Nitrogen in shoot-root-grain of wheat plants grown in JNU soil at harvesting stage Grain shoot root Figure 6. The percentage of wheat root-shoot-grain Nitrogen concentration in Chattarpur and JNU soil at harvesting stage. addition and lime treatment. Wheat plants observed in- crease in plant biomass as well as grain yields with the both sludge and lime amendments except 30% sludge amendment. The nitrogen content in both root and shoot increased with 10% sludge amendment but continuously decreased with other amendments i.e., 20% and 30% sludge amendments. Total nitrogen in root increased till grain formation and onward decreased which indicated that during grain filling an d maturation the nitro gen con- tent was utilized by upper part of the wheat plants. Available nitrogen was also continuously decreased dur- ing grain formation and harvesting stage. At harvesting stage the total nitrogen in shoot was 90% of the whole plant nitrogen. So, from this study, it seems that 20% sludge can be disposed off the land after 0.5 lime treat- ment. But, before make any final suggestion the heavy metal content in the consumable part of the wheat plant should be taken into an account pursued by field trial by following USEPA land application of sewage sludge [30]. 5. Acknowledgements Authors are thankful to Dean of School of Life Sciences, Jawaharlal Nehru University, New Delhi, India, for pro- viding glass house during the pot-culture experiment and, Sutapa Bose is thankful to University Gran t Commission (UGC), India to provide fund in the form of Junior Re- search Fellowship (JRF) followed by Senior Research Fellowship (SRF) du ri ng period o f he r work. REFERENCES [1] A. C. Chang, A. L. Page and F. T. Bingham, “Heavy Metal Absorption by Winter Wheat Following Termina- tion of Cropland Sludge Application,” Journal of Envi- ronmental Quality, Vol. 11, No. 4, 1982, pp. 705-708. doi:10.2134/jeq1982.00472425001100040030x [2] E. Witter and J. Lopez-Real, “Nitrogen Losses During Composting of Sewage Sludge and the Effectiveness of the Clay Soil, Zeolite and Composting the Volatilized Ammonia,” Biological Wastes, Vol. 23, No. 4, 1988, pp. 279-294. doi:10.1016/0269-7483(88)90016-X [3] S. R. Wild, M. L. Berrow and K. C. Jones, “The Persis- tence of Polynuclear Aromatic Hydrocarbons (Pahs) in Sewage Sludge Amended Agricultural Soils,” Environ- mental Pollution, Vol. 72, No. 2, 1991, pp. 141-157. doi:10.1016/0269-7491(91)90064-4 [4] S. R. Smith, “Effects of Sewage Sludge Application on Soil Microbial Processes and Soil Fertility,” In: B. A. Stewart, Ed., Advances in Soil Science, Springer-Verlag, New York, 1991, pp. 191-212. doi:10.1007/978-1-4612-3144-8_4 [5] B. J. Alloway and A. P. Jackson, “The Behavior of Heavy Metals in Sewage Sludge-Amended Soils,” Science of the Total Environment, Vol. 100, 1991, pp. 151-176. doi:10.1016/0048-9697(91)90377-Q [6] M. E. Mesquita, J.-M. Vieira, E. Silva and H. Domingues, “Copper Adsorption by a Schistic Soil. Application of Copyright © 2012 SciRes. OJSS 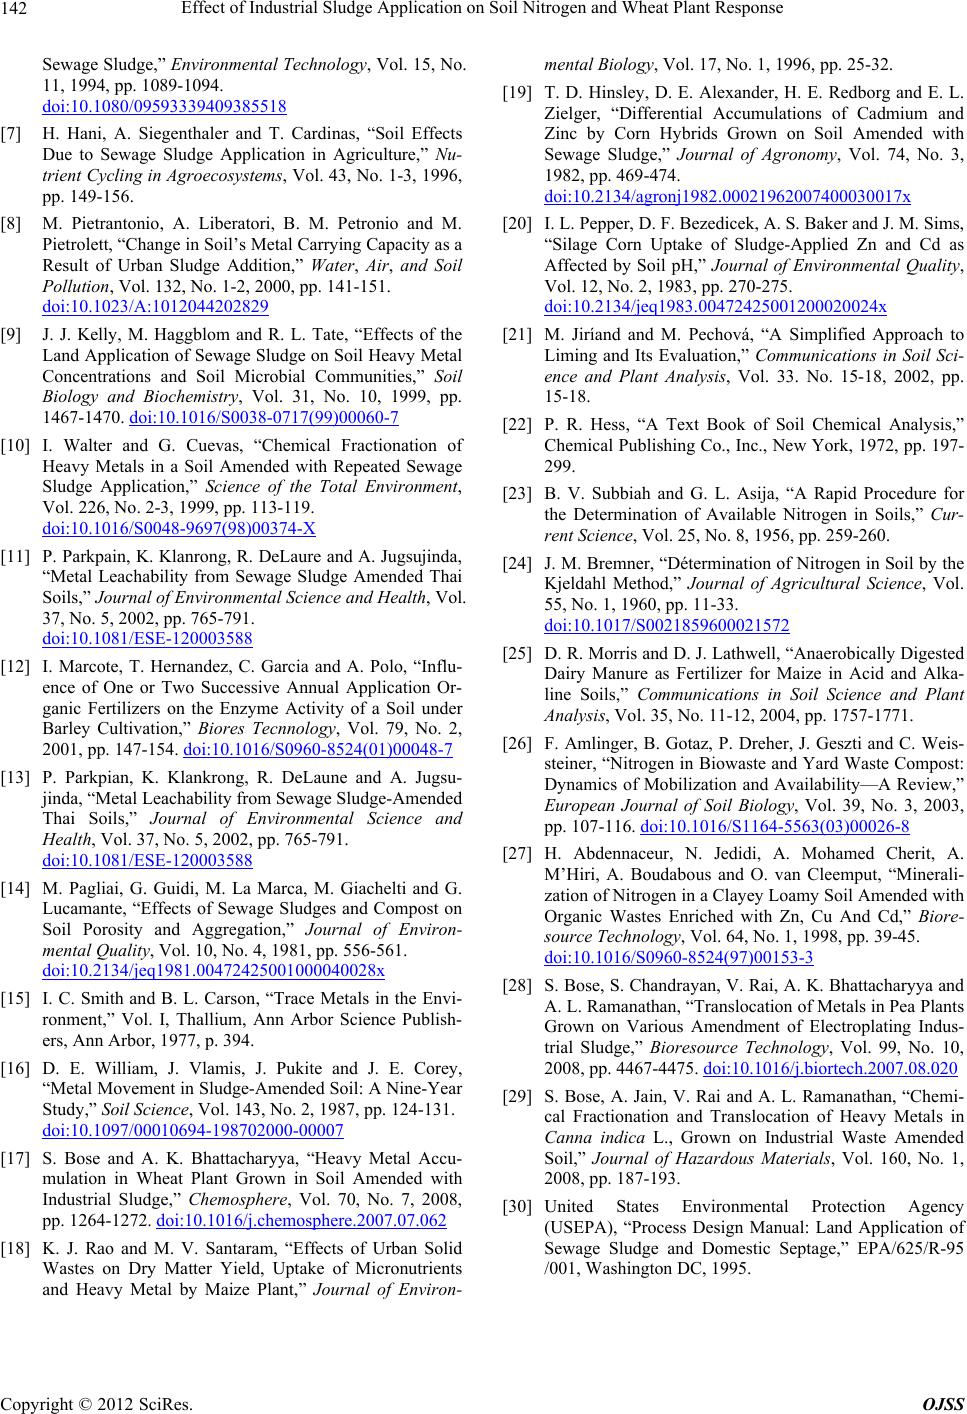 Effect of Industrial Sludge Application on Soil Nitrogen and Wheat Plant Response 142 Sewage Sludge,” Environmental Technology, Vol. 15, No. 11, 1994, pp. 1089-1094. doi:10.1080/09593339409385518 [7] H. Hani, A. Siegenthaler and T. Cardinas, “Soil Effects Due to Sewage Sludge Application in Agriculture,” Nu- trient Cycling in Agroecosystems, Vol. 43, No. 1-3, 1996, pp. 149-156. [8] M. Pietrantonio, A. Liberatori, B. M. Petronio and M. Pietrolett, “Change in Soil’s Metal Carrying Capacity as a Result of Urban Sludge Addition,” Water, Air, and Soil Pollution, Vol. 132, No. 1-2, 2000, pp. 141-151. doi:10.1023/A:1012044202829 [9] J. J. Kelly, M. Haggblom and R. L. Tate, “Effects of the Land Application of Sewage Sludge on Soil Heavy Metal Concentrations and Soil Microbial Communities,” Soil Biology and Biochemistry, Vol. 31, No. 10, 1999, pp. 1467-1470. doi:10.1016/S0038-0717(99)00060-7 [10] I. Walter and G. Cuevas, “Chemical Fractionation of Heavy Metals in a Soil Amended with Repeated Sewage Sludge Application,” Science of the Total Environment, Vol. 226, No. 2-3, 1999, pp. 113-119. doi:10.1016/S0048-9697(98)00374-X [11] P. Parkpain, K. Klanrong, R. DeLaure and A. Jugsujinda, “Metal Leachability from Sewage Sludge Amended Thai Soils,” Journal of Environmental Science and Health, Vol. 37, No. 5, 2002, pp. 765-791. doi:10.1081/ESE-120003588 [12] I. Marcote, T. Hernandez, C. Garcia and A. Polo, “Influ- ence of One or Two Successive Annual Application Or- ganic Fertilizers on the Enzyme Activity of a Soil under Barley Cultivation,” Biores Tecnnology, Vol. 79, No. 2, 2001, pp. 147-154. doi:10.1016/S0960-8524(01)00048-7 [13] P. Parkpian, K. Klankrong, R. DeLaune and A. Jugsu- jinda, “Metal Leachability from Sewage Sludge-Amended Thai Soils,” Journal of Environmental Science and Health, Vol. 37, No. 5, 2002, pp. 765-791. doi:10.1081/ESE-120003588 [14] M. Pagliai, G. Guidi, M. La Marca, M. Giachelti and G. Lucamante, “Effects of Sewage Sludges and Compost on Soil Porosity and Aggregation,” Journal of Environ- mental Quality, Vol. 10, No. 4, 1981, pp. 556-561. doi:10.2134/jeq1981.00472425001000040028x [15] I. C. Smith and B. L. Carson, “Trace Metals in the Envi- ronment,” Vol. I, Thallium, Ann Arbor Science Publish- ers, Ann Arbor, 1977, p. 394. [16] D. E. William, J. Vlamis, J. Pukite and J. E. Corey, “Metal Movement in Sludge-Amended Soil: A Nine-Year Study,” Soil Science, Vol. 143, No. 2, 1987, pp. 124-131. doi:10.1097/00010694-198702000-00007 [17] S. Bose and A. K. Bhattacharyya, “Heavy Metal Accu- mulation in Wheat Plant Grown in Soil Amended with Industrial Sludge,” Chemosphere, Vol. 70, No. 7, 2008, pp. 1264-1272. doi:10.1016/j.chemosphere.2007.07.062 [18] K. J. Rao and M. V. Santaram, “Effects of Urban Solid Wastes on Dry Matter Yield, Uptake of Micronutrients and Heavy Metal by Maize Plant,” Journal of Environ- mental Biology, Vol. 17, No. 1, 1996, pp. 25-32. [19] T. D. Hinsley, D. E. Alexander, H. E. Redborg and E. L. Zielger, “Differential Accumulations of Cadmium and Zinc by Corn Hybrids Grown on Soil Amended with Sewage Sludge,” Journal of Agronomy, Vol. 74, No. 3, 1982, pp. 469-474. doi:10.2134/agronj1982.00021962007400030017x [20] I. L. Pepper, D. F. Bezedicek, A. S. Baker and J. M. Sims, “Silage Corn Uptake of Sludge-Applied Zn and Cd as Affected by Soil pH,” Journal of Environmental Quality, Vol. 12, No. 2, 1983, pp. 270-275. doi:10.2134/jeq1983.00472425001200020024x [21] M. Jiríand and M. Pechová, “A Simplified Approach to Liming and Its Evaluation,” Communications in Soil Sci- ence and Plant Analysis, Vol. 33. No. 15-18, 2002, pp. 15-18. [22] P. R. Hess, “A Text Book of Soil Chemical Analysis,” Chemical Publishing Co., Inc., New York, 1972, pp. 197- 299. [23] B. V. Subbiah and G. L. Asija, “A Rapid Procedure for the Determination of Available Nitrogen in Soils,” Cur- rent Science, Vol. 25, No. 8, 1956, pp. 259-260. [24] J. M. Bremner, “Détermination of Nitrogen in Soil by the Kjeldahl Method,” Journal of Agricultural Science, Vol. 55, No. 1, 1960, pp. 11-33. doi:10.1017/S0021859600021572 [25] D. R. Morris and D. J. Lathwell, “Anaerobically Digested Dairy Manure as Fertilizer for Maize in Acid and Alka- line Soils,” Communications in Soil Science and Plant Analysis, Vol. 35, No. 11-12, 2004, pp. 1757-1771. [26] F. Amlinger, B. Gotaz, P. Dreher, J. Geszti and C. Weis- steiner, “Nitrogen in Biowaste and Yard Waste Compost: Dynamics of Mobilization and Availability—A Review,” European Journal of Soil Biology, Vol. 39, No. 3, 2003, pp. 107-116. doi:10.1016/S1164-5563(03)00026-8 [27] H. Abdennaceur, N. Jedidi, A. Mohamed Cherit, A. M’Hiri, A. Boudabous and O. van Cleemput, “Minerali- zation of Nitrogen in a Clayey Loamy Soil Amended with Organic Wastes Enriched with Zn, Cu And Cd,” Biore- source Technology, Vol. 64, No. 1, 1998, pp. 39-45. doi:10.1016/S0960-8524(97)00153-3 [28] S. Bose, S. Chandrayan, V. Rai, A. K. Bhattacharyy a and A. L. Ramanathan, “Translocation of Metals in Pea Plants Grown on Various Amendment of Electroplating Indus- trial Sludge,” Bioresource Technology, Vol. 99, No. 10, 2008, pp. 4467-4475. doi:10.1016/j.biortech.2007.08.020 [29] S. Bose, A. Jain, V. Rai and A. L. Ramanathan, “Chemi- cal Fractionation and Translocation of Heavy Metals in Canna indica L., Grown on Industrial Waste Amended Soil,” Journal of Hazardous Materials, Vol. 160, No. 1, 2008, pp. 187-193. [30] United States Environmental Protection Agency (USEPA), “Process Design Manual: Land Application of Sewage Sludge and Domestic Septage,” EPA/625/R-95 /001, Washington DC, 1995. Copyright © 2012 SciRes. OJSS  Effect of Industrial Sludge Application on Soil Nitrogen and Wheat Plant Response 143 Appendix The ANOVA results sh ow ed that there was no significant variation with shoot length with lime treatments but sig- nificant with waste treatments with growth periods (Ta- bles 3-4). There were significant variations of root length with growth periods vs. lime treatments (Tables 5-6). There were significant variations in shoot and root dry weight with lime treatment as well as waste treatments with time (Tables 7-10). Table 3. Two-factor ANOVA to test significance of difference in shoot length of wheat plants due to growth period vs. lime- treatment (0.05 level of significance). Sl Sample Type Diff. due to rows (lime treat.) Diff. due to columns (growth period) No. W.T. Types of soil F-value S/IP-value F-value S/I P-value 3.862548358 3.862548358 1 10 Chhattarpur 2.80089534 I 0.10085409 1.36952767 I 0.31327613 2 20 Chhattarpur 1.04325427 I 0.4194115 1.77487315 I 0.22174935 3 30 Chhattarpur 1.08555646 I 0.40359894 3.28148057 I 0.07247967 4 10 JNU 3.59780665 I 0.05900359 3.42628045 I 0.06589362 5 20 JNU 2.34824843 I 0.14068319 5.09836706 S 0.02473357 6 30 JNU 4.45204426 S0.03526918 16.2355516 S 0.00056451 [S = Significant, I = Insignificant, L.T = Lime Treatment, W.T = Waste Treatment]. Table 4. Two-factor ANOVA to test significance of difference in shoot length of wheat plants due to growth period vs. waste treatment (0.05 level of significance). Sl Sample Type Diff. due to rows (waste treat.) Diff. due to columns (growth period) No. L.T. Types of soil F-value S/IP-value F-value S/I P-value 5.14325285 4.757062664 1 0 Chhattarpur 2.90301471 I 0.13126295 4.06873986 S 0.06787549 2 0.5 Chhattarpur 2.23234569 I 0.18848399 2.15438156 I 0.19459993 3 1.0 Chhattarpur 0.64899014 I 0.55570678 1.1870683 I 0.39087041 4 0 JNU 2.40100834 I 0.17137175 2.20585797 I 0.188207 5 0.5 JNU 1.97041866 I 0.21987956 6.06722174 S 0.03006147 6 1.0 JNU 2.66796403 I 0.14827998 0.9644555 I 0.468265 Table 5. Two-factor ANOVA to test significance of difference in root length of wheat plants due to growth period vs. lime- treatment (0.05 level of significance). Sl Sample Type Diff. due to rows (lime treat.) Diff. due to columns (growth period) No. W.T. Types of soil F-value S/IP-value F-value S/I P-value 3.862548358 3.862548358 1 10 Chhattarpur 7.68367347 S0.00747719 3.64285714 I 0.05734072 2 20 Chhattarpur 11.1152263 S0.0022114 2.04526749 I 0.17805747 3 30 Chhattarpur 46.6595745 S8.2566E–06 14.3829787 S 0.00088341 4 10 JNU 5.97297297 S0.01592064 2.02702703 I 0.18066299 5 20 JNU 15 S0.00075721 8.3553719 S 0.00573319 6 30 JNU 92.2173913 S4.4661E–07 10.826087 S 0.00242189 Copyright © 2012 SciRes. OJSS  Effect of Industrial Sludge Application on Soil Nitrogen and Wheat Plant Response 144 Table 6. Two-factor ANOVA to test significance of difference in root length of wheat plants due to growth period vs. waste treatment (0.05 level of significance). Sl Sample Type Diff. due to rows (waste treat.) Diff. due to columns (growth period) No. L.T. Types of soil F-value S/IP-value F-value S/I P-value 5.14325285 4.757062664 1 0 Chhattarpur 2.95184591 I 0.12805859 0.70786517 I 0.58156322 2 0.5 Chhattarpur 30.9130435 S0.00069225 2.47826087 I 0.15858281 3 1.0 Chhattarpur 12.6521739 S0.00704109 3.83524027 I 0.07584365 4 0 JNU 30.1 S0.00074453 1.425 I 0.3249824 5 0.5 JNU 16.6470588 S0.00356017 3.82352941 I 0.07627518 6 1.0 JNU 16.0851064 S0.00388401 2.40425532 I 0.16598793 Table 7. Two-factor ANOVA to test significance of difference in dry wt of wheat plant’s shoot due to growth period vs. lime- treatment (0.05 level of significance). Sl Sample Type Diff. due to rows (lime treat.) Diff. due to columns (growth period) No. W .T. Types of soil F-value S/IP-value F-value S/I P-value 3.8625387 3.8625387 1 10 Chhattarpur 4.20874228 S0.04060626 621.723262 S 9.5143E–11 2 20 Chhattarpur 21.8091038 S0.00018257 632.987198 S 8.7795E–11 3 30 Chhattarpur 36.2245354 S2.3701E–05 440.704479 S 4.433E–10 4 10 JNU 27.8083333 S6.9627E–05 4693.825 S 1.0879E–14 5 20 JNU 45.5981364 S9.0945E–06 2163.11448 S 3.5401E–13 6 30 JNU 41.6209744 S1.3323E–05 947.602808 S 1.4397E–11 Table 8. Two-factor ANOVA to test significance of difference in dry wt of wheat plant’s shoot due to growth period vs. waste treatment (0.05 level of significance). Sl Sample Type Diff. due to rows (waste treat.) Diff. due to columns (growth period) No. L.T. Types of soil F-value S/IP-value F-value S/I P-value 5.1432494 4.7570552 1 0 Chhattarpur 29.2108183 S0.0008079 224.023777 S 1.5105E–06 2 0.5 Chhattarpur 163.399597 S5.8601E–06 1783.92552 S 3.0709E–09 3 1.0 Chhattarpur 34.4543499 S0.00051387 375.318959 S 3.2512E–07 4 0 JNU 18.6513872 S0.00266015 382.00769 S 3.0844E–07 5 0.5 JNU 18.8861997 S0.00257545 421.615483 S 2.298E–07 6 1.0 JNU 16.6040024 S0.00358368 319.740553 S 5.2421E–07 Table 9. Two-factor ANOVA to test significance of difference in dry wt of wheat plant’s root due to growth period vs. lime-treatment (0.05 level of significance). Sl Sample Type Diff. due to rows (lime treat.) Diff. due to columns (growth period) No. W.T. Types of soil F-value S/IP-value F-value S/I P-value 3.8625387 3.8625387 1 10 Chhattarpur 3.88824826 S0.04921775 109.643717 S 2.1007E–07 2 20 Chhattarpur 4.13899921 S0.04231368 118.920572 S 1.4725E–07 3 30 Chhattarpur 1.22792023 I 0.35508087 29.9721674 S 5.1446E–05 4 10 JNU 4.94354839 S0.02686225 213.58871 S 1.1143E–08 5 20 JNU 0.80088735 I 0.52403263 50.4266854 S 5.9525E–06 6 30 JNU 0.47305089 I 0.70860701 19.9606418 S 0.00025753 Copyright © 2012 SciRes. OJSS 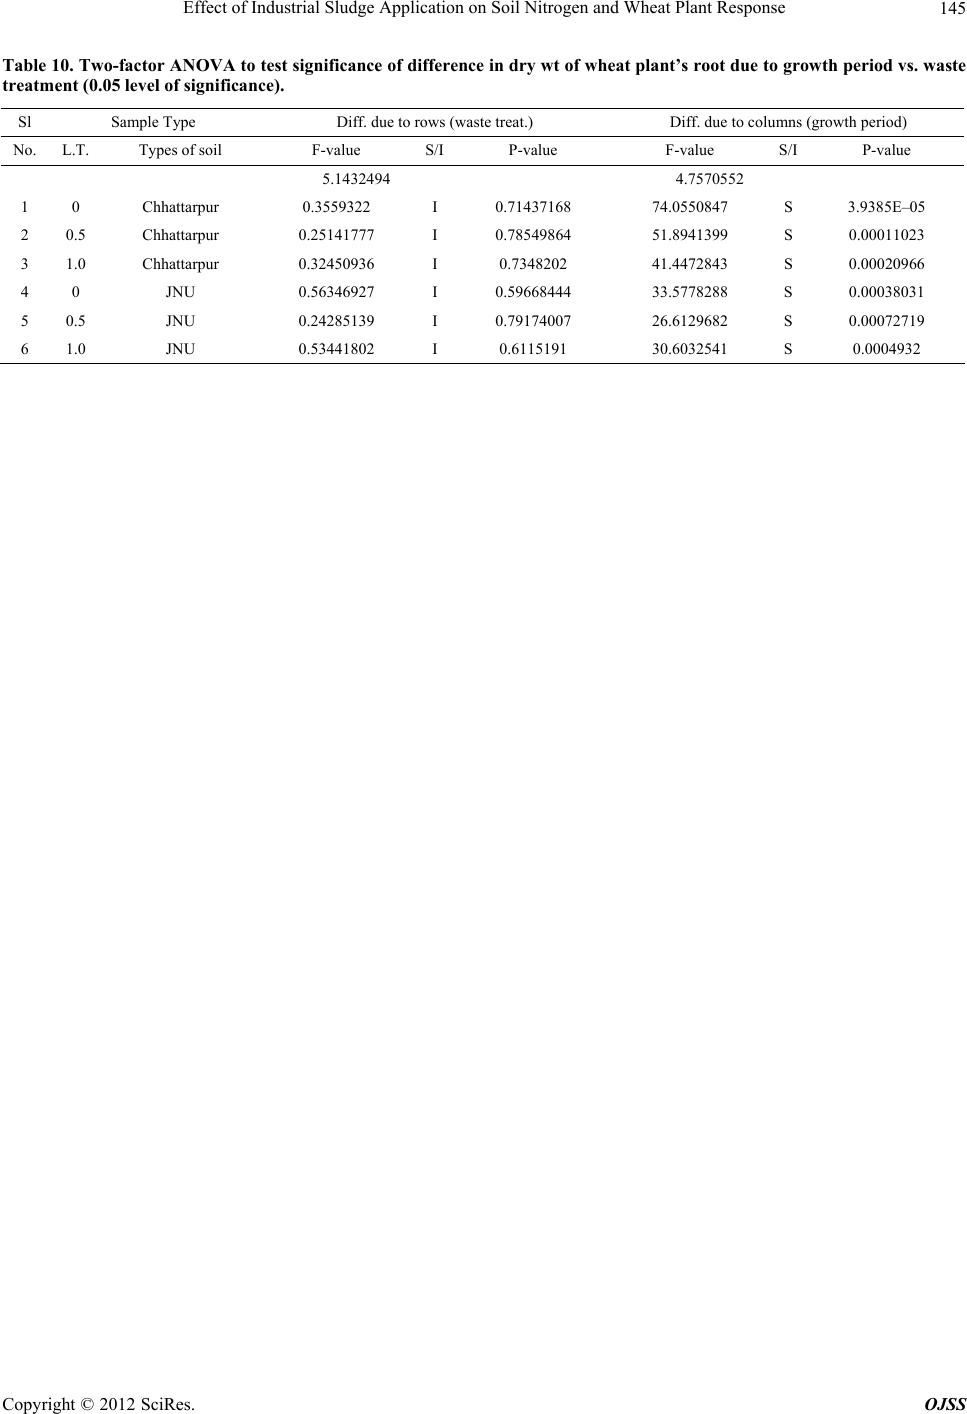 Effect of Industrial Sludge Application on Soil Nitrogen and Wheat Plant Response Copyright © 2012 SciRes. OJSS 145 Table 10. Two-factor ANOVA to test significance of difference in dry wt of wheat plant’s root due to growth period vs. waste treatment (0.05 level of significance). Sl Sample Type Diff. due to rows (waste treat.) Diff. due to columns (growth period) No. L.T. Types of soil F-value S/IP-value F-value S/I P-value 5.1432494 4.7570552 1 0 Chhattarpur 0.3559322 I 0.71437168 74.0550847 S 3.9385E–05 2 0.5 Chhattarpur 0.25141777 I 0.78549864 51.8941399 S 0.00011023 3 1.0 Chhattarpur 0.32450936 I 0.7348202 41.4472843 S 0.00020966 4 0 JNU 0.56346927 I 0.59668444 33.5778288 S 0.00038031 5 0.5 JNU 0.24285139 I 0.79174007 26.6129682 S 0.00072719 6 1.0 JNU 0.53441802 I 0.6115191 30.6032541 S 0.0004932 |