

Paper Menu >>
Journal Menu >>
 J. Biomedical Science and Engineering, 2010, 3, 543-549 doi:10.4236/jbise.2010.36076 Published Online June 2010 (http://www.SciRP.org/journal/jbise/ JBiSE ). Published Online June 2010 in SciRes. http://www.scirp.org/journal/jbise Immune reaction characteristics and the mechanism of anergy induced by recombinant enterotoxin a of Staphylococcus aureus Shang Wu1,2*, Renli Zhang1*, Dana Huang1, Yijie Geng1, Shitong Gao1, Xiaoheng Li1 Zhangli Hu2** 1Shenzhen Centre for Diseases Control and Prevention, Shenzhen, China; *They contributed equally to this work; 2College of Life Science, Shenzhen University, Shenzhen, China; **Corresponding Author. Email: [email protected] Received 30 November 2009; revised 5 January 2010; accepted 15 January 2010. ABSTRACT To study immune reactions and the mechanism of anergy induced by recombinant enterotoxin A (rSEA) of Staphylococcus aureus. The gene encoding SEA was cloned from standard strain of S. aureus and high efficiently expressed in E. coli. After immuniza- tion with purified rSEA, mice were examined for production of specific antibody, subtype of IgG, cyto- kine mRNA levels such as IFN-γ, IL-2 secretion and T-cell surface PD-1 expression. Results showed that high levels of specific antibodies were produced in two weeks of primary immunization shot. During this time, humoral immune reactions prevailed (IgG2a/ IgG1 < 1). During the early phase, Th1 type cytokine mRNA is expressed at a higher level than Th2 type, indicating cellular immune reaction prevailed. Splen- ocyte IFN-γ secretion was significantly decreased af- ter boosting immunization. The PD-1 expression was detected by a flow cytometry examination in the sur- face of T- lymphocytes which were induced by rSEA, and the expression of PD-1 molecules increased along with the number of boosting and the time after im- munization. Keywords: Staphylococcus Aureus; Enterotoxin A; Im- mune Respose 1. INTRODUCTION Superantigens are distinguished from ordinary antigens by the ability that activates multiple T-cell clones. A very small amount can very effectively initiate the activation of immune system. Thus, superantigens have been con- sidered to be widely applicable in tumor immune therapy. Their efficacy has also been considered superior to ex- ogenous cell factor. With the development of relevant theory, superantigens have attracted much attention of studies [1,2]. Earlier studies applied superantigens inde- pendently in anticancer therapy. Later, they were used after modification with targeted monoclonal antibody, or as an enhancer of tumor vaccine, or gene vaccine or in combination with other therapy. In the United States, a superantigen Fab-SEA has been tested for anti-cancer ability in phase I clinical studies. In China, superantigens have been used to promoted leukocytes [3,4]. Most currently known exogenous superantigens are toxins from bacteria. For example, the antigen studied in the currently report, enterotoxin A of Staphylococcus aureus, is one of these toxins. Superantigens that pro- duced by bacteria upon infection may cause shock, fever, dehydration, skin eruption, organ failure, even death. The pathogenesis is that toxin superantigens stimulate large number of T-cells to proliferate, induce the secre- tion of cytokines from T-cell and APC cell, which result in immune system disorder. Superantigens induced dis- ease may occur through several ways: 1) Superantigen is the directly cause of the disease, such as toxic shock and food intoxication. 2) Superantigen enhances the effect of the other infectious factors. 3) Superantigen induces autoimmune reaction by activating large number of T and B cells [5]. Up to date, there is no proof on the rela- tionship between superantigen and some disease. How- ever, the effects of superantigens in food intoxication, toxic shock and some infectious disease are very clear [6]. An understanding of the mechanism by which bacte- rial superantigens activate T-cell and pathogenesis is theoretical bases for the application of superantigens in cancer immunotherapy. To this end, we studied the hu- moral and cellular immune reactions to recombinant SEA protein (rSEA), explored the relationship between inhibitory lymphocyte receptors and anergy induced by rSEA. 2. EXPERIMENTS 2.1. Materials and Methods 2.1.1. Materials Staphylococcus aureus was provided by Shenzhen Cen- 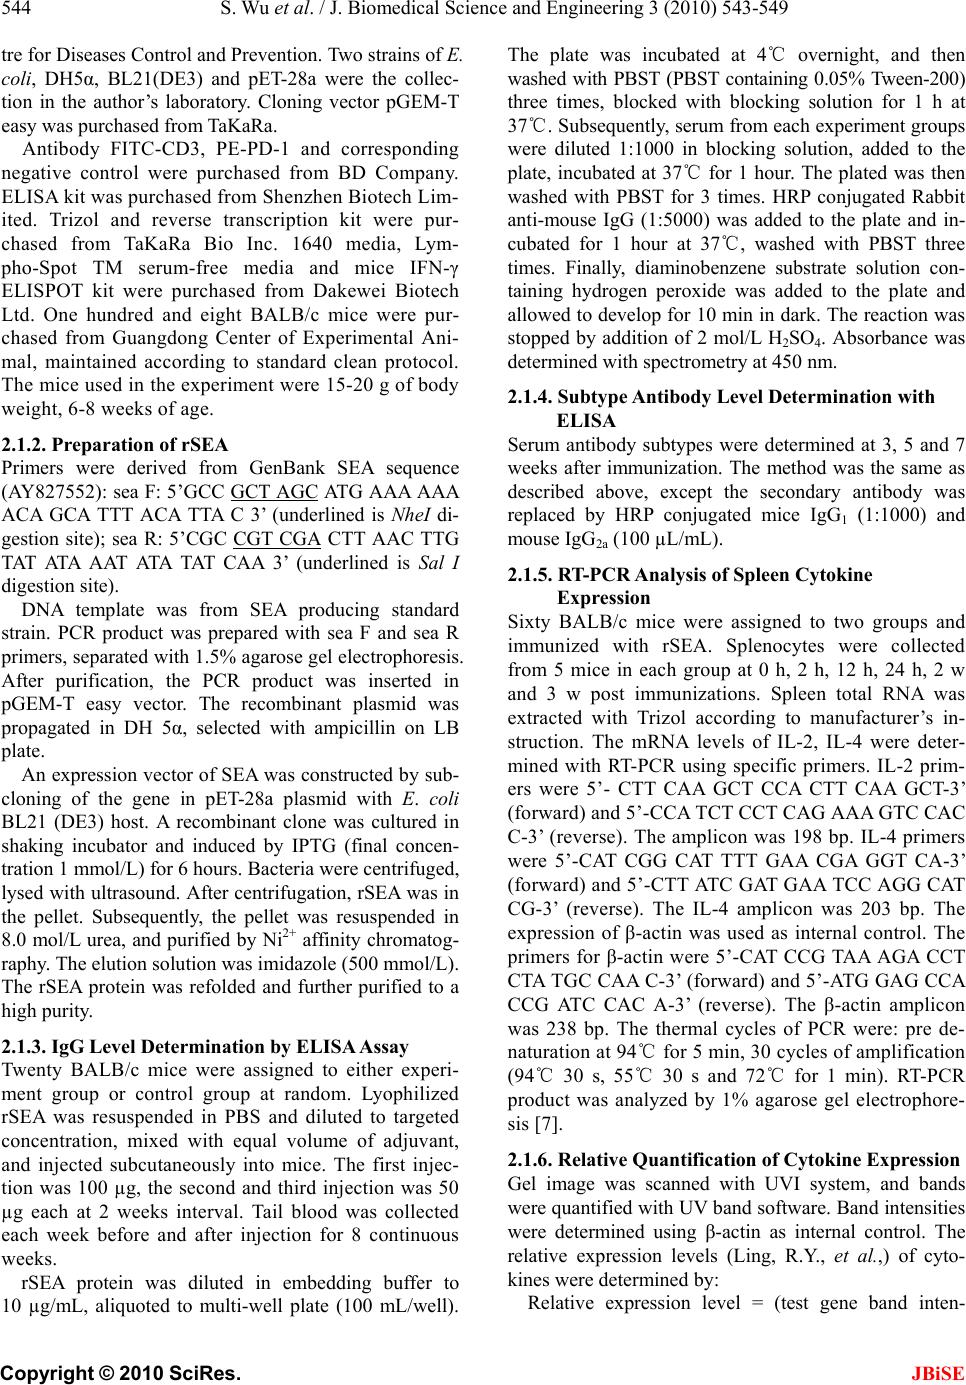 544 S. Wu et al. / J. Biomedical Science and Engineering 3 (2010) 543-549 Copyright © 2010 SciRes. JBiSE tre for Diseases Control and Prevention. Two strains of E. coli, DH5α, BL21(DE3) and pET-28a were the collec- tion in the author’s laboratory. Cloning vector pGEM-T easy was purchased from TaKaRa. Antibody FITC-CD3, PE-PD-1 and corresponding negative control were purchased from BD Company. ELISA kit was purchased from Shenzhen Biotech Lim- ited. Trizol and reverse transcription kit were pur- chased from TaKaRa Bio Inc. 1640 media, Lym- pho-Spot TM serum-free media and mice IFN-γ ELISPOT kit were purchased from Dakewei Biotech Ltd. One hundred and eight BALB/c mice were pur- chased from Guangdong Center of Experimental Ani- mal, maintained according to standard clean protocol. The mice used in the experiment were 15-20 g of body weight, 6-8 weeks of age. 2.1.2. Preparation of rSEA Primers were derived from GenBank SEA sequence (AY827552): sea F: 5’GCC GCT AGC ATG AAA AAA ACA GCA TTT ACA TTA C 3’ (underlined is NheI di- gestion site); sea R: 5’CGC CGT CGA CTT AAC TTG TAT ATA AAT ATA TAT CAA 3’ (underlined is Sal I digestion site). DNA template was from SEA producing standard strain. PCR product was prepared with sea F and sea R primers, separated with 1.5% agarose gel electrophoresis. After purification, the PCR product was inserted in pGEM-T easy vector. The recombinant plasmid was propagated in DH 5α, selected with ampicillin on LB plate. An expression vector of SEA was constructed by sub- cloning of the gene in pET-28a plasmid with E. coli BL21 (DE3) host. A recombinant clone was cultured in shaking incubator and induced by IPTG (final concen- tration 1 mmol/L) for 6 hours. Bacteria were centrifuged, lysed with ultrasound. After centrifugation, rSEA was in the pellet. Subsequently, the pellet was resuspended in 8.0 mol/L urea, and purified by Ni2+ affinity chromatog- raphy. The elution solution was imidazole (500 mmol/L). The rSEA protein was refolded and further purified to a high purity. 2.1.3. IgG Level Determination by ELISA Assay Twenty BALB/c mice were assigned to either experi- ment group or control group at random. Lyophilized rSEA was resuspended in PBS and diluted to targeted concentration, mixed with equal volume of adjuvant, and injected subcutaneously into mice. The first injec- tion was 100 µg, the second and third injection was 50 µg each at 2 weeks interval. Tail blood was collected each week before and after injection for 8 continuous weeks. rSEA protein was diluted in embedding buffer to 10 µg/mL, aliquoted to multi-well plate (100 mL/well). The plate was incubated at 4℃ overnight, and then washed with PBST (PBST containing 0.05% Tween-200) three times, blocked with blocking solution for 1 h at 37℃. Subsequently, serum from each experiment groups were diluted 1:1000 in blocking solution, added to the plate, incubated at 37℃ for 1 hour. The plated was then washed with PBST for 3 times. HRP conjugated Rabbit anti-mouse IgG (1:5000) was added to the plate and in- cubated for 1 hour at 37℃, washed with PBST three times. Finally, diaminobenzene substrate solution con- taining hydrogen peroxide was added to the plate and allowed to develop for 10 min in dark. The reaction was stopped by addition of 2 mol/L H2SO4. Absorbance was determined with spectrometry at 450 nm. 2.1.4. Subtype Antibody Level Determination with ELISA Serum antibody subtypes were determined at 3, 5 and 7 weeks after immunization. The method was the same as described above, except the secondary antibody was replaced by HRP conjugated mice IgG1 (1:1000) and mouse IgG2a (100 µL/mL). 2.1.5. RT-PCR Analysis of Spleen Cytokine Expression Sixty BALB/c mice were assigned to two groups and immunized with rSEA. Splenocytes were collected from 5 mice in each group at 0 h, 2 h, 12 h, 24 h, 2 w and 3 w post immunizations. Spleen total RNA was extracted with Trizol according to manufacturer’s in- struction. The mRNA levels of IL-2, IL-4 were deter- mined with RT-PCR using specific primers. IL-2 prim- ers were 5’- CTT CAA GCT CCA CTT CAA GCT-3’ (forward) and 5’-CCA TCT CCT CAG AAA GTC CAC C-3’ (reverse). The amplicon was 198 bp. IL-4 primers were 5’-CAT CGG CAT TTT GAA CGA GGT CA-3’ (forward) and 5’-CTT ATC GAT GAA TCC AGG CAT CG-3’ (reverse). The IL-4 amplicon was 203 bp. The expression of β-actin was used as internal control. The primers for β-actin were 5’-CAT CCG TAA AGA CCT CTA TGC CAA C-3’ (forward) and 5’-ATG GAG CCA CCG ATC CAC A-3’ (reverse). The β-actin amplicon was 238 bp. The thermal cycles of PCR were: pre de- naturation at 94℃ for 5 min, 30 cycles of amplification (94℃ 30 s, 55℃ 30 s and 72℃ for 1 min). RT-PCR product was analyzed by 1% agarose gel electrophore- sis [7]. 2.1.6. Relative Quantification of Cytokine Expression Gel image was scanned with UVI system, and bands were quantified with UV band software. Band intensities were determined using β-actin as internal control. The relative expression levels (Ling, R.Y., et al.,) of cyto- kines were determined by: Relative expression level = (test gene band inten- 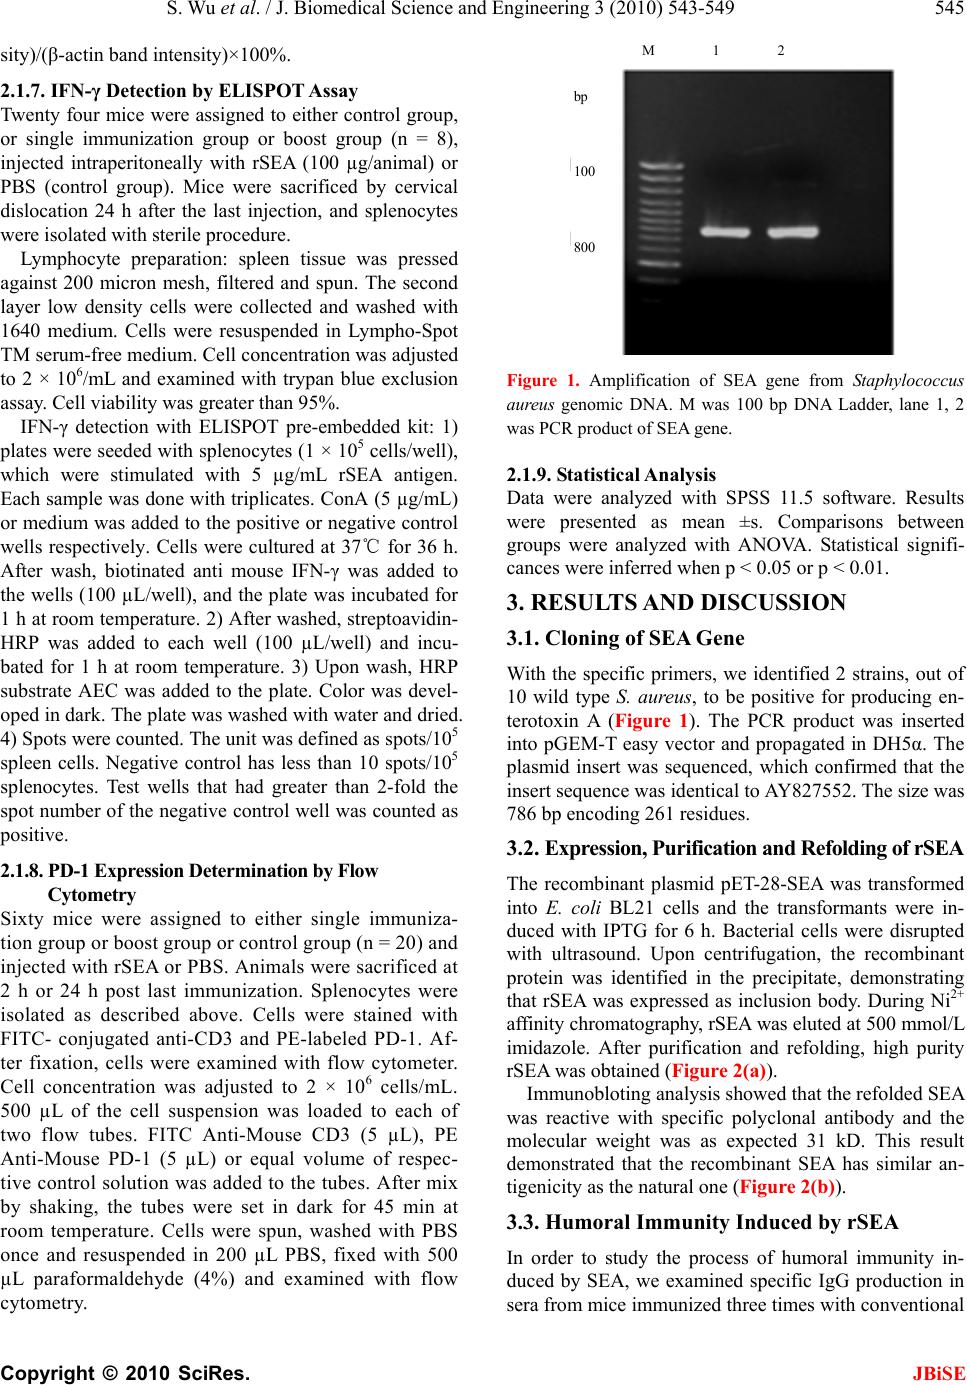 S. Wu et al. / J. Biomedical Science and Engineering 3 (2010) 543-549 545 Copyright © 2010 SciRes. JBiSE sity)/(β-actin band intensity)×100%. 2.1.7. IFN-γ Detection by ELISPOT Assay Twenty four mice were assigned to either control group, or single immunization group or boost group (n = 8), injected intraperitoneally with rSEA (100 µg/animal) or PBS (control group). Mice were sacrificed by cervical dislocation 24 h after the last injection, and splenocytes were isolated with sterile procedure. Lymphocyte preparation: spleen tissue was pressed against 200 micron mesh, filtered and spun. The second layer low density cells were collected and washed with 1640 medium. Cells were resuspended in Lympho-Spot TM serum-free medium. Cell concentration was adjusted to 2 × 10⁶/mL and examined with trypan blue exclusion assay. Cell viability was greater than 95%. IFN-γ detection with ELISPOT pre-embedded kit: 1) plates were seeded with splenocytes (1 × 10⁵ cells/well), which were stimulated with 5 µg/mL rSEA antigen. Each sample was done with triplicates. ConA (5 µg/mL) or medium was added to the positive or negative control wells respectively. Cells were cultured at 37℃ for 36 h. After wash, biotinated anti mouse IFN-γ was added to the wells (100 µL/well), and the plate was incubated for 1 h at room temperature. 2) After washed, streptoavidin- HRP was added to each well (100 µL/well) and incu- bated for 1 h at room temperature. 3) Upon wash, HRP substrate AEC was added to the plate. Color was devel- oped in dark. The plate was washed with water and dried. 4) Spots were counted. The unit was defined as spots/105 spleen cells. Negative control has less than 10 spots/105 splenocytes. Test wells that had greater than 2-fold the spot number of the negative control well was counted as positive. 2.1.8. PD-1 Expression Determination by Flow Cytometry Sixty mice were assigned to either single immuniza- tion group or boost group or control group (n = 20) and injected with rSEA or PBS. Animals were sacrificed at 2 h or 24 h post last immunization. Splenocytes were isolated as described above. Cells were stained with FITC- conjugated anti-CD3 and PE-labeled PD-1. Af- ter fixation, cells were examined with flow cytometer. Cell concentration was adjusted to 2 × 10⁶ cells/mL. 500 µL of the cell suspension was loaded to each of two flow tubes. FITC Anti-Mouse CD3 (5 µL), PE Anti-Mouse PD-1 (5 µL) or equal volume of respec- tive control solution was added to the tubes. After mix by shaking, the tubes were set in dark for 45 min at room temperature. Cells were spun, washed with PBS once and resuspended in 200 µL PBS, fixed with 500 µL paraformaldehyde (4%) and examined with flow cytometry. M 1 2 bp 100 800 Figure 1. Amplification of SEA gene from Staphylococcus aureus genomic DNA. M was 100 bp DNA Ladder, lane 1, 2 was PCR product of SEA gene. 2.1.9. Statistical Analysis Data were analyzed with SPSS 11.5 software. Results were presented as mean ±s. Comparisons between groups were analyzed with ANOVA. Statistical signifi- cances were inferred when p < 0.05 or p < 0.01. 3. RESULTS AND DISCUSSION 3.1. Cloning of SEA Gene With the specific primers, we identified 2 strains, out of 10 wild type S. aureus, to be positive for producing en- terotoxin A (Figure 1). The PCR product was inserted into pGEM-T easy vector and propagated in DH5α. The plasmid insert was sequenced, which confirmed that the insert sequence was identical to AY827552. The size was 786 bp encoding 261 residues. 3.2. Expression, Purification and Refolding of rSEA The recombinant plasmid pET-28-SEA was transformed into E. coli BL21 cells and the transformants were in- duced with IPTG for 6 h. Bacterial cells were disrupted with ultrasound. Upon centrifugation, the recombinant protein was identified in the precipitate, demonstrating that rSEA was expressed as inclusion body. During Ni2+ affinity chromatography, rSEA was eluted at 500 mmol/L imidazole. After purification and refolding, high purity rSEA was obtained (Figure 2(a)). Immunobloting analysis showed that the refolded SEA was reactive with specific polyclonal antibody and the molecular weight was as expected 31 kD. This result demonstrated that the recombinant SEA has similar an- tigenicity as the natural one (Figure 2(b)). 3.3. Humoral Immunity Induced by rSEA In order to study the process of humoral immunity in- duced by SEA, we examined specific IgG production in sera from mice immunized three times with conventional 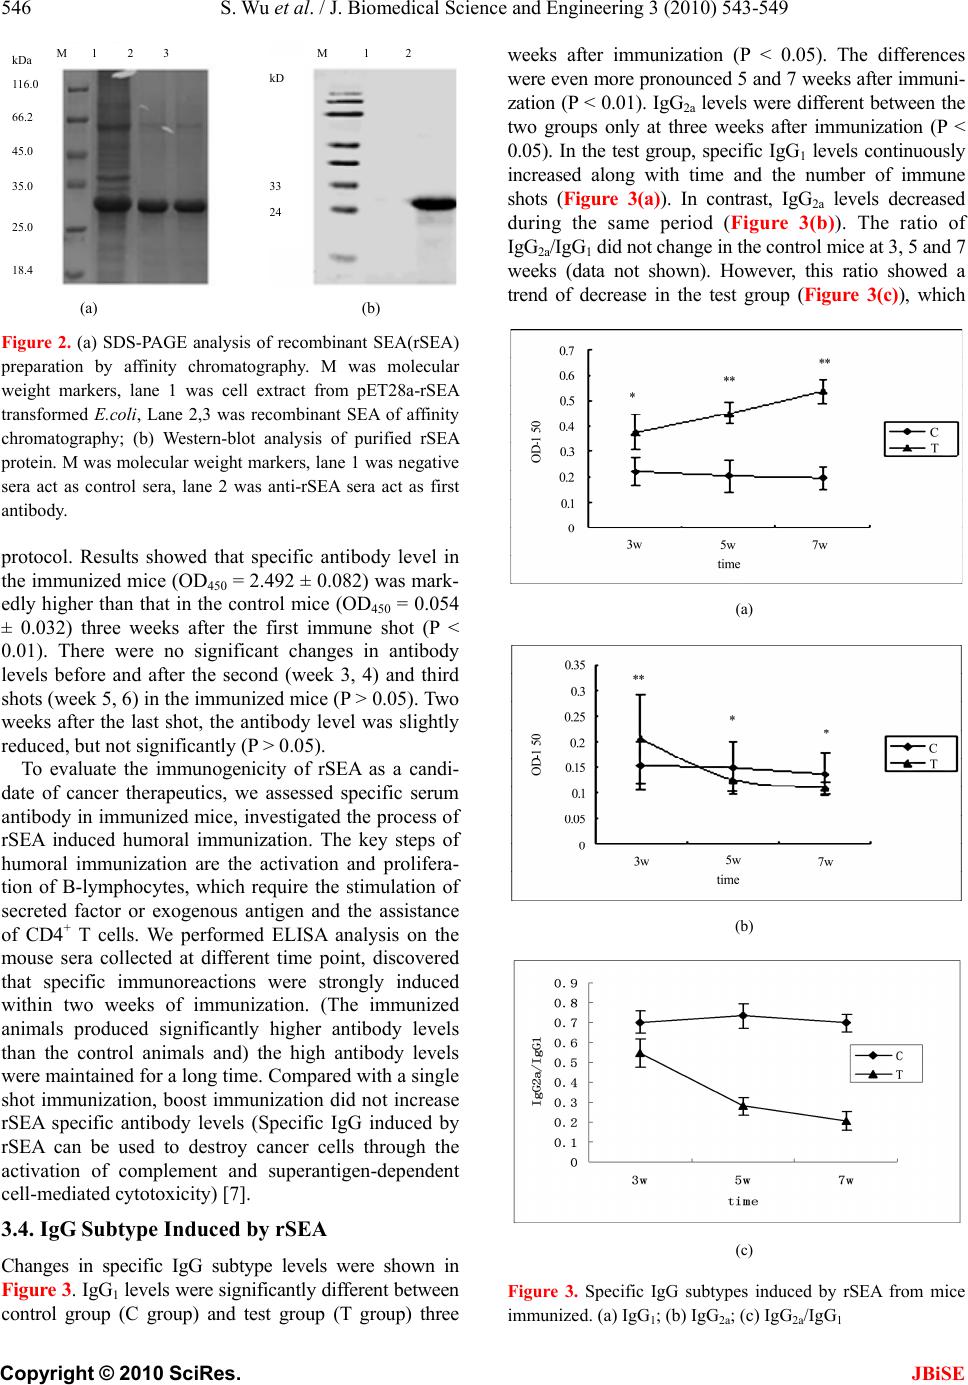 546 S. Wu et al. / J. Biomedical Science and Engineering 3 (2010) 543-549 Copyright © 2010 SciRes. JBiSE M 1 2 M 1 2 3 kD 33 24 kDa 116.0 66.2 45.0 35.0 25.0 18.4 (a) (b) Figure 2. (a) SDS-PAGE analysis of recombinant SEA(rSEA) preparation by affinity chromatography. M was molecular weight markers, lane 1 was cell extract from pET28a-rSEA transformed E.coli, Lane 2,3 was recombinant SEA of affinity chromatography; (b) Western-blot analysis of purified rSEA protein. M was molecular weight markers, lane 1 was negative sera act as control sera, lane 2 was anti-rSEA sera act as first antibody. protocol. Results showed that specific antibody level in the immunized mice (OD450 = 2.492 ± 0.082) was mark- edly higher than that in the control mice (OD450 = 0.054 ± 0.032) three weeks after the first immune shot (P < 0.01). There were no significant changes in antibody levels before and after the second (week 3, 4) and third shots (week 5, 6) in the immunized mice (P > 0.05). Two weeks after the last shot, the antibody level was slightly reduced, but not significantly (P > 0.05). To evaluate the immunogenicity of rSEA as a candi- date of cancer therapeutics, we assessed specific serum antibody in immunized mice, investigated the process of rSEA induced humoral immunization. The key steps of humoral immunization are the activation and prolifera- tion of B-lymphocytes, which require the stimulation of secreted factor or exogenous antigen and the assistance of CD4+ T cells. We performed ELISA analysis on the mouse sera collected at different time point, discovered that specific immunoreactions were strongly induced within two weeks of immunization. (The immunized animals produced significantly higher antibody levels than the control animals and) the high antibody levels were maintained for a long time. Compared with a single shot immunization, boost immunization did not increase rSEA specific antibody levels (Specific IgG induced by rSEA can be used to destroy cancer cells through the activation of complement and superantigen-dependent cell-mediated cytotoxicity) [7]. 3.4. IgG Subtype Induced by rSEA Changes in specific IgG subtype levels were shown in Figure 3. IgG1 levels were significantly different between control group (C group) and test group (T group) three weeks after immunization (P < 0.05). The differences were even more pronounced 5 and 7 weeks after immuni- zation (P < 0.01). IgG2a levels were different between the two groups only at three weeks after immunization (P < 0.05). In the test group, specific IgG1 levels continuously increased along with time and the number of immune shots (Figure 3(a)). In contrast, IgG2a levels decreased during the same period (Figure 3(b)). The ratio of IgG2a/IgG1 did not change in the control mice at 3, 5 and 7 weeks (data not shown). However, this ratio showed a trend of decrease in the test group (Figure 3(c)), which (a) (b) (c) Figure 3. Specific IgG subtypes induced by rSEA from mice immunized. (a) IgG1; (b) IgG2a; (c) IgG2a/IgG1 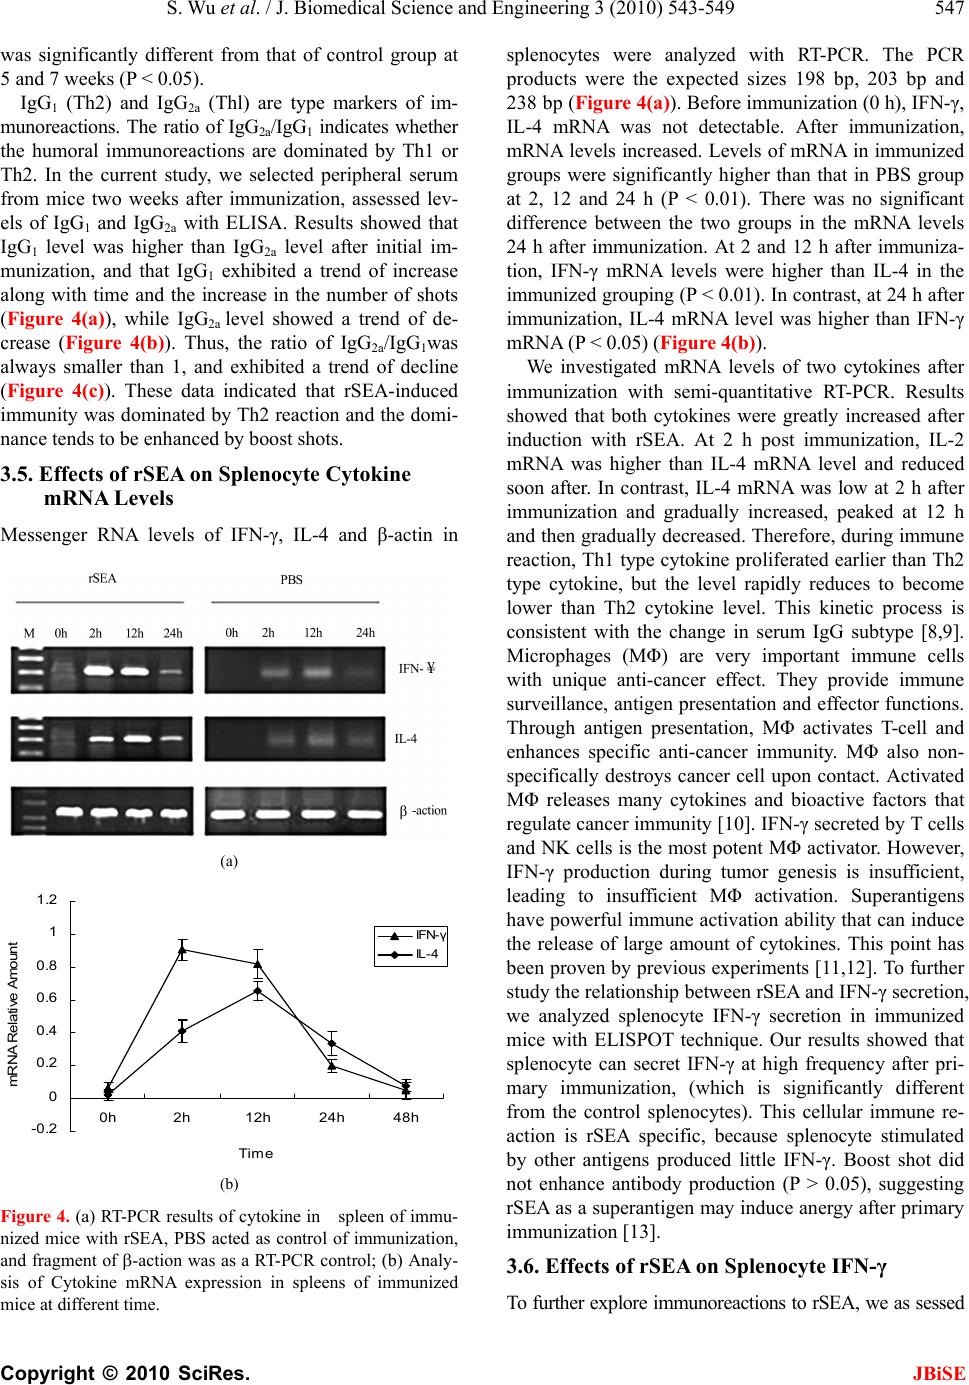 S. Wu et al. / J. Biomedical Science and Engineering 3 (2010) 543-549 547 Copyright © 2010 SciRes. JBiSE was significantly different from that of control group at 5 and 7 weeks (P < 0.05). IgG1 (Th2) and IgG2a (Thl) are type markers of im- munoreactions. The ratio of IgG2a/IgG1 indicates whether the humoral immunoreactions are dominated by Th1 or Th2. In the current study, we selected peripheral serum from mice two weeks after immunization, assessed lev- els of IgG1 and IgG2a with ELISA. Results showed that IgG1 level was higher than IgG2a level after initial im- munization, and that IgG1 exhibited a trend of increase along with time and the increase in the number of shots (Figure 4(a)), while IgG2a level showed a trend of de- crease (Figure 4(b)). Thus, the ratio of IgG2a/IgG1was always smaller than 1, and exhibited a trend of decline (Figure 4(c)). These data indicated that rSEA-induced immunity was dominated by Th2 reaction and the domi- nance tends to be enhanced by boost shots. 3.5. Effects of rSEA on Splenocyte Cytokine mRNA Levels Messenger RNA levels of IFN-γ, IL-4 and β-actin in ¥ β (a) -0.2 0 0.2 0.4 0.6 0.8 1 1.2 0h2h12h 24h 48h Ti me mRNA Relative Amount IFN- γ IL- 4 (b) Figure 4. (a) RT-PCR results of cytokine in spleen of immu- nized mice with rSEA, PBS acted as control of immunization, and fragment of -action was as a RT-PCR control; (b) Analy- sis of Cytokine mRNA expression in spleens of immunized mice at different time. splenocytes were analyzed with RT-PCR. The PCR products were the expected sizes 198 bp, 203 bp and 238 bp (Figure 4(a)). Before immunization (0 h), IFN-γ, IL-4 mRNA was not detectable. After immunization, mRNA levels increased. Levels of mRNA in immunized groups were significantly higher than that in PBS group at 2, 12 and 24 h (P < 0.01). There was no significant difference between the two groups in the mRNA levels 24 h after immunization. At 2 and 12 h after immuniza- tion, IFN-γ mRNA levels were higher than IL-4 in the immunized grouping (P < 0.01). In contrast, at 24 h after immunization, IL-4 mRNA level was higher than IFN-γ mRNA (P < 0.05) (Figure 4(b)). We investigated mRNA levels of two cytokines after immunization with semi-quantitative RT-PCR. Results showed that both cytokines were greatly increased after induction with rSEA. At 2 h post immunization, IL-2 mRNA was higher than IL-4 mRNA level and reduced soon after. In contrast, IL-4 mRNA was low at 2 h after immunization and gradually increased, peaked at 12 h and then gradually decreased. Therefore, during immune reaction, Th1 type cytokine proliferated earlier than Th2 type cytokine, but the level rapidly reduces to become lower than Th2 cytokine level. This kinetic process is consistent with the change in serum IgG subtype [8,9]. Microphages (MΦ) are very important immune cells with unique anti-cancer effect. They provide immune surveillance, antigen presentation and effector functions. Through antigen presentation, MΦ activates T-cell and enhances specific anti-cancer immunity. MΦ also non- specifically destroys cancer cell upon contact. Activated MΦ releases many cytokines and bioactive factors that regulate cancer immunity [10]. IFN-γ secreted by T cells and NK cells is the most potent MΦ activator. However, IFN-γ production during tumor genesis is insufficient, leading to insufficient MΦ activation. Superantigens have powerful immune activation ability that can induce the release of large amount of cytokines. This point has been proven by previous experiments [11,12]. To further study the relationship between rSEA and IFN-γ secretion, we analyzed splenocyte IFN-γ secretion in immunized mice with ELISPOT technique. Our results showed that splenocyte can secret IFN-γ at high frequency after pri- mary immunization, (which is significantly different from the control splenocytes). This cellular immune re- action is rSEA specific, because splenocyte stimulated by other antigens produced little IFN-γ. Boost shot did not enhance antibody production (P > 0.05), suggesting rSEA as a superantigen may induce anergy after primary immunization [13]. 3.6. Effects of rSEA on Splenocyte IFN-γ To further explore immunoreactions to rSEA, we as sessed 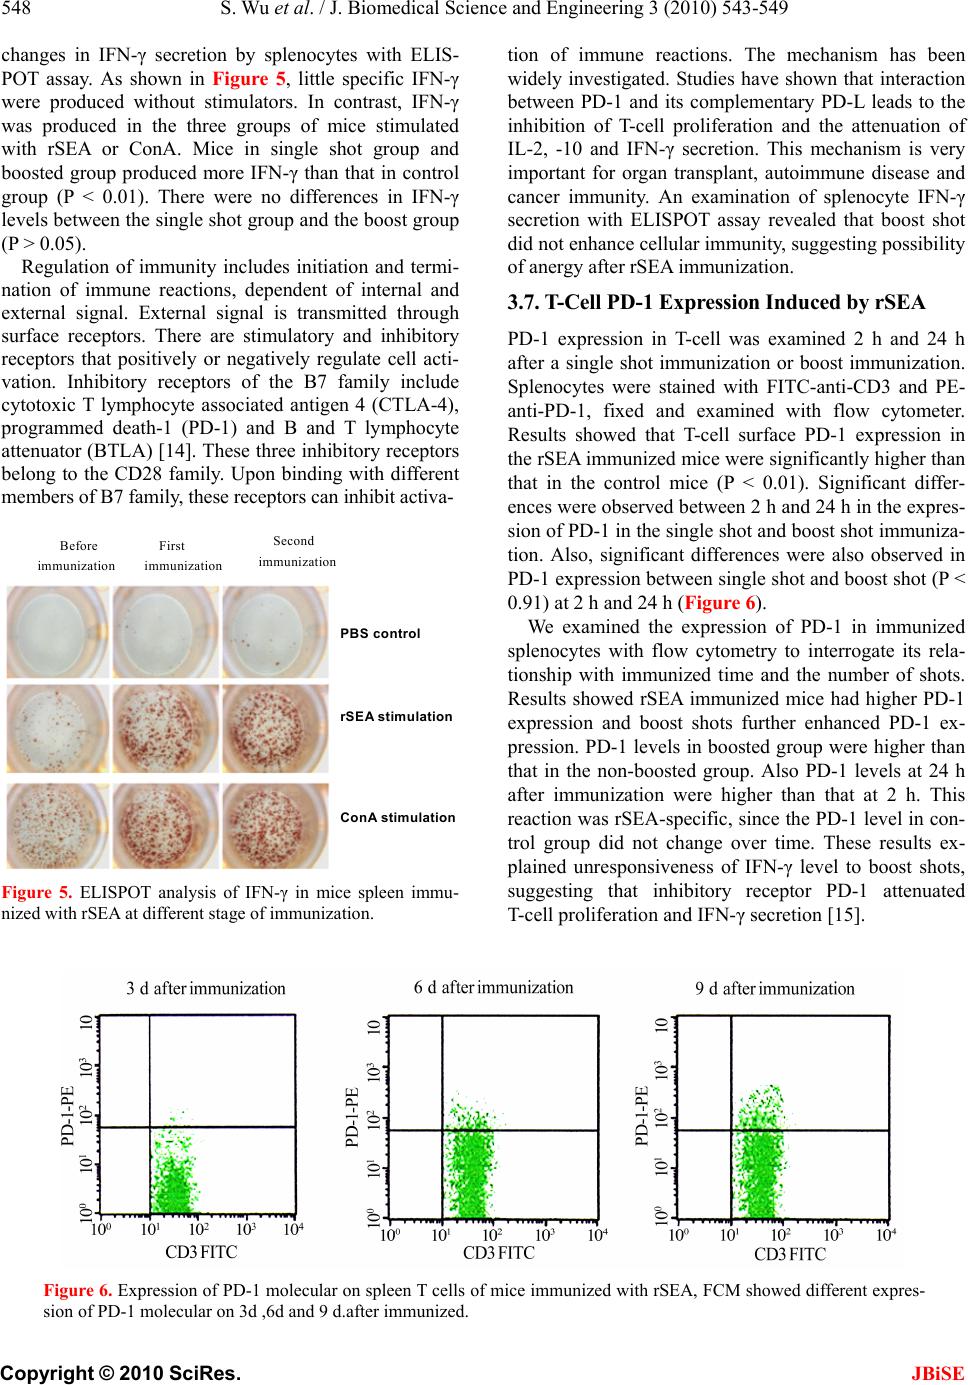 548 S. Wu et al. / J. Biomedical Science and Engineering 3 (2010) 543-549 Copyright © 2010 SciRes. changes in IFN-γ secretion by splenocytes with ELIS- POT assay. As shown in Figure 5, little specific IFN-γ were produced without stimulators. In contrast, IFN-γ was produced in the three groups of mice stimulated with rSEA or ConA. Mice in single shot group and boosted group produced more IFN-γ than that in control group (P < 0.01). There were no differences in IFN-γ levels between the single shot group and the boost group (P > 0.05). tion of immune reactions. The mechanism has been widely investigated. Studies have shown that interaction between PD-1 and its complementary PD-L leads to the inhibition of T-cell proliferation and the attenuation of IL-2, -10 and IFN-γ secretion. This mechanism is very important for organ transplant, autoimmune disease and cancer immunity. An examination of splenocyte IFN-γ secretion with ELISPOT assay revealed that boost shot did not enhance cellular immunity, suggesting possibility of anergy after rSEA immunization. Regulation of immunity includes initiation and termi- nation of immune reactions, dependent of internal and external signal. External signal is transmitted through surface receptors. There are stimulatory and inhibitory receptors that positively or negatively regulate cell acti- vation. Inhibitory receptors of the B7 family include cytotoxic T lymphocyte associated antigen 4 (CTLA-4), programmed death-1 (PD-1) and B and T lymphocyte attenuator (BTLA) [14]. These three inhibitory receptors belong to the CD28 family. Upon binding with different members of B7 family, these receptors can inhibit activa- 3.7. T-Cell PD-1 Expression Induced by rSEA PD-1 expression in T-cell was examined 2 h and 24 h after a single shot immunization or boost immunization. Splenocytes were stained with FITC-anti-CD3 and PE- anti-PD-1, fixed and examined with flow cytometer. Results showed that T-cell surface PD-1 expression in the rSEA immunized mice were significantly higher than that in the control mice (P < 0.01). Significant differ- ences were observed between 2 h and 24 h in the expres- sion of PD-1 in the single shot and boost shot immuniza- tion. Also, significant differences were also observed in PD-1 expression between single shot and boost shot (P < 0.91) at 2 h and 24 h (Figure 6). PBS control rSEA stimulation ConA stimulation First immunization Before immunization Second immunization We examined the expression of PD-1 in immunized splenocytes with flow cytometry to interrogate its rela- tionship with immunized time and the number of shots. Results showed rSEA immunized mice had higher PD-1 expression and boost shots further enhanced PD-1 ex- pression. PD-1 levels in boosted group were higher than that in the non-boosted group. Also PD-1 levels at 24 h after immunization were higher than that at 2 h. This reaction was rSEA-specific, since the PD-1 level in con- trol group did not change over time. These results ex- plained unresponsiveness of IFN-γ level to boost shots, suggesting that inhibitory receptor PD-1 attenuated T-cell proliferation and IFN-γ secretion [15]. Figure 5. ELISPOT analysis of IFN-γ in mice spleen immu- nized with rSEA at different stage of immunization. Figure 6. Expression of PD-1 molecular on spleen T cells of mice immunized with rSEA, FCM showed different expres- sion of PD-1 molecular on 3d ,6d and 9 d.after immunized. JBiSE 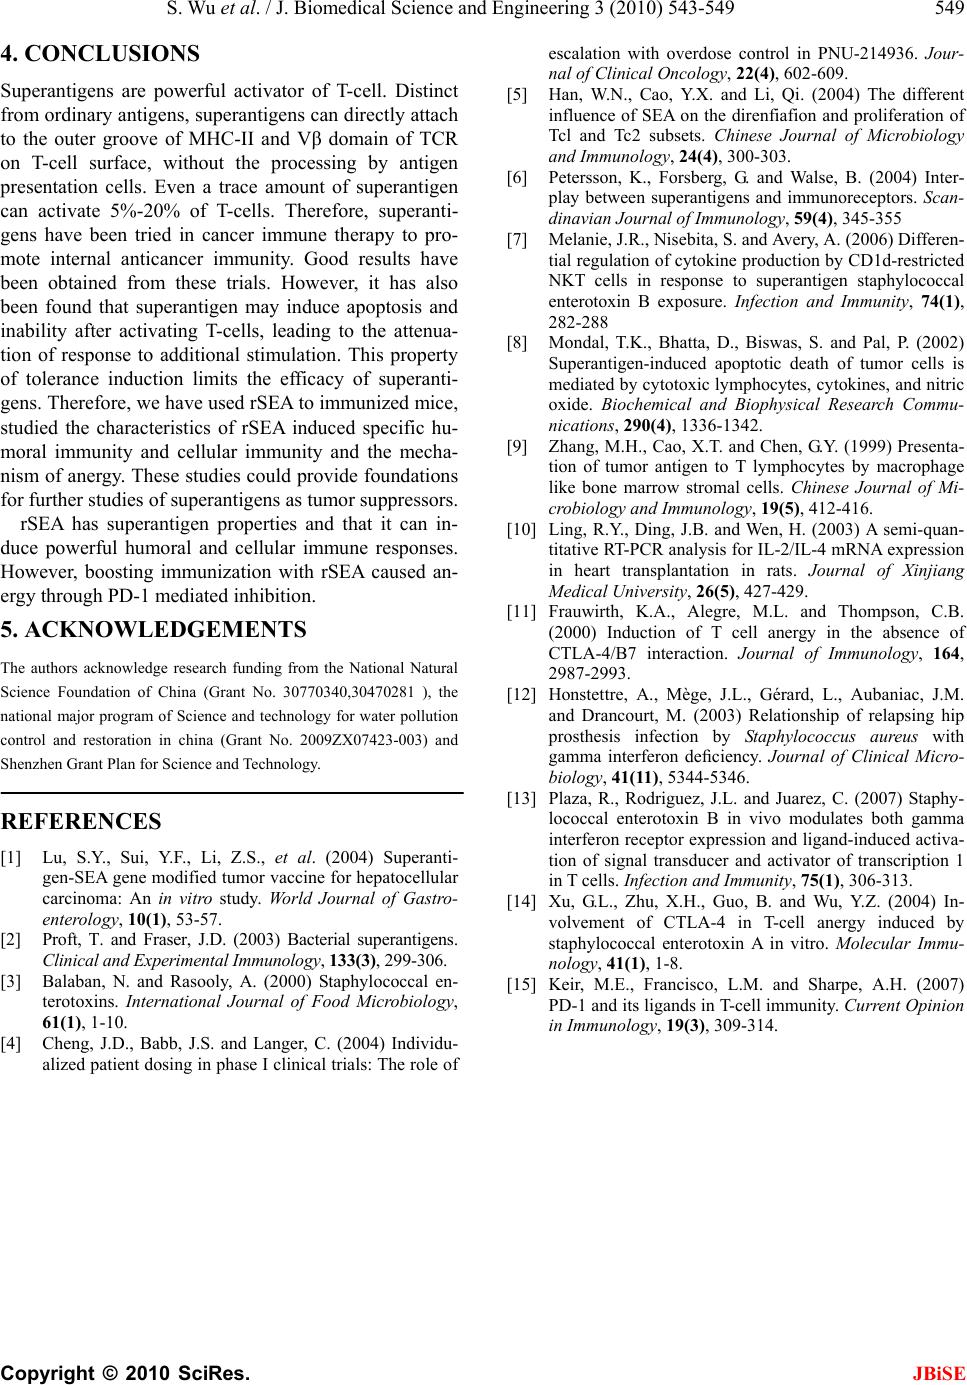 S. Wu et al. / J. Biomedical Science and Engineering 3 (2010) 543-549 549 Copyright © 2010 SciRes. JBiSE 4. CONCLUSIONS Superantigens are powerful activator of T-cell. Distinct from ordinary antigens, superantigens can directly attach to the outer groove of MHC-II and Vβ domain of TCR on T-cell surface, without the processing by antigen presentation cells. Even a trace amount of superantigen can activate 5%-20% of T-cells. Therefore, superanti- gens have been tried in cancer immune therapy to pro- mote internal anticancer immunity. Good results have been obtained from these trials. However, it has also been found that superantigen may induce apoptosis and inability after activating T-cells, leading to the attenua- tion of response to additional stimulation. This property of tolerance induction limits the efficacy of superanti- gens. Therefore, we have used rSEA to immunized mice, studied the characteristics of rSEA induced specific hu- moral immunity and cellular immunity and the mecha- nism of anergy. These studies could provide foundations for further studies of superantigens as tumor suppressors. rSEA has superantigen properties and that it can in- duce powerful humoral and cellular immune responses. However, boosting immunization with rSEA caused an- ergy through PD-1 mediated inhibition. 5. ACKNOWLEDGEMENTS The authors acknowledge research funding from the National Natural Science Foundation of China (Grant No. 30770340,30470281 ), the national major program of Science and technology for water pollution control and restoration in china (Grant No. 2009ZX07423-003) and Shenzhen Grant Plan for Science and Technology. REFERENCES [1] Lu, S.Y., Sui, Y.F., Li, Z.S., et al. (2004) Superanti- gen-SEA gene modified tumor vaccine for hepatocellular carcinoma: An in vitro study. World Journal of Gastro- enterology, 10(1), 53-57. [2] Proft, T. and Fraser, J.D. (2003) Bacterial superantigens. Clinical and Experimental Immunology, 133(3), 299-306. [3] Balaban, N. and Rasooly, A. (2000) Staphylococcal en- terotoxins. International Journal of Food Microbiology, 61(1), 1-10. [4] Cheng, J.D., Babb, J.S. and Langer, C. (2004) Individu- alized patient dosing in phase I clinical trials: The role of escalation with overdose control in PNU-214936. Jour- nal of Clinical Oncology, 22(4), 602-609. [5] Han, W.N., Cao, Y.X. and Li, Qi. (2004) The different influence of SEA on the direnfiafion and proliferation of Tcl and Tc2 subsets. Chinese Journal of Microbiology and Immunology, 24(4), 300-303. [6] Petersson, K., Forsberg, G. and Walse, B. (2004) Inter- play between superantigens and immunoreceptors. Scan- dinavian Journal of Immunology, 59(4), 345-355 [7] Melanie, J.R., Nisebita, S. and Avery, A. (2006) Differen- tial regulation of cytokine production by CD1d-restricted NKT cells in response to superantigen staphylococcal enterotoxin B exposure. Infection and Immunity, 74(1), 282-288 [8] Mondal, T.K., Bhatta, D., Biswas, S. and Pal, P. (2002) Superantigen-induced apoptotic death of tumor cells is mediated by cytotoxic lymphocytes, cytokines, and nitric oxide. Biochemical and Biophysical Research Commu- nications, 290(4), 1336-1342. [9] Zhang, M.H., Cao, X.T. and Chen, G.Y. (1999) Presenta- tion of tumor antigen to T lymphocytes by macrophage like bone marrow stromal cells. Chinese Journal of Mi- crobiology and Immunology, 19(5), 412-416. [10] Ling, R.Y., Ding, J.B. and Wen, H. (2003) A semi-quan- titative RT-PCR analysis for IL-2/IL-4 mRNA expression in heart transplantation in rats. Journal of Xinjiang Medical University, 26(5), 427-429. [11] Frauwirth, K.A., Alegre, M.L. and Thompson, C.B. (2000) Induction of T cell anergy in the absence of CTLA-4/B7 interaction. Journal of Immunology, 164, 2987-2993. [12] Honstettre, A., Mège, J.L., Gérard, L., Aubaniac, J.M. and Drancourt, M. (2003) Relationship of relapsing hip prosthesis infection by Staphylococcus aureus with gamma interferon deficiency. Journal of Clinical Micro- biology, 41(11), 5344-5346. [13] Plaza, R., Rodriguez, J.L. and Juarez, C. (2007) Staphy- lococcal enterotoxin B in vivo modulates both gamma interferon receptor expression and ligand-induced activa- tion of signal transducer and activator of transcription 1 in T cells. Infection and Immunity, 75(1), 306-313. [14] Xu, G.L., Zhu, X.H., Guo, B. and Wu, Y.Z. (2004) In- volvement of CTLA-4 in T-cell anergy induced by staphylococcal enterotoxin A in vitro. Molecular Immu- nology, 41(1), 1-8. [15] Keir, M.E., Francisco, L.M. and Sharpe, A.H. (2007) PD-1 and its ligands in T-cell immunity. Current Opinion in Immunology, 19(3), 309-314. |