

Paper Menu >>
Journal Menu >>
 Creative Education 2012. Vol.3, No.3, 328-333 Published Online June 2012 in SciRes (http://www.SciRP.org/journal/ce) http://dx.doi.org/10.4236/ce.2012.33052 Copyright © 2012 SciRe s . 328 The Moderating Effects of Item Order Arranged by Difficulty on the Relationship between Test Anxiety and Test Performance* Huilin Chen College of International Education, Shanghai International Studies University, Shanghai, C hina Email: chlm ai lbo [email protected] Received March 15th, 2012; revised April 10th, 2012; accepted April 29th, 2012 Taking cultural knowledge tests as the case study, this research carries out a series of empirical investiga- tions to verify the moderating effects of item order arranged by difficulty on the relationship between test anxiety and test performance. Groups classified according to test anxiety take tests with two major types of item order: item order arranged according to item bank calibrated item difficulty and item order ad- justed according to individual examinee’s perceived item difficulty. The means of those test results are compared between groups to see whether the differences are significant. The investigations obtain the following findings: the higher the test taker’s level of test anxiety, the higher significance of the modera- ting effects and vice versa; item order adjusted according to individual examinee’s perceived item diffi- culty may have a more significant moderating effect than item order arranged according to item bank calibrated item difficulty has. Keywords: Test Anxiety; Item Order; Item Bank Calibrated Item Difficulty; Individual Examinee’s Perceived Item Difficulty Introduction Test anxiety is an important research topic in the fields of educational and psychological measurement. Previous resear- ches focused on the overall effect of test anxiety on test per- formance (Kunnan, 1995; Gao, 2008) and paid little attention to the moderating effects of third-party variables on the relation- ship between test anxiety and test performance. This research aims at exploring the moderating effects of item order arranged by difficulty on the relationship between test anxiety and test performance. Test Anxiety, Item Order and Test Performance Test anxiety is defined as the anxiety subjectively relating to taking tests and exams, including anxiety related to the threat of failing an exam and the associated negative consequences such as psychological hyperarousal, negative thought patterns, a desire to escape from or avoid evaluative situations, inadequate performance on a test or other evaluation and difficulty in fo- cusing on the task at hand, regardless of whether the fears were realistic (Sarason, 1984: p. 930; Pekrun et al., 2004: p. 290; Hop- ko, Hunt, & Armento, 2005: pp. 389-408). Although the relation- ship between test anxiety and test performance is the focus of previous researches, no consensus has been reached. Many hold that the Yerkes-Dodson law can be applied to test anxiety and believe in that the relationship can be described in an inverted U shape curve. According to the Yerkesd-Dodson law, moder- ate level of anxiety can lead to optimal performance of certain tasks; nevertheless, performance can deteriorate when anxiety is too high or low. However, others hold that the relationship can be regarded as monotonically negative or even linear. That is, as test anxiety increases, performance is expected to de- crease (Rocklin & Thompson, 1985; Bodas & Ollendick, 2005). The relationship between item order and test performance is also an interest topic in previous studies, but consensus has not been reached either. There is a prevalent notion that the pres- ence of test anxiety will be most disruptive when a test is ini- tially perceived as highly difficult, and least disruptive when a test is initially perceived as relatively ea sy. Studies by Coving- ton and Omelich (1987) and Carlson and Ostrosky (1992) pro- vided data in support of this “initial success” notion. Language testing theorist Bachman (1990) also holds that the easy-to-hard item order may help examinees achieve better. However, the overall pattern of research findings is mixed, with other studies failing to support the effect of item arrangement on test anxiety (Gohmann & Spector, 1989). There have been few studies pro- viding solid empirical evidence showing differential effects of item arrangement on the anxiety of high-versus low-test-an- xious examinees. Munz and Jacobs (1971) made research on the categories of item order arranged by difficulty. He pointed out that although hard-to-easy item order may encourage ex- aminees to make better achievements, easy-to-hard item order may not help to enhance the confidence level of examinees. He further put forward that item order arranged according to the examinee’s perceived item difficulty may have an effect on test performance. According to the literature review, it can be found that those studies did not take into consideration the collective effects of test anxiety and item order on test performance, and neglected the fact that there exists relationship between item order and *This paper is a partial fulfillment of the project “Language and Test Anxi- ety” (211YYCHL01) sponsored by Shanghai International Studies Univer- sity, Shanghai, China.  H. L. CHEN test anxiety at the same time when item order or test anxiety is exerting influence on test performance. Therefore, this research proposes a hypothesis that item order moderates the strength of the relationship between test anxiety and test performance. As the moderator variable, item order can differentially influence the strength and/or direction of the relationship between test anxiety (independent variable) and test performance (dependent variable). The relationship among item order, test anxiety, and test performance can be demonstrated in Figure 1. Research Design In order to improve previous researches and gain more spe- cific findings, this research carries out two investigations: In- vestigation I aims at exploring the moderating effects of the item order arranged by item bank calibrated item difficulty on the relationship between test anxiety and test performance and Investigation II aims at exploring the moderating effects of the item order adjusted according to individual examinee’s per- ceived item difficulty on the relationship between test anxiety and test performance. Item bank calibrated item difficulty is calculated according to the percentage of answering a particular test item correctly among all examinees in pretesting. Individ- ual examinee’s perceived item difficulty refers to the difficulty of a particular item perceived by a particular examinee in a real test situation. This research adopts the multiple choice items on Cultural Knowledge about English-Speaking Countries as the testing material. Those items are used in a one-semester course intro- ducing English-speaking countries to Chinese college students majoring in English language. The item bank is composed of 300 multiple choice items which belong to 35 topical areas which can be further divided into 60 knowledge points with each covering 5 items. The subjects of this research are 250 English major students who have been enrolled in the course about English-speaking countries separately in three semesters (Semester I, Semester II and Semester III), with a distribution of 100, 72, and 78 for each semester. The two investigations adopt the empirical approach and get the findings by applying t-test to compare the difference of means among different groups of subjects. The threshold level of significance for t-test is set at .05. The major instruments employed in the two major researches include the computerized testing system Fast Test Pro 2 (Weiss, 2008), the data analysis software SPSS and Test Anxiety Inventory (TAI) (Spielberger, 1980). In order to avoid the probable difference in test validity between pencil-and-paper tests and computerized tests (Chen, 2009), and to ensure the test items are presented strictly accord- ing to a certain order, all the tests involved in this research (q ues- tionnaires excluded) are administered through computerized tests. The computerized tests involved in this research can be classified into two categories: one is conventional computerized tests which administer items in fixed orders and are applied to Investigation I; the other is computerized adaptive tests which adjust the item order according to the performance of a specific examinee. A computerized adaptive test operates in a way that if the examinee answers an item correctly, the next item presented to him/her will be more difficult, and vice versa. Therefore, computerized adaptive tests can be regarded as tests which can adjust the item order according to individual examinee’s perceived item diffi- culty and can be applied to Investigation II. Test anxitety Test pe rfor mance Item order Figure 1. Moderation relationship among item order, test anxiety and test per- formance. Before launching the research, the difficulty of each item in the item bank should be calibrated and the knowledge factors within the item bank should be detected. The 100 Semester I subjects are required to take all the 300 items in the item bank in a conventional computerized test which presents the items strictly in a random order. Based on the outcome of the test, the facility value and the IRT Rasch Model difficulty of the 300 items can be obtained. Both the facility value and the IRT Rasch Model difficulty belong to item bank calibrated item difficulty, and can be input into item characteristics in comput- erized testing systems. The outcome obtained from the item bank pretesting men- tioned above can also be applied to the factor analysis of the 300 items. Exploratory factor analysis is adopted and 3 signifi- cant factors are retrieved1. The distribution of the 35 topical knowledge areas among the 3 factors is shown below. According to Table 1, factor 1 contains 21 topical knowle- dge areas and 160 items which are more than the other two factors do. The factor analysis of the 300 items in the bank aims to determine the unidimensionality of tests which is an impor- tant assumption of computerized adaptive tests and item re- sponse theory. According to item response theory, only when the items of a computerized adaptive test are unidimensional can we assume the different groups of items administered to different examinees to be a series of randomly chosen parallel tests (Green et al., 1984: p. 356). Investigation I The 72 Semester II subjects are required to complete the 20-item Test Anxiety Inventory (TAI) designed by Spielberger. The subjects whose scores of test anxiety comprise the top third of all the scores are defined as the students with high level of test anxiety and are classified as Group A; the subjects whose scores of test anxiety comprise the middle third of all the scores are defined as the students with moderate level of test anxiety and are classified as Group B; the subjects whose scores of test anxiety comprise the bottom third of all the scores are defined as the students with low level of test anxiety and are classified as Group C. All the 72 subjects are then required to take a test which contained 60 items each of which is the one with moder- ate item bank calibrated item difficulty among the 5 items cov- ered by each knowledge point in the item bank. The test is car- ried out in a fixed random item order through conventional computerized test. According to the test results, Group A is further divided into two subgroups with no significant mean difference, they are A1 and A2 (t-test p = .702 > .05), Group B is also further divided into two subgroups with no significant mean difference, they are B1 and B2 (t-test p = .713 > .05), and Group C is further 1In this article, significant factors are the ones under which items from more than one chapters gain the maximum loading. Copyright © 2012 SciRe s . 329  H. L. CHEN Table 1. Factor loadings of topical knowledge areas. Factor Topical know ledge areas Factor loading Items The UK land .447 The UK people .434 The UK history .344 The UK government .496 The UK sports .781 Australia history .649 Australia g o vernment .630 Australia economy .419 Australia society & culture.383 The US land .633 The US climate .563 The US histor y .482 The US government .709 The US economy .382 The US literature .454 The US music .602 The US education .558 The US festi v al .673 Canada land .478 Canada histor y .374 1 Canada gov ernment .542 160 The UK ec onomy .784 The UK literature .198 The UK performing arts .614 The UK education .602 The UK media .472 Australia land .750 Australia peo ple .579 The US people .4 61 Canada people .417 2 Canada economy .544 75 The UK climate .421 The UK festival .338 Canada society .541 3 Canada festival .618 65 divided into two subgroups with no significant mean difference, they are C1 and C2 (t-test p = .677 > .05). Each pair of sub- groups represents subjects with similar academic ability at a certain level of test anxiety. Next, the six subgroups are required to take tests containing the remaining 240 items in the item bank. Tests are adminis- tered through conventional computerized test in different ways to different subgroups. The 240 items administered to sub- groups A1, B1 and C1 are arranged in a easy-to-hard order according to item bank calibrated item difficulty, while the same 240 items administered to subgroups A2, B2 and C2 are arranged in a hard-to-easy order according to item bank cali- brated item difficulty. According to the results of the tests, the moderating effects of the item order arranged by item bank calibrated item difficulty on the relationship between test anxi- ety and test performance can be discovered. Table 2 shows the mean differences and the level of significance for t-test between subgroups of the same pair. As for Group A1 and Group A2, the results reflect that the mean score of Group A1 which take an easy-to-hard test and that of Group A2 which take a hard-to-easy test are signifi- cantly different (t-test p = .014 < .05). Since Group A1 and Group A2 are the subgroups with high level of test anxiety, it can be concluded that the item order based on item bank cali- brated item difficulty may have a significant effect on the rela- tionship between test anxiety and test performance as far as examinees with high test anxiety are concerned. As for Group B1 and Group B2, the results reflect that the mean score of Group B1 which take an easy-to-hard test and that of Group B2 which take a hard-to-easy test are significantly different (t-test p = .039 < .05). Since Group B1 and Group B2 are the sub- groups with moderate level of test anxiety, it can be concluded that the item order based on item bank calibrated item difficulty may have a significant effect on the relationship between test anxiety and test performance as far as examinees with moderate test anxiety are concerned. As for Group C1 and Group C2, the results reflect that the mean score of Group C1 which take an easy-to-hard test and that of Group C2 which take a hard-to- easy test are not significantly different (t-test p = .12 > .05). Since Group C1 and Group C2 are the subgroups with low level of test anxiety, it can be concluded that the item or der base d on item bank calibrated item difficulty may not have a significant effect on the relationship between test anxiety and test per- formance as far as examinees with low test anxiety are con- cerned. Investigation II The methods applied in Investigation II are similar to those of Investigation I except that Investigation II also involves fac- tor analysis and co mputerized ada ptive tests. The 78 Semester III subjects are required to complete Test Anxiety Inventory (TAI). The subjects whose scores of test anxiety comprise the top third of all the scores are defined as Table 2. Mean differences and p-values observed in Investigation I. A1-A2 B1-B2 C1-C2 Mean difference 21.25 14.583 8.75 t-test p value .014 .039 .12 Copyright © 2012 SciRe s. 330  H. L. CHEN the students with high level of test anxiety and are classified as Group D; the subjects whose scores of test anxiety comprise the middle third of all the scores are defined as the students with moderate level of test anxiety and are classified as Group E; the subjects whose scores of test anxiety comprise the bottom third of all the scores are defined as the students with low level of test anxiety and are classified as Group F. All the 78 subjects are then required to take the 60-item test with moderate diffi- culty which has been taken by Semester II subjects in investi- gation I. The test is carried out in a fixed random item order through conventional computerized test. Since computerized adaptive tests which will be administered later require unidi- mensionality, the results of 32 items which represent the mod- erately difficult items belonging to factor 1 among the 60 items are picked out and analyzed. According to the test results of the 32 items, Group D is fur- ther divided into two subgroups with no significant mean dif- ference, they are D1 and D2 (t-test p = .649 > .05), Group E is also further divided into two subgroups with no significant mean difference, they are E1 and E2 (t-test p = .641 > .05), and Group F is further divided into two subgroups with no signifi- cant mean difference, they are F1 and F2 (t-test p = .589 > .05). Each pair of subgroups represents subjects with similar aca- demic ability at a certain level of test anxiety. Next, the six subgroups are required to take tests containing the remaining 128 items concerning factor 1 in the item bank. The 128 items are administered to subgroups D1, E1 and F1 through a computerized adaptive test which can adjust the item order according to individual examinee’s perceived item diffi- culty, while the same 128 items are administered to subgroups D2, E2 and F2 through a conventional computerized test in which the items are arranged in a hard-to-easy order according to item bank calibrated item difficulty. According to the results of the tests, the moderating effects of the item order adjusted according to individual examinee’s perceived item difficulty on the relationship between test anxiety and test performance can be discovered. Table 3 shows the mean differences and the level of significance for t-test between subgroups of the same pair. As for Group D1 and Group D2, the results reflect that the mean score of Group D1 which take a computerized adaptive test and that of Group D2 which take a hard-to-easy test are significantly different (t-test p = .009 < .05). Since Group D1 and Group D2 are the subgroups with high level of test anxiety, it can be concluded that the item order adjusted according to individual examinee’s perceived item difficulty may have a significant effect on the relationship between test anxiety and test performance as far as examinees with high test anxiety are concerned. As for Group E1 and Group E2, the results reflect that the mean score of Group E1 which take a computerized adaptive test and that of Group E2 which take a hard-to-easy test are significantly different (t-test p = .024 < .05). Since Group E1 and Group E2 are the subgroups with moderate level Table 3. Mean differences and p-values observed in Investigation II . D1-D2 E1-E2 F1-F2 Mean difference 12.1538 9.4615 9.30769 t-test p value .009 .024 .043 of test anxiety, it can be concluded that the item order adjusted according to individual examinee’s perceived item difficulty may have a significant effect on the relationship between test anxiety and test performance as far as examinees with moderate test anxiety are concerned. As for Group F1 and Group F2, the re s ults reflect that the mean score of Group F1 whi ch take a com- puterized adaptive test and that of Group F2 which take a hard- to-easy test are also significantly different (t-test p = .43 < .05). Since Group F1 and Group F2 are the subgroups with low level of test anxiety, it can be concluded that the item order adjusted according to individual examinee’s perceived item difficulty may also have a significant effect on the relationship between test anxiety and test performance as far as examinees with low test anxiety are concerned. Discussion According to the results of the 60-item tests with moderate difficulty administered to Semester II subjects and Semester III subjects in investigation I and investigation II respectively, it can be discovered that there is no significant difference be- tween Semester II subjects and Semester III subjects in aca- demic achievement (t-test p = .603 > .05). Therefore, Semester II subjects and Semester III subjects can be regarded as two sample populations with similar academic ability and the out- comes from Investigation I and Investigation II can be analyzed in a combined way. Figure 2 shows how the outcomes from the two investigations are related with each other. From the above diagram, some global findings about the moderating effects of item order arranged by difficulty on the relationship between test anxiety and test performance can be obtained by comparing the outcomes of the two investigations. Firstly, it can be found that both lines rise from left to right, which demonstrates that no matter whether the item order is arranged by item bank calibrated item difficulty or adjusted according to individual examinee’s perceived item difficulty, the higher test anxiety the examinee has, the more easily the test performance of the examinee can be influenced by item order. Secondly, according to the easy-hard: hard-easy line, it can be found that item order has significant moderating effects on highly-anxious and moderately-anxious subjects, but the effect on subjects with low test anxiety is not significant; while according to the order adjusted by perceived difficulty: hard- easy line, it can be found that item order has significant moder- ating effects on all subjects in three levels of test anxiety. A vivid demonstration of the finding is that the line representing the comparison between the easy-hard item order and the hard-easy item order is entirely above the line representing the comparison between the item order adjusted by perceived dif- ficulty and the hard-easy item order, which indicates that the item order adjusted by perceived difficulty has a greater mod- erating effect on the relationship between test anxiety and test performance in a whole sense. According to the outcomes of the two investigations and the discussion above, two conclusions can be made at least: 1) Item order arranged by difficulty does have moderating effects on the relationship between test anxiety and test performance. The higher test anxiety the examinee has, the more significant the moderating effect will be; 2) The moderating effects of the item order adjusted according to perceived difficulty are in a whole sense more significant than the moderating effects of the item order arranged by item bank calibrated item difficulty. Copyright © 2012 SciRe s . 331 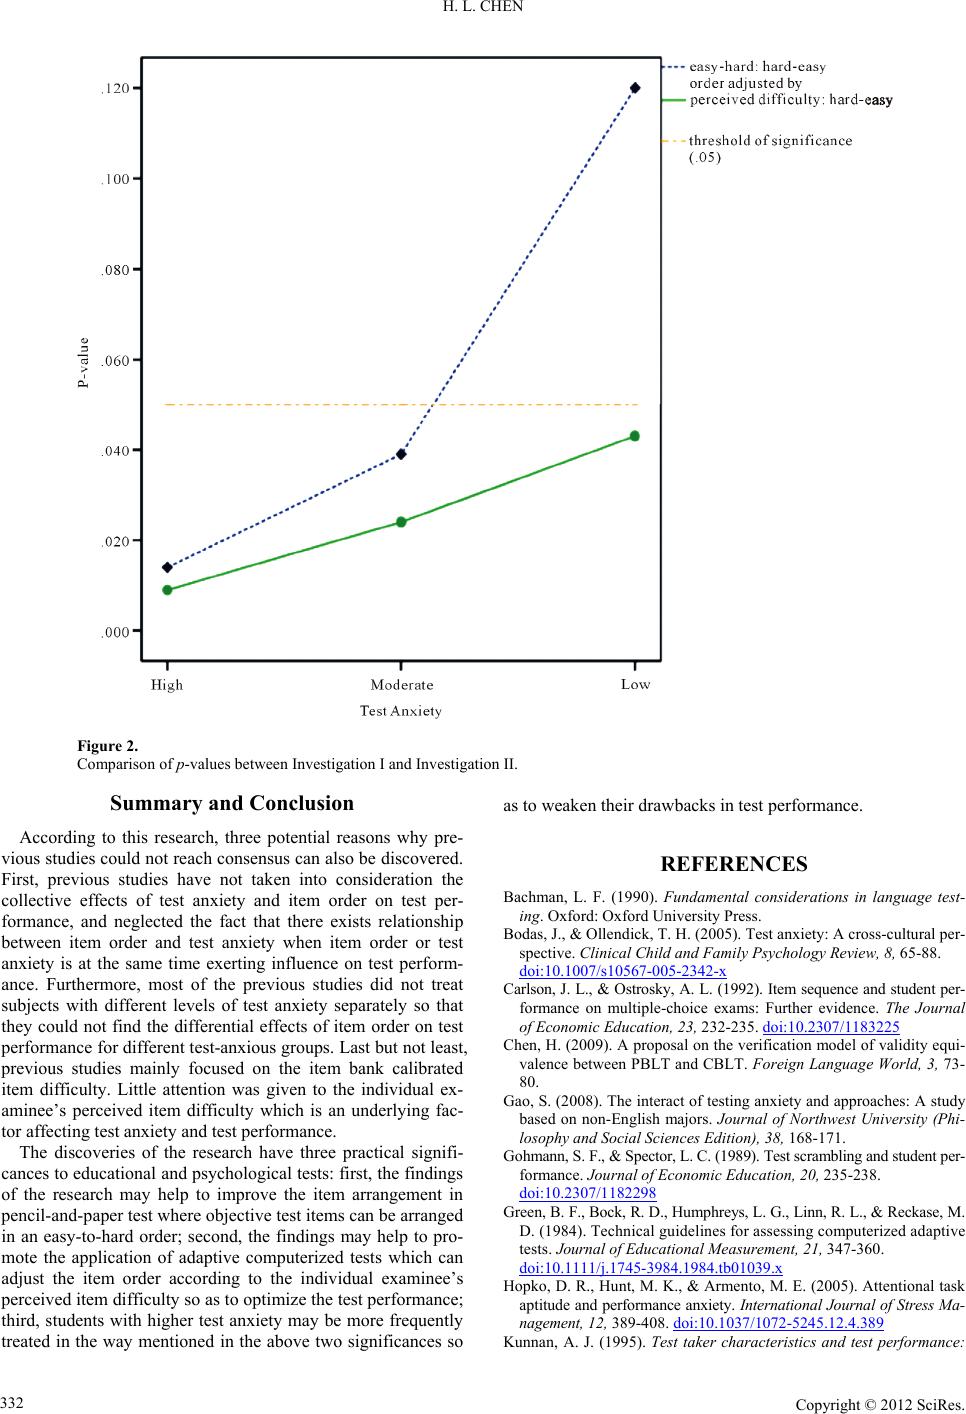 H. L. CHEN Copyright © 2012 SciRe s . 332 Figure 2. Comparison of p-values between Investigation I and I n ve st i ga ti on II. Summary and Conclusion According to this research, three potential reasons why pre- vious studies could not reach consensus can also be discovered. First, previous studies have not taken into consideration the collective effects of test anxiety and item order on test per- formance, and neglected the fact that there exists relationship between item order and test anxiety when item order or test anxiety is at the same time exerting influence on test perform- ance. Furthermore, most of the previous studies did not treat subjects with different levels of test anxiety separately so that they could not find the differential effects of item order on test performance for different test-anxious groups. Last but not least, previous studies mainly focused on the item bank calibrated item difficulty. Little attention was given to the individual ex- aminee’s perceived item difficulty which is an underlying fac- tor affecting test anxiety and test performance. The discoveries of the research have three practical signifi- cances to educational and psychological tests: first, the findings of the research may help to improve the item arrangement in pencil-and-paper test where objective test items can be arranged in an easy-to-hard order; second, the findings may help to pro- mote the application of adaptive computerized tests which can adjust the item order according to the individual examinee’s perceived item difficulty so as to optimize the test performance; third, students with higher test anxiety may be more frequently treated in the way mentioned in the above two significances so as to weaken their drawbacks in test performance. REFERENCES Bachman, L. F. (1990). Fundamental considerations in language test- ing. Oxford: Oxford University Press. Bodas, J., & Ollendick, T. H. (2005). Test anxiety: A cross-cultural per- spective. Clinical Child and F am ily Psychology Review, 8, 65-88. doi:10.1007/s10567-005-2342-x Carlson, J. L., & Ostrosky, A. L. (1992). Item sequence and student per- formance on multiple-choice exams: Further evidence. The Journal of Economic Education, 23, 232-235. doi:10.2307/1183225 Chen, H. (2009). A proposal on the verification model of validity equi- valence between PBLT and CBLT. Foreign Language World, 3, 73- 80. Gao, S. (2008). The interact of testing anxiety and approaches: A study based on non-English majors. Journal of Northwest University (Phi- losophy and Social Sciences Edition), 38, 168-171. Gohmann, S. F., & Spector, L. C. (1989). Test scrambling and student per- formance. Journal of Economic Edu ca tio n, 20, 235-238. doi:10.2307/1182298 Gre e n, B. F. , Bock, R. D., Hu mphreys, L. G., Linn , R. L., & Reck ase, M. D. (1984). Technical guidelines for assessing computerized adaptive tests. Journal of Educational Measurement, 21 , 347-360. doi:10.1111/j.1745-3984.1984.tb01039.x Hopko, D. R., Hunt, M. K., & Armento, M. E. (2005). Attentional task apt itude and performance anxiety. International Journal of Stress Ma- nagement, 12, 389-408. doi:10.1037/1072-5245.12.4.389 Kunnan, A. J. (1995). Test taker characteristics and test performance:  H. L. CHEN A structural modeling approach. Cambridge: Cambridge University Press. Munz, D. C., & Jacobs, P. D. (1971). An evaluation of perceived ite m-di- fficulty sequencing in academic testing. British Journal of Educa- tional Psychology, 4 1 , 195-205. doi:10.1111/j.2044-8279.1971.tb02251.x Pekrun, B., Goetz, T., Perry, R. P., Kramer, K., Hochstadt, M., & Mol- fenter, S. (2004). Beyond test anxiety: Development and validation of the test emotions questionnaire (TEQ). Anxiety, Stress, and Coping, 17, 287-316. doi:10.1080/10615800412331303847 Rocklin, T., & Thompson, J. M. (1985). Interactive effects of test anxi- ety, test difficulty, and feedback. Journal of Experimental Psychol- ogy, 77, 368-372. Sarason, I. G. (1984). Stress, anxiety, and cognitive interference: Reac- tions to tests. Journal of Personality and Social Psychology, 46, 929- 938. doi:10.1037/0022-3514.46.4.929 Spielberger, C. D. (1980). Test anxiety inventory: Preliminary profe- ssional manual. Palo Alto, CA: Consulting Psychology Pres s. Weiss, D. J. (2008). Manual for the fast test professional testing sys- tem (Version 2). St. Paul, MN: Assessment Systems Corporation. Copyright © 2012 SciRe s . 333 |