

Paper Menu >>
Journal Menu >>
 Journal of Water Resource and Protection, 2012, 4, 451-459 http://dx.doi.org/10.4236/jwarp.2012.47052 Published Online July 2012 (http://www.SciRP.org/journal/jwarp) Socio-Environmental Impact of Water Pollution on the Mid-Canal (Meda Ela), Sri Lanka K. B. S. N. Jinadasa1, S. K. I. Wijewardena2, Dong Qing Zhang3*, Richard M. Gersberg4, C. S. Kalpage5, Soon Keat Tan3, Jing Yu an Wang3, Wun Jern Ng3 1Department of Civil Engineering, University of Peradeniya, Peradeniya, Sri Lanka 2Works Department, Kandy Municipal Council, Kandy, Sri Lanka 3Nanyang Environment & Water Research Institute (NEWRI), Nanyang Technological University, Singapore City, Singapore 4Graduate School of Public Health, San Diego State University, Hardy Tower Campanile, San Diego, USA 5Department of Chemical and Process Engineering, University of Peradeniya, Peradeniya, Sri Lanka Email: *[email protected] Received April 10, 2012; revised May 4, 2012; accepted May 31, 2012 ABSTRACT Unplanned urban population growth in developing countries such as Sri Lanka exert pressures on the sectors of water supply, sewage disposal, waste management, and surface drainage in the cities as well as their surrounding areas. The Mid-canal is considered the most polluted surface water body in the Kandy district of Sri Lanka and contributes sig- nificantly to pollution of the Mahaweli River. Health problems in the nearby population may well be associated with environmental degradation and related to deteriorated water quality. The overall objectives of this study were to identify the socio-economic status of the community settled along the Meda Ela banks, and to examine the current water quality status of the Meda Ela and possible impacts of the nearby residents on water quality. Additionally, we propose remedial measures concerning wastewater and solid waste disposal to improve environmental conditions in this area. Keywords: Meda Ela; Sri Lanka; Environment; Pollution; Water Quality 1. Introduction One of the most important demographic trends in the world today is urbanization, with particularly rapid growth in developing countries which is believed to be an important cause of the degradation of natural water resources. In future decades, almost the entire population growth in the world is likely to be in the urban popula- tion, primarily in Asia [1]. With rural-urban migration, it has been estimated that by the year 2025, approximately fifty percent of the population will live in the growing cities of less developed countries [2]. Unplanned urban population growth exerts pressures on water resources, and water pollution has emerged as one of the most cri- tical environmental problems in Asia. Such growth has major impacts on water supply, sewage disposal, waste management, surface drainage, and can cause environ- ment health problems. Kandy is recognized as a world heritage city by the United Nations Educational, Scientific and Cultural Organization (UNESCO) on account of its long and ve- nerable history and its many cultural treasures. A canal (called Mid-canal or “Meda Ela”) originates from the overflow sluice of the Kandy Lake, runs through the den- sely populated city, and thereafter drains into the Maha- weli, which is the largest river basin in Sri Lanka, drain- ing about 16% (10,327 km2) of Sri Lanka’s land surface. Urbanization and population growth in Kandy city has rapidly increased in the volumes of wastewater generated in the region to about 20,000 m3·day–1 [3]. Since there is no proper wastewater disposal system, untreated dome- stic sewage is released directly into the Mid-canal [4]. In addition, Mid-canal receives wastewaters from small scale industries such as commercial laundries, textile dyeing operations, various workshops, a hospital, the city’s main slaughterhouse, and miscellaneous dischargers such as petroleum and other oily waste from motor vehicle workshops. Furthermore, since the canal is topographi- cally situated at a low elevation, a large number of side canals drain into the Mid-canal with their heavy pollu- tant loads. In addition, large water volumes from Kandy Lake spill over to the Mid-canal, especially during the rainy season. Therefore, polluted water in the Mid-canal is a potentially health hazard not only to the people living nearby, but also to persons the communities downstream. Previous studies reported on some of the socio- economic implications of water pollution in the Meda Ela catchment and found that the awareness on water *Corresponding author. C opyright © 2012 SciRes. JWARP 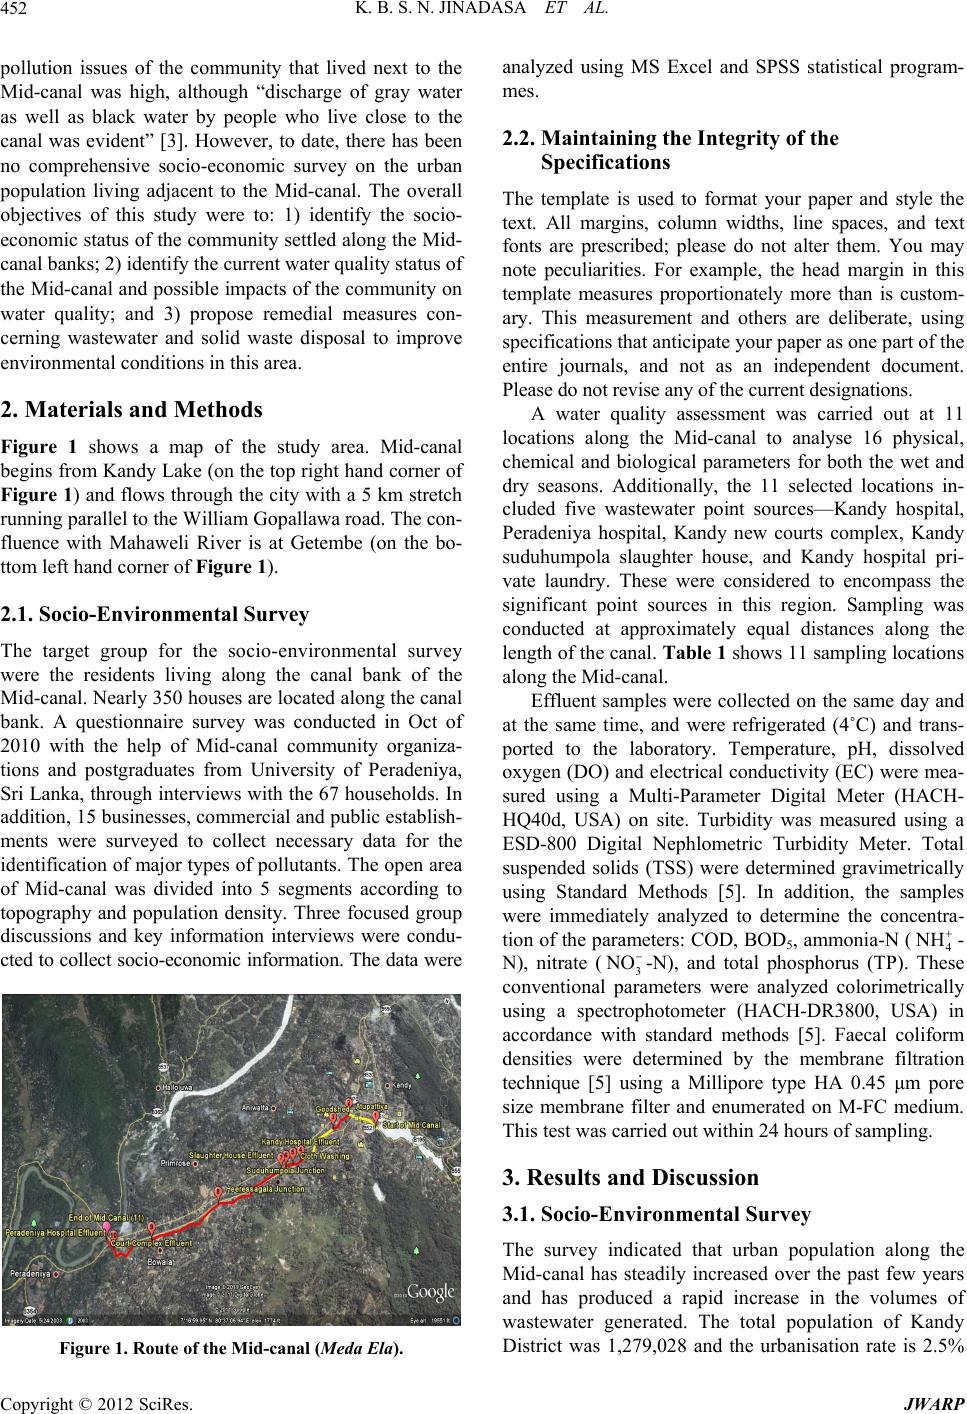 K. B. S. N. JINADASA ET AL. 452 pollution issues of the community that lived next to the Mid-canal was high, although “discharge of gray water as well as black water by people who live close to the canal was evident” [3]. However, to date, there has been no comprehensive socio-economic survey on the urban population living adjacent to the Mid-canal. The overall objectives of this study were to: 1) identify the socio- economic status of the community settled along the Mid- canal banks; 2) identify the current water quality status of the Mid-canal and possible impacts of the community on water quality; and 3) propose remedial measures con- cerning wastewater and solid waste disposal to improve environmental conditions in this area. 2. Materials and Methods Figure 1 shows a map of the study area. Mid-canal begins from Kandy Lake (on the top right hand corner of Figure 1) and flows through the city with a 5 km stretch running parallel to the William Gopallawa road. The con- fluence with Mahaweli River is at Getembe (on the bo- ttom left hand corner of Figure 1). 2.1. Socio-Environmental Survey The target group for the socio-environmental survey were the residents living along the canal bank of the Mid-canal. Nearly 350 houses are located along the canal bank. A questionnaire survey was conducted in Oct of 2010 with the help of Mid-canal community organiza- tions and postgraduates from University of Peradeniya, Sri Lanka, through interviews with the 67 households. In addition, 15 businesses, commercial and public establish- ments were surveyed to collect necessary data for the identification of major types of pollutants. The open area of Mid-canal was divided into 5 segments according to topography and population density. Three focused group discussions and key information interviews were condu- cted to collect socio-economic information. The data were Figure 1. Route of the Mid-canal (Meda Ela). analyzed using MS Excel and SPSS statistical program- mes. 2.2. Maintaining the Integrity of the Specifications The template is used to format your paper and style the text. All margins, column widths, line spaces, and text fonts are prescribed; please do not alter them. You may note peculiarities. For example, the head margin in this template measures proportionately more than is custom- ary. This measurement and others are deliberate, using specifications that anticipate your paper as one part of the entire journals, and not as an independent document. Please do not revise any of the current designations. A water quality assessment was carried out at 11 locations along the Mid-canal to analyse 16 physical, chemical and biological parameters for both the wet and dry seasons. Additionally, the 11 selected locations in- cluded five wastewater point sources—Kandy hospital, Peradeniya hospital, Kandy new courts complex, Kandy suduhumpola slaughter house, and Kandy hospital pri- vate laundry. These were considered to encompass the significant point sources in this region. Sampling was conducted at approximately equal distances along the length of the canal. Table 1 shows 11 sampling locations along the Mid-canal. Effluent samples were collected on the same day and at the same time, and were refrigerated (4˚C) and trans- ported to the laboratory. Temperature, pH, dissolved oxygen (DO) and electrical conductivity (EC) were mea- sured using a Multi-Parameter Digital Meter (HACH- HQ40d, USA) on site. Turbidity was measured using a ESD-800 Digital Nephlometric Turbidity Meter. Total suspended solids (TSS) were determined gravimetrically using Standard Methods [5]. In addition, the samples were immediately analyzed to determine the concentra- tion of the parameters: COD, BOD5, ammonia-N (4 NH - N), nitrate (3 NO -N), and total phosphorus (TP). These conventional parameters were analyzed colorimetrically using a spectrophotometer (HACH-DR3800, USA) in accordance with standard methods [5]. Faecal coliform densities were determined by the membrane filtration technique [5] using a Millipore type HA 0.45 μm pore size membrane filter and enumerated on M-FC medium. This test was carried out within 24 hours of sampling. 3. Results and Discussion 3.1. Socio-Environmental Survey The survey indicated that urban population along the Mid-canal has steadily increased over the past few years and has produced a rapid increase in the volumes of wastewater generated. The total population of Kandy District was 1,279,028 and the urbanisation rate is 2.5% Copyright © 2012 SciRes. JWARP 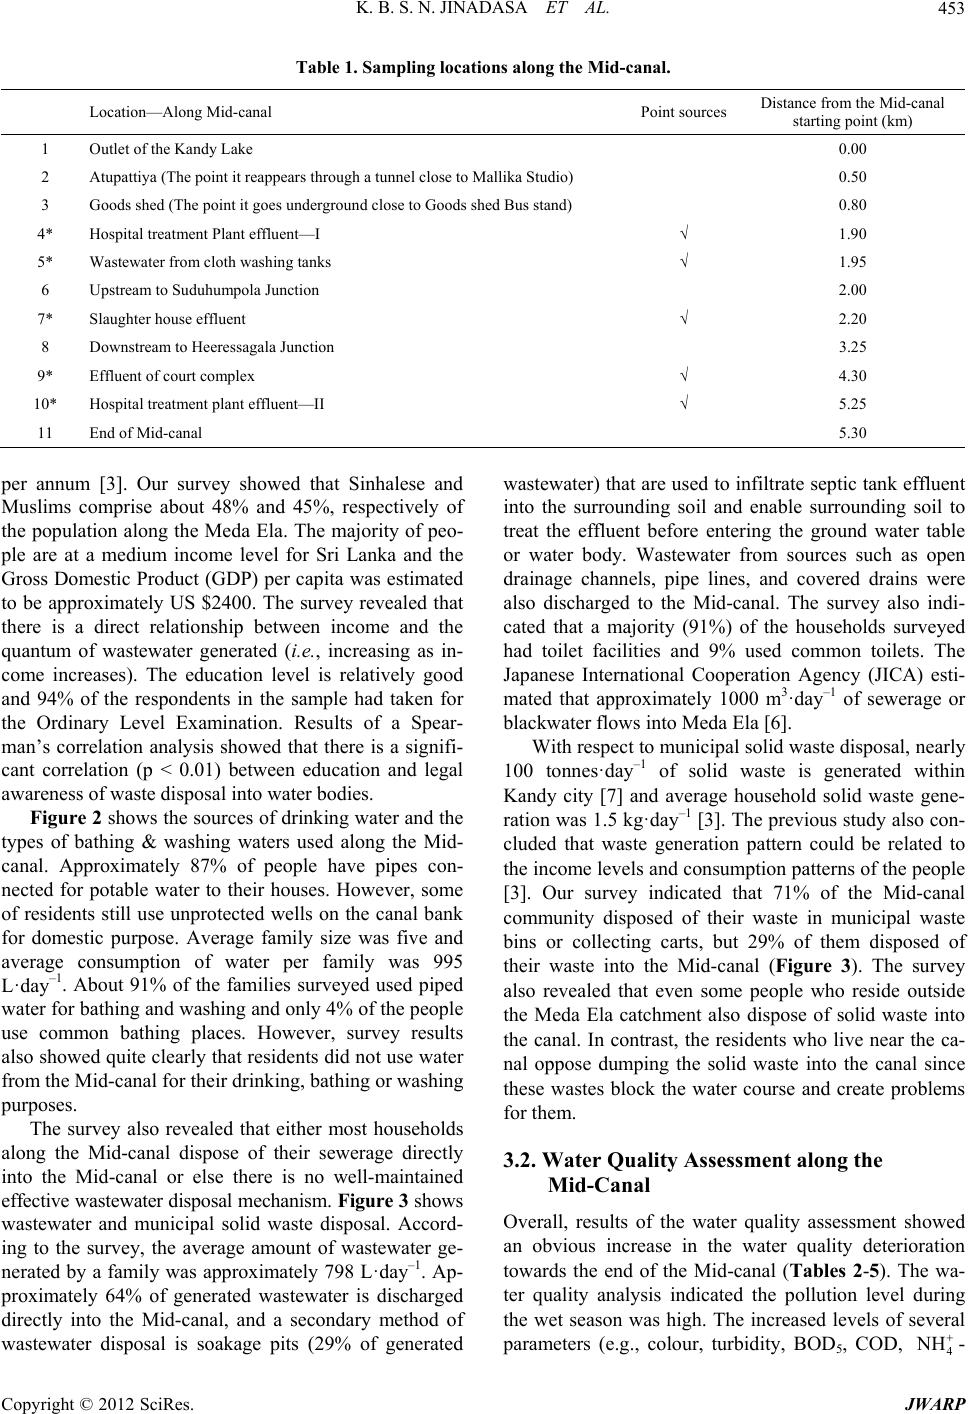 K. B. S. N. JINADASA ET AL. Copyright © 2012 SciRes. JWARP 453 Table 1. Sampling locations along the Mid-canal. Location—Along Mid-canal Point sourcesDistance from the Mid-canal starting point (km) 1 Outlet of the Kandy Lake 0.00 2 Atupattiya (The point it reappears through a tunnel close to Mallika Studio) 0.50 3 Goods shed (The point it goes underground close to Goods shed Bus stand) 0.80 4* Hospital treatment Plant effluent—I √ 1.90 5* Wastewater from cloth washing tanks √ 1.95 6 Upstream to Suduhumpola Junction 2.00 7* Slaughter house effluent √ 2.20 8 Downstream to Heeressagala Junction 3.25 9* Effluent of court complex √ 4.30 10* Hospital treatment plant effluent—II √ 5.25 11 End of Mid-canal 5.30 per annum [3]. Our survey showed that Sinhalese and Muslims comprise about 48% and 45%, respectively of the population along the Meda Ela. The majority of peo- ple are at a medium income level for Sri Lanka and the Gross Domestic Product (GDP) per capita was estimated to be approximately US $2400. The survey revealed that there is a direct relationship between income and the quantum of wastewater generated (i.e., increasing as in- come increases). The education level is relatively good and 94% of the respondents in the sample had taken for the Ordinary Level Examination. Results of a Spear- man’s correlation analysis showed that there is a signifi- cant correlation (p < 0.01) between education and legal awareness of waste disposal into water bodies. Figure 2 shows the sources of drinking water and the types of bathing & washing waters used along the Mid- canal. Approximately 87% of people have pipes con- nected for potable water to their houses. However, some of residents still use unprotected wells on the canal bank for domestic purpose. Average family size was five and average consumption of water per family was 995 L·day–1. About 91% of the families surveyed used piped water for bathing and washing and only 4% of the people use common bathing places. However, survey results also showed quite clearly that residents did not use water from the Mid-canal for their drinking, bathing or washing purposes. The survey also revealed that either most households along the Mid-canal dispose of their sewerage directly into the Mid-canal or else there is no well-maintained effective wastewater disposal mechanism. Figure 3 shows wastewater and municipal solid waste disposal. Accord- ing to the survey, the average amount of wastewater ge- nerated by a family was approximately 798 L·day–1. Ap- proximately 64% of generated wastewater is discharged directly into the Mid-canal, and a secondary method of wastewater disposal is soakage pits (29% of generated wastewater) that are used to infiltrate septic tank effluent into the surrounding soil and enable surrounding soil to treat the effluent before entering the ground water table or water body. Wastewater from sources such as open drainage channels, pipe lines, and covered drains were also discharged to the Mid-canal. The survey also indi- cated that a majority (91%) of the households surveyed had toilet facilities and 9% used common toilets. The Japanese International Cooperation Agency (JICA) esti- mated that approximately 1000 m3·day–1 of sewerage or blackwater flows into Meda Ela [6]. With respect to municipal solid waste disposal, nearly 100 tonnes·day–1 of solid waste is generated within Kandy city [7] and average household solid waste gene- ration was 1.5 kg·day–1 [3]. The previous study also con- cluded that waste generation pattern could be related to the income levels and consumption patterns of the people [3]. Our survey indicated that 71% of the Mid-canal community disposed of their waste in municipal waste bins or collecting carts, but 29% of them disposed of their waste into the Mid-canal (Figure 3). The survey also revealed that even some people who reside outside the Meda Ela catchment also dispose of solid waste into the canal. In contrast, the residents who live near the ca- nal oppose dumping the solid waste into the canal since these wastes block the water course and create problems for them. 3.2. Water Quality Assessment along the Mid-Canal Overall, results of the water quality assessment showed an obvious increase in the water quality deterioration towards the end of the Mid-canal (Tables 2-5). The wa- ter quality analysis indicated the pollution level during the wet season was high. The increased levels of several parameters (e.g., colour, turbidity, BOD5, COD, 4 NH - 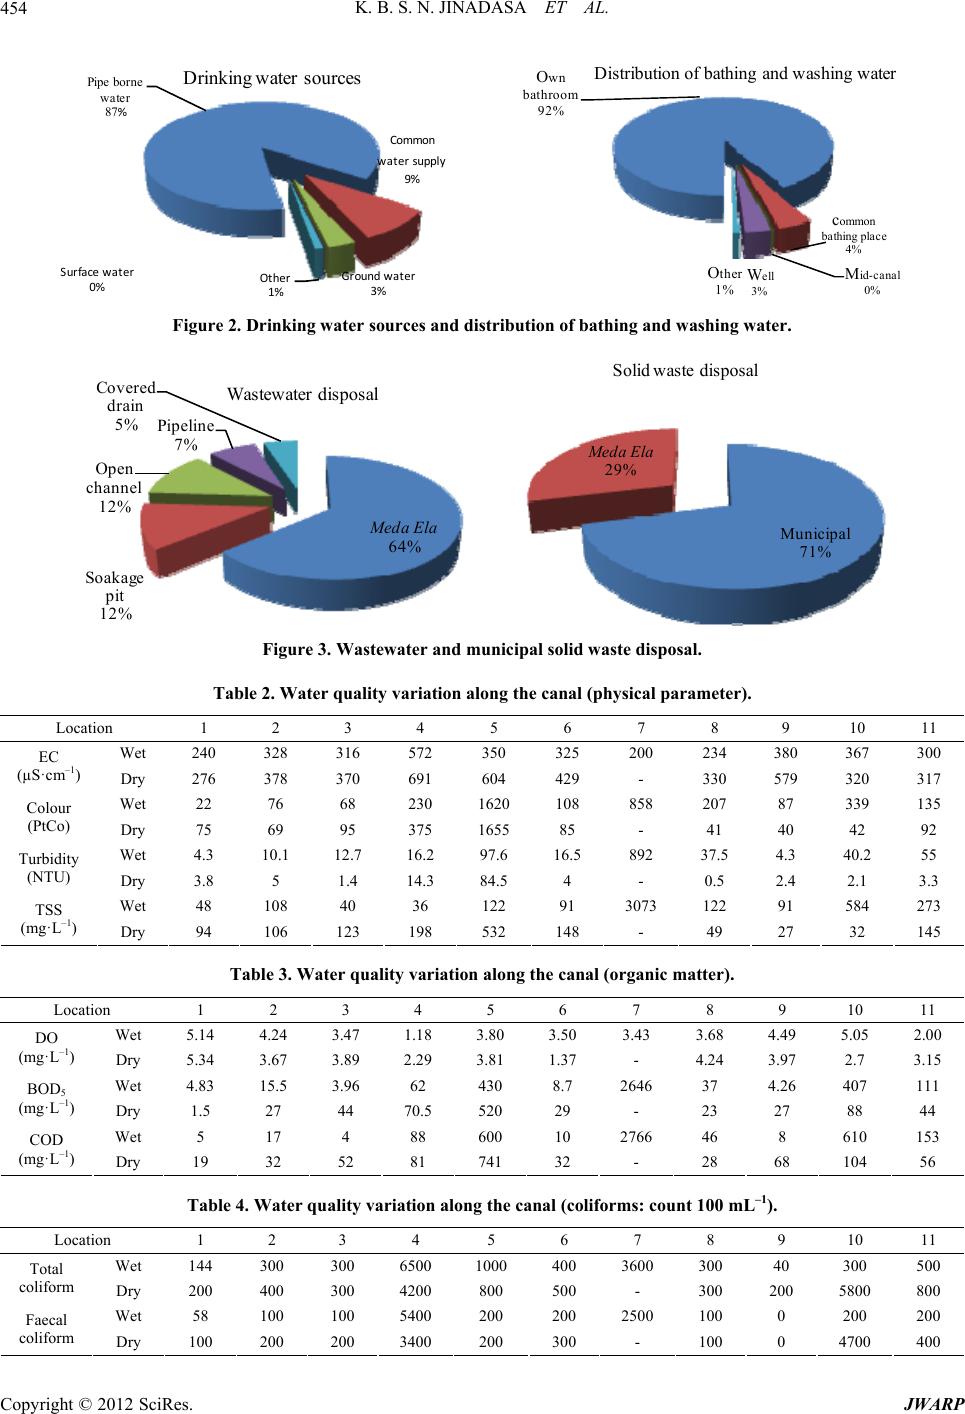 K. B. S. N. JINADASA ET AL. 454 Pipe borne water 87% Common ersupply 9% ter wat Groundwa 3% Surfacewater 0% Oth er 1% Drinking water sources O wn bathroom 92% W ell 3% O ther 1% Distribution of bathing and w c ommon bathing place 4% M id-canal 0% ashing water Figure 2. Drinking wate r sources and distribution of bathing and washing water. Med 64 Soakage pit 12% Open channel 12% Pipeline 7% Covered drain 5% Wastewater disposal a Ela % Municipal 71% M eda El a 29% Solid waste disposal Figure 3. Wastewater and municipal solid waste disposal. Table 2. Water quality variation along the canal (physical parameter). Location 1 2 3 4 5 6 7 8 9 10 11 Wet 240 328 316 572 350 325 200 234 380 367 300 EC (µS·cm–1) Dry 276 378 370 691 604 429 - 330 579 320 317 Wet 22 76 68 230 1620 108 858 207 87 339 135 Colour (PtCo) Dry 75 69 95 375 1655 85 - 41 40 42 92 Wet 4.3 10.1 12.7 16.2 97.6 16.5 892 37.5 4.3 40.2 55 Turbidity (NTU) Dry 3.8 5 1.4 14.3 84.5 4 - 0.5 2.4 2.1 3.3 Wet 48 108 40 36 122 91 3073 122 91 584 273 TSS (mg·L–1) Dry 94 106 123 198 532 148 - 49 27 32 145 Table 3. Water quality variation along the canal (organic matter). Location 1 2 3 4 5 6 7 8 9 10 11 Wet 5.14 4.24 3.47 1.18 3.80 3.50 3.43 3.68 4.49 5.05 2.00 DO (mg·L–1) Dry 5.34 3.67 3.89 2.29 3.81 1.37 - 4.24 3.97 2.7 3.15 Wet 4.83 15.5 3.96 62 430 8.7 2646 37 4.26 407 111 BOD5 (mg·L–1) Dry 1.5 27 44 70.5 520 29 - 23 27 88 44 Wet 5 17 4 88 600 10 2766 46 8 610 153 COD (mg·L–1) Dry 19 32 52 81 741 32 - 28 68 104 56 Table 4. Water quality variation along the canal (coliforms: count 100 mL–1). Location 1 2 3 4 5 6 7 8 9 10 11 Wet 144 300 300 6500 1000 400 3600 300 40 300 500 Total coliform Dry 200 400 300 4200 800 500 - 300 200 5800 800 Wet 58 100 100 5400 200 200 2500 100 0 200 200 Faecal coliform Dry 100 200 200 3400 200 300 - 100 0 4700 400 Copyright © 2012 SciRes. JWARP 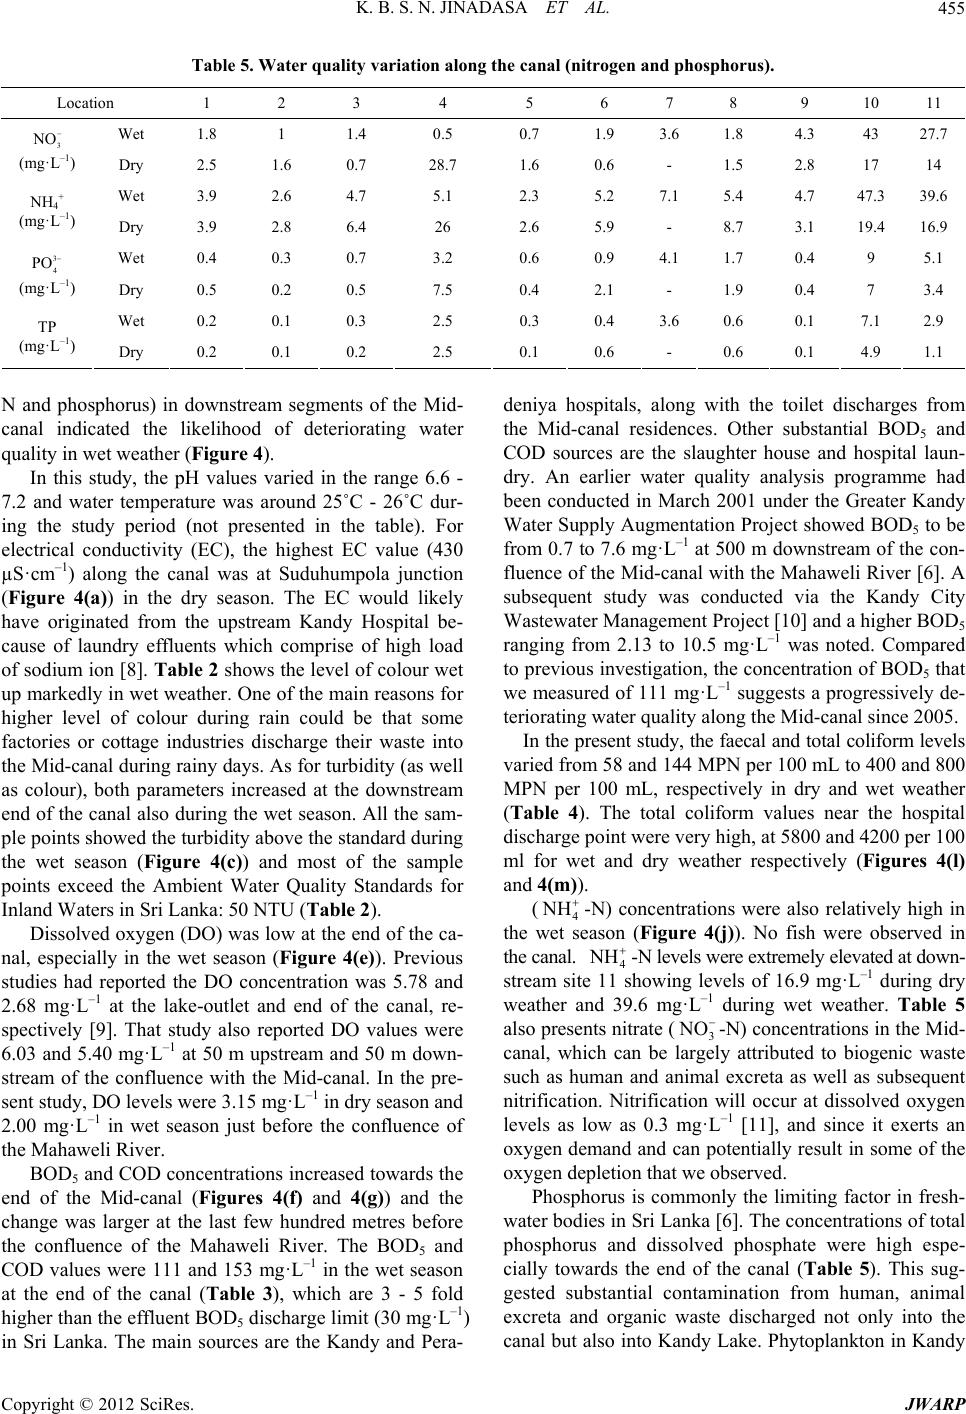 K. B. S. N. JINADASA ET AL. 455 Table 5. Water quality variation along the canal (nitrogen and phosphorus). Location 1 2 3 4 5 6 7 8 9 10 11 Wet 1.8 1 1.4 0.5 0.7 1.9 3.6 1.8 4.3 43 27.7 3 NO 3 4 PO (mg·L–1) Dry 2.5 1.6 0.7 28.7 1.6 0.6 - 1.5 2.8 17 14 Wet 3.9 2.6 4.7 5.1 2.3 5.2 7.1 5.4 4.7 47.3 39.6 NH4+ (mg·L–1) Dry 3.9 2.8 6.4 26 2.6 5.9 - 8.7 3.1 19.4 16.9 Wet 0.4 0.3 0.7 3.2 0.6 0.9 4.1 1.7 0.4 9 5.1 (mg·L–1) Dry 0.5 0.2 0.5 7.5 0.4 2.1 - 1.9 0.4 7 3.4 Wet 0.2 0.1 0.3 2.5 0.3 0.4 3.6 0.6 0.1 7.1 2.9 TP (mg·L–1) Dry 0.2 0.1 0.2 2.5 0.1 0.6 - 0.6 0.1 4.9 1.1 N and phosphorus) in downstream segments of the Mid- canal indicated the likelihood of deteriorating water quality in wet weather (Figure 4). In this study, the pH values varied in the range 6.6 - 7.2 and water temperature was around 25˚C - 26˚C dur- ing the study period (not presented in the table). For electrical conductivity (EC), the highest EC value (430 µS·cm–1) along the canal was at Suduhumpola junction (Figure 4(a)) in the dry season. The EC would likely have originated from the upstream Kandy Hospital be- cause of laundry effluents which comprise of high load of sodium ion [8]. Table 2 shows the level of colour wet up markedly in wet weather. One of the main reasons for higher level of colour during rain could be that some factories or cottage industries discharge their waste into the Mid-canal during rainy days. As for turbidity (as well as colour), both parameters increased at the downstream end of the canal also during the wet season. All the sam- ple points showed the turbidity above the standard during the wet season (Figure 4(c)) and most of the sample points exceed the Ambient Water Quality Standards for Inland Waters in Sri Lanka: 50 NTU (Table 2). Dissolved oxygen (DO) was low at the end of the ca- nal, especially in the wet season (Figure 4(e)). Previous studies had reported the DO concentration was 5.78 and 2.68 mg·L–1 at the lake-outlet and end of the canal, re- spectively [9]. That study also reported DO values were 6.03 and 5.40 mg·L–1 at 50 m upstream and 50 m down- stream of the confluence with the Mid-canal. In the pre- sent study, DO levels were 3.15 mg·L–1 in dry season and 2.00 mg·L–1 in wet season just before the confluence of the Mahaweli River. BOD5 and COD concentrations increased towards the end of the Mid-canal (Figures 4(f) and 4(g)) and the change was larger at the last few hundred metres before the confluence of the Mahaweli River. The BOD5 and COD values were 111 and 153 mg·L–1 in the wet season at the end of the canal (Table 3), which are 3 - 5 fold higher than the effluent BOD5 discharge limit (30 mg·L–1) in Sri Lanka. The main sources are the Kandy and Pera- deniya hospitals, along with the toilet discharges from the Mid-canal residences. Other substantial BOD5 and COD sources are the slaughter house and hospital laun- dry. An earlier water quality analysis programme had been conducted in March 2001 under the Greater Kandy Water Supply Augmentation Project showed BOD5 to be from 0.7 to 7.6 mg·L–1 at 500 m downstream of the con- fluence of the Mid-canal with the Mahaweli River [6]. A subsequent study was conducted via the Kandy City Wastewater Management Project [10] and a higher BOD5 ranging from 2.13 to 10.5 mg·L–1 was noted. Compared to previous investigation, the concentration of BOD5 that we measured of 111 mg·L–1 suggests a progressively de- teriorating water quality along the Mid-canal since 2005. In the present study, the faecal and total coliform levels varied from 58 and 144 MPN per 100 mL to 400 and 800 MPN per 100 mL, respectively in dry and wet weather (Table 4). The total coliform values near the hospital discharge point were very high, at 5800 and 4200 per 100 ml for wet and dry weather respectively (Figures 4(l) and 4(m)). (4 NH -N) concentrations were also relatively high in the wet season (Figure 4(j)). No fish were observed in the canal. 4 NH -N levels were extremely elevated at down- stream site 11 showing levels of 16.9 mg·L–1 during dry weather and 39.6 mg·L–1 during wet weather. Table 5 also presents nitrate (3 NO -N) concentrations in the Mid- canal, which can be largely attributed to biogenic waste such as human and animal excreta as well as subsequent nitrification. Nitrification will occur at dissolved oxygen levels as low as 0.3 mg·L–1 [11], and since it exerts an oxygen demand and can potentially result in some of the oxygen depletion that we observed. Phosphorus is commonly the limiting factor in fresh- water bodies in Sri Lanka [6]. The concentrations of total phosphorus and dissolved phosphate were high espe- cially towards the end of the canal (Table 5). This sug- gested substantial contamination from human, animal excreta and organic waste discharged not only into the canal but also into Kandy Lake. Phytoplankton in Kandy Copyright © 2012 SciRes. JWARP 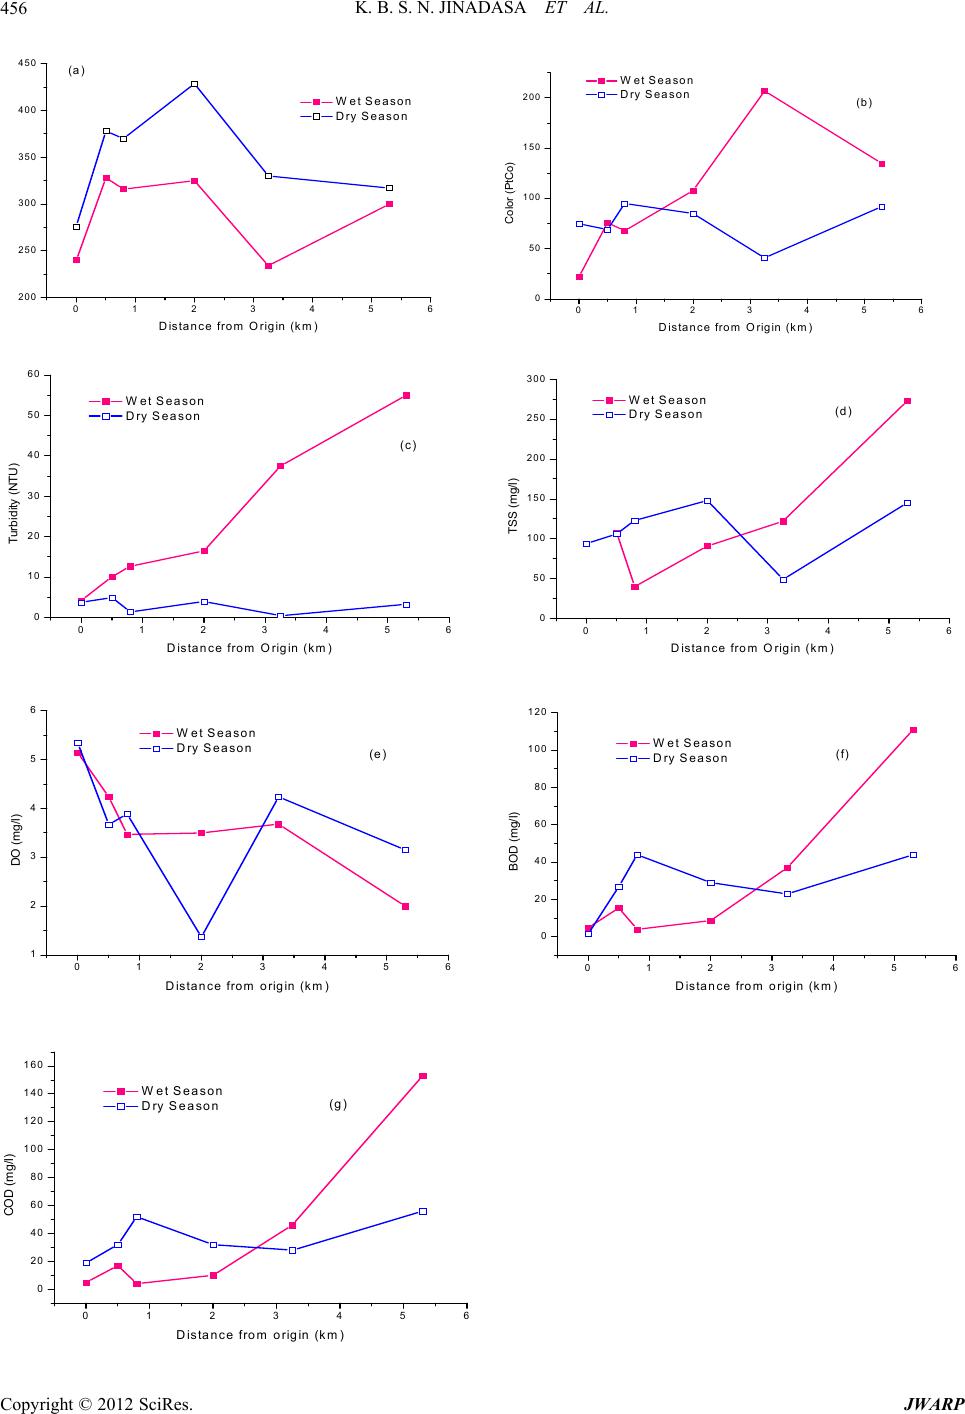 K. B. S. N. JINADASA ET AL. 456 0123456 200 250 300 350 400 450 Distance from O rigin (km) Wet Season Dry Season (a) 0123456 0 20 40 60 80 100 120 140 160 COD (mg/l) Distance from origin (km ) Wet Season Dry Season(g) 0123456 0 10 20 30 40 50 60 Turbidity (NTU) D istance from O rigin (km ) Wet S eason Dry Season (c) 0123 0 50 100 150 200 250 300 456 TSS (mg/l) Distance from Origin (km) Wet S eason Dry Season(d) 0123 0 20 40 60 80 100 120 456 BOD (mg/l) D istance from origin (km) Wet Season Dry Season(f) 01234 0 50 100 150 200 56 Color (PtC o) Distance from O rigin (km) Wet Season Dry Season 0123456 1 2 3 4 5 6 (b ) DO (mg/l) Distance from origin (km ) Wet Season D ry Season(e) Copyright © 2012 SciRes. JWARP 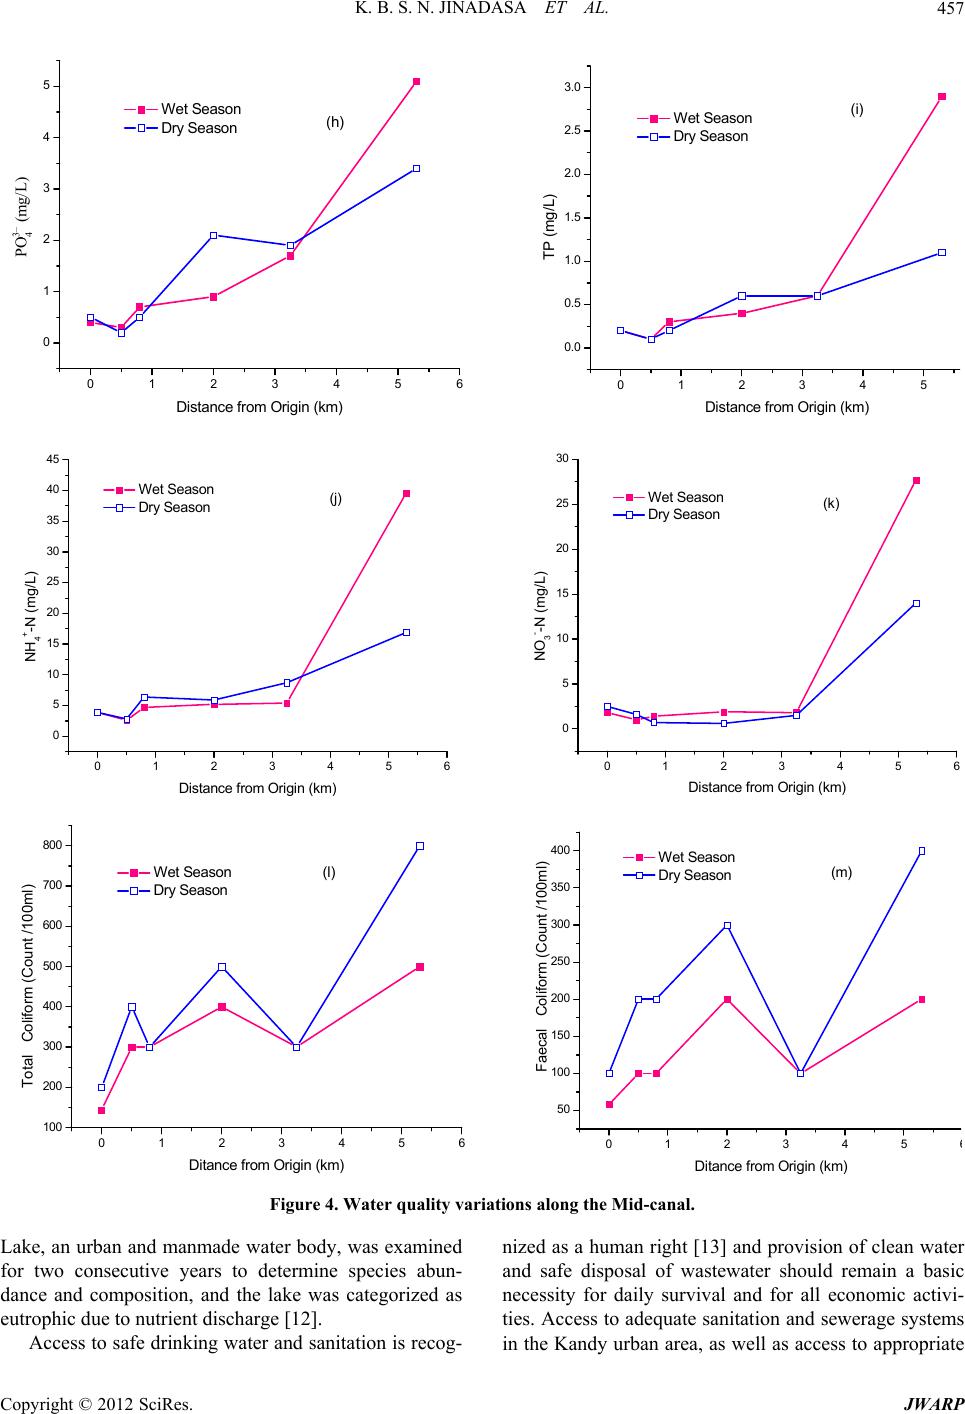 K. B. S. N. JINADASA ET AL. 457 0123456 0 1 2 3 4 5 4 Distance from Origin (km) Wet Season Dry Seas on(h) 0123 0.0 0.5 1.0 1.5 2.0 2.5 3.0 45 TP (mg/L) Distance from Origin (km) Wet Season Dry Se ason (i) PO 3– (mg/L) 4 0123 0 5 10 15 20 25 30 456 NO3 --N (mg/L) Distance from Origin (km) Wet Season Dry Season(k) 0123456 0 5 10 15 20 25 30 35 40 45 NH4 +-N (mg/L) Distance from Origin (km) Wet Season Dry Season(j) 012345 6 50 100 150 200 250 300 350 400 Faecal Colifor m (C ou nt /100ml) Ditance from Origin (km) Wet S e a s o n Dry Season(m) 0123456 100 200 300 400 500 600 700 800 Total Coliform (Count /100ml) Ditance from Origin (km) Wet Season Dry Season(l) Figure 4. Water quality variations along the Mid-canal. Lake, an urban and manmade water body, was examined for two consecutive years to determine species abun- dance and composition, and the lake was categorized as eutrophic due to nutrient discharge [12]. Access to safe drinking water and sanitation is recog- nized as a human right [13] and provision of clean water and safe disposal of wastewater should remain a basic necessity for daily survival and for all economic activi- ties. Access to adequate sanitation and sewerage systems in the Kandy urban area, as well as access to appropriate Copyright © 2012 SciRes. JWARP 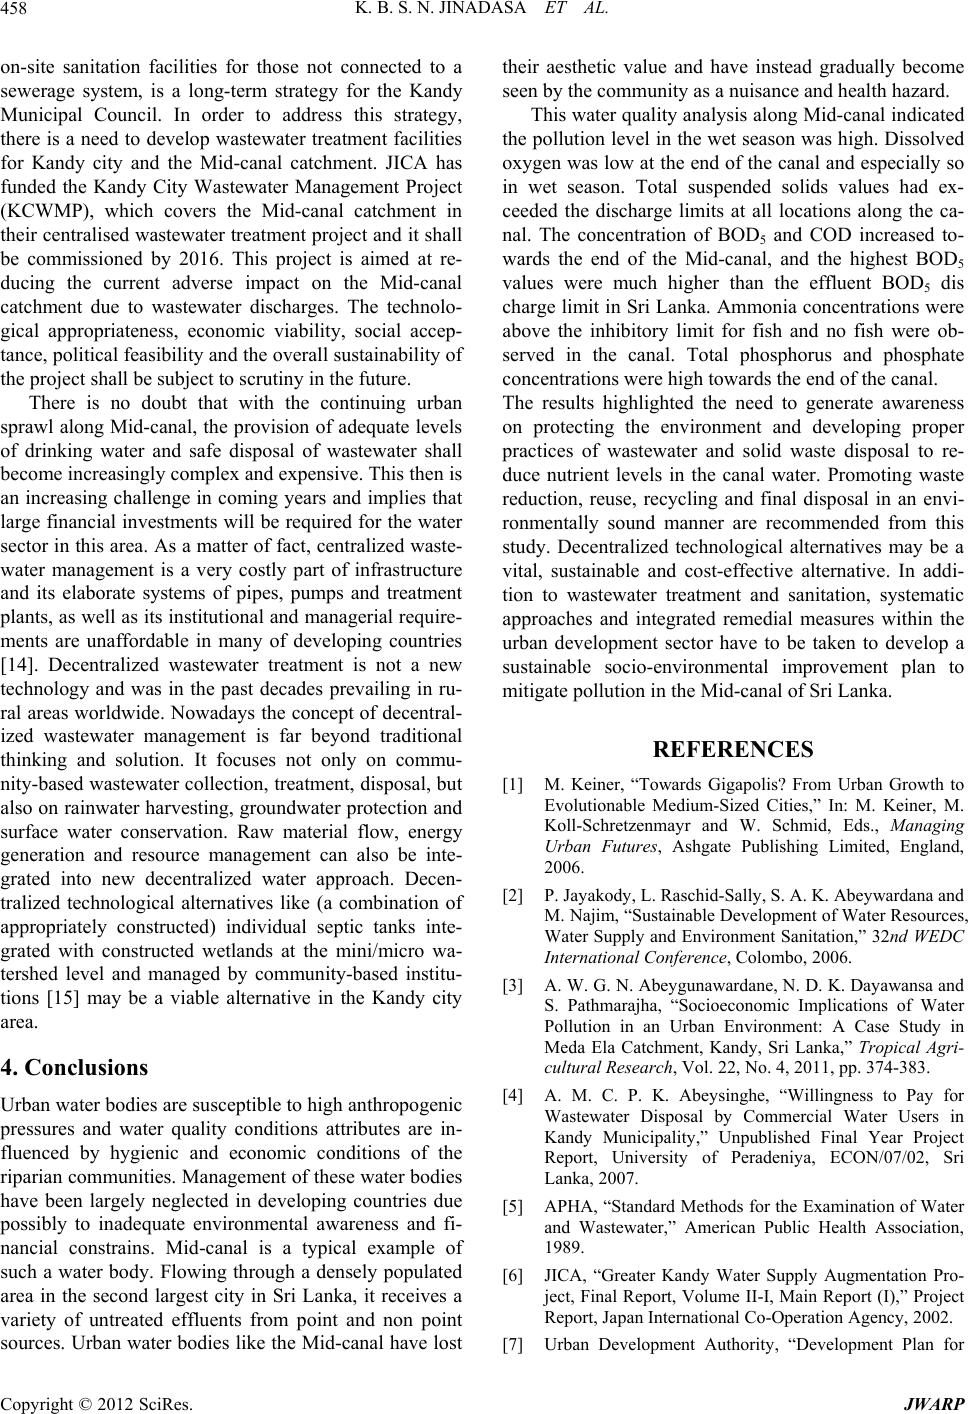 K. B. S. N. JINADASA ET AL. 458 on-site sanitation facilities for those not connected to a sewerage system, is a long-term strategy for the Kandy Municipal Council. In order to address this strategy, there is a need to develop wastewater treatment facilities for Kandy city and the Mid-canal catchment. JICA has funded the Kandy City Wastewater Management Project (KCWMP), which covers the Mid-canal catchment in their centralised wastewater treatment project and it shall be commissioned by 2016. This project is aimed at re- ducing the current adverse impact on the Mid-canal catchment due to wastewater discharges. The technolo- gical appropriateness, economic viability, social accep- tance, political feasibility and the overall sustainability of the project shall be subject to scrutiny in the future. There is no doubt that with the continuing urban sprawl along Mid-canal, the provision of adequate levels of drinking water and safe disposal of wastewater shall become increasingly complex and expensive. This then is an increasing challenge in coming years and implies that large financial investments will be required for the water sector in this area. As a matter of fact, centralized waste- water management is a very costly part of infrastructure and its elaborate systems of pipes, pumps and treatment plants, as well as its institutional and managerial require- ments are unaffordable in many of developing countries [14]. Decentralized wastewater treatment is not a new technology and was in the past decades prevailing in ru- ral areas worldwide. Nowadays the concept of decentral- ized wastewater management is far beyond traditional thinking and solution. It focuses not only on commu- nity-based wastewater collection, treatment, disposal, but also on rainwater harvesting, groundwater protection and surface water conservation. Raw material flow, energy generation and resource management can also be inte- grated into new decentralized water approach. Decen- tralized technological alternatives like (a combination of appropriately constructed) individual septic tanks inte- grated with constructed wetlands at the mini/micro wa- tershed level and managed by community-based institu- tions [15] may be a viable alternative in the Kandy city area. 4. Conclusions Urban water bodies are susceptible to high anthropogenic pressures and water quality conditions attributes are in- fluenced by hygienic and economic conditions of the riparian communities. Management of these water bodies have been largely neglected in developing countries due possibly to inadequate environmental awareness and fi- nancial constrains. Mid-canal is a typical example of such a water body. Flowing through a densely populated area in the second largest city in Sri Lanka, it receives a variety of untreated effluents from point and non point sources. Urban water bodies like the Mid-canal have lost their aesthetic value and have instead gradually become seen by the community as a nuisance and health hazard. This water quality analysis along Mid-canal indicated the pollution level in the wet season was high. Dissolved oxygen was low at the end of the canal and especially so in wet season. Total suspended solids values had ex- ceeded the discharge limits at all locations along the ca- nal. The concentration of BOD5 and COD increased to- wards the end of the Mid-canal, and the highest BOD5 values were much higher than the effluent BOD5 dis charge limit in Sri Lanka. Ammonia concentrations were above the inhibitory limit for fish and no fish were ob- served in the canal. Total phosphorus and phosphate concentrations were high towards the end of the canal. The results highlighted the need to generate awareness on protecting the environment and developing proper practices of wastewater and solid waste disposal to re- duce nutrient levels in the canal water. Promoting waste reduction, reuse, recycling and final disposal in an envi- ronmentally sound manner are recommended from this study. Decentralized technological alternatives may be a vital, sustainable and cost-effective alternative. In addi- tion to wastewater treatment and sanitation, systematic approaches and integrated remedial measures within the urban development sector have to be taken to develop a sustainable socio-environmental improvement plan to mitigate pollution in the Mid-canal of Sri Lanka. REFERENCES [1] M. Keiner, “Towards Gigapolis? From Urban Growth to Evolutionable Medium-Sized Cities,” In: M. Keiner, M. Koll-Schretzenmayr and W. Schmid, Eds., Managing Urban Futures, Ashgate Publishing Limited, England, 2006. [2] P. Jayakody, L. Raschid-Sally, S. A. K. Abeywardana and M. Najim, “Sustainable Development of Water Resources, Water Supply and Environment Sanitation,” 32nd WEDC International Conference, Colombo, 2006. [3] A. W. G. N. Abeygunawardane, N. D. K. Dayawansa and S. Pathmarajha, “Socioeconomic Implications of Water Pollution in an Urban Environment: A Case Study in Meda Ela Catchment, Kandy, Sri Lanka,” Tropical Agri- cultural Research, Vol. 22, No. 4, 2011, pp. 374-383. [4] A. M. C. P. K. Abeysinghe, “Willingness to Pay for Wastewater Disposal by Commercial Water Users in Kandy Municipality,” Unpublished Final Year Project Report, University of Peradeniya, ECON/07/02, Sri Lanka, 2007. [5] APHA, “Standard Methods for the Examination of Water and Wastewater,” American Public Health Association, 1989. [6] JICA, “Greater Kandy Water Supply Augmentation Pro- ject, Final Report, Volume II-I, Main Report (I),” Project Report, Japan International Co-Operation Agency, 2002. [7] Urban Development Authority, “Development Plan for Copyright © 2012 SciRes. JWARP  K. B. S. N. JINADASA ET AL. Copyright © 2012 SciRes. JWARP 459 Urban Development Area of Kandy,” Situation Report, Sri Lanka, 2001. [8] R. A. Patterson, “Demonstration of Effects of Sodicity on Soil Hydraulic Conductivity,” Proceedings of the Innova- tive Approaches to the On-Site Management of Waste and Water, Southern Cross University, Australia, 26 Novem- ber 1996. [9] P. D. W. S. Poddalgoda, “The Status of the Effluent Dis- charge into Meda-Ela and Its Impact on the Mahaweli River,” M.Sc. Thesis, University of Peradeniya, Sri Lanka, 1996. [10] JICA, “Kandy City Wastewater Management Project,” Project Report, Japan International Co-Operation Agency, 2005. [11] D. R. Keeney, “The Nitrogen Cycle in Sediment-Water System,” Journal of Environmental Quality, Vol. 2, 1973, pp. 15-29. doi:10.2134/jeq1973.00472425000200010002x [12] E. I. L. Silva, “Water Quality of Sri Lanka: A Review on Twelve Water Bodies, Kandy,” Department of Environ- mental Sciences, Institute of Fundamental Studies, 1996. [13] United Nations, “Human Rights and Access to Safe Drinking Water and Sanitation,” The Human Rights Council, A/HRC/15/L.14, 2010. [14] U. Winblad, “First International Conference on Ecologi- cal Sanitation,” Official Conference Report, Naning, 5-8 November 2001. [15] N. C. Narayanan and S. Thrikawala, “Aid, Technology and Project Dependence: A Case of Institutional Weak- ening of Water Sector from Sri Lanka,” Journal of South Asian Water Studies, Vol. 2, No. 2, 2010, pp. 59-74. |