

Paper Menu >>
Journal Menu >>
 Journal of Water Resource and Protection, 2012, 4, 507-515 http://dx.doi.org/10.4236/jwarp.2012.47059 Published Online July 2012 (http://www.SciRP.org/journal/jwarp) Hydro-Geophysical Investigations for the Purposes of Groundwater Artificial Recharge in Wadi Al-Butum Area, Jordan Hani Al-Amoush Earth and Environmental Sciences Department, Al Al-Bayt University, Mafraq, Jordan Email: [email protected] Received March 20, 2012; revised April 22, 2012; accepted May 25, 2012 ABSTRACT In this article, the potential for artificial groundwater recharge of Wadi Al-Butum catchments area—Jordan is studied, using geoelectrical resistivity surveys and hydro geochemical methods with the aim of storing some of surface water during flood events times to be recharged in the groundwater as an essential part of integrated water resources man- agement. The results of geoelectrical surveys show the existence of potential zones of alluvial deposits to store and re- charge the groundwater aquifers. The hydro-geochemical modeling results show an overall upgrading of the original groundwater quality could be expected. Keywords: VES; Hydro-Geophysics; Artificial Recharge; Wadi Al-Butum 1. Introduction Jordan is located in an arid to semi arid lands, and it is considered among the scarcest water resources countries in the world. About 81% of its area receives rainfall in average less than 100 mm/year [1]. Most of the received precipitation is being lost due to the high evaporation rates [2]. Jordan is characterized by severe weather con- ditions, therefore great temporal and spatial variations in rainfall; runoff and evaporation amounts are expected [3]. The annual population growth rate in Jordan is estimated to be around 2.65%. Based on this percentage, it is esti- mated that the total population in Jordan will be around 12 millions by 2020 [4]. This will add more pressures on the existing water resources in the country leading to a massive decrease in per capita to 85 m3·capita–1·year–1 by 2025 [4]. One alternative to water sustainability crisis occurring in arid land is groundwater artificial recharge. It refers to the entry of water from the unsaturated zone into the saturated zone below the water table together with the associated flow away from the water table with- in the saturated zone [5]. The major source of water for recharging groundwater aquifers in arid and semi-arid zones is wadi runoff [6]. Wadi Al-Butum sub catchments area located in the Jordanian desert and surrounded the historical archeo- logical site—Qasar Amra. The principle groundwater aquifer beneath Wadi Al-Butum is the Rijam formation B4 which outcrops at the surface along wadi beds in some places. Although the B4 aquifer derives the major- ity of its recharge from the north and northeast (basalt area), significant recharge does come from the area im- mediately surrounded the wadi [7]. According to previous studies conducted by [1], it was concluded that the runoff along Wadi Al-Butum is gener- ated when a precipitation event exceeds in its amount 15 mm. In the period 1969 to 2006 only three years 1998/ 1999, 1999/2000 and 2001/2002 show that all the rainfall events taking place in these years were less than 20 mm. But the total runoffs in these years were 33,400, 71,600 and 104,900 m3 respectively. The total annual runoffs in the period 1969 to 2010 ranged from 33,000 m3 as a minimum to 65.6 million m3 as a maximum [1]. The in- filtration rate in Wadi Al-Butum area was estimated to be 0.197 m/day [7]. Recently, several studies have been used integrated techniques in order evaluate the groundwater occurrences and locate artificial recharge zones and finding suitable sites for artificially groundwater recharge (e.g. [8,9]). In this present study, hydro-geophysical investigations including vertical resistivity sounding surveys and hydro- geochemical modeling were carried out with the aim of studying the potential for artificial groundwater recharge in Wadi Al-Butum catchments area. 2. Description of the Study Area The study area is located in the northern part of Jordan. It is situated within the coordinates longitudes 36˚20′ and 36˚35′ East, and Latitude 31˚40′ and 32˚00′ North (Fig- C opyright © 2012 SciRes. JWARP 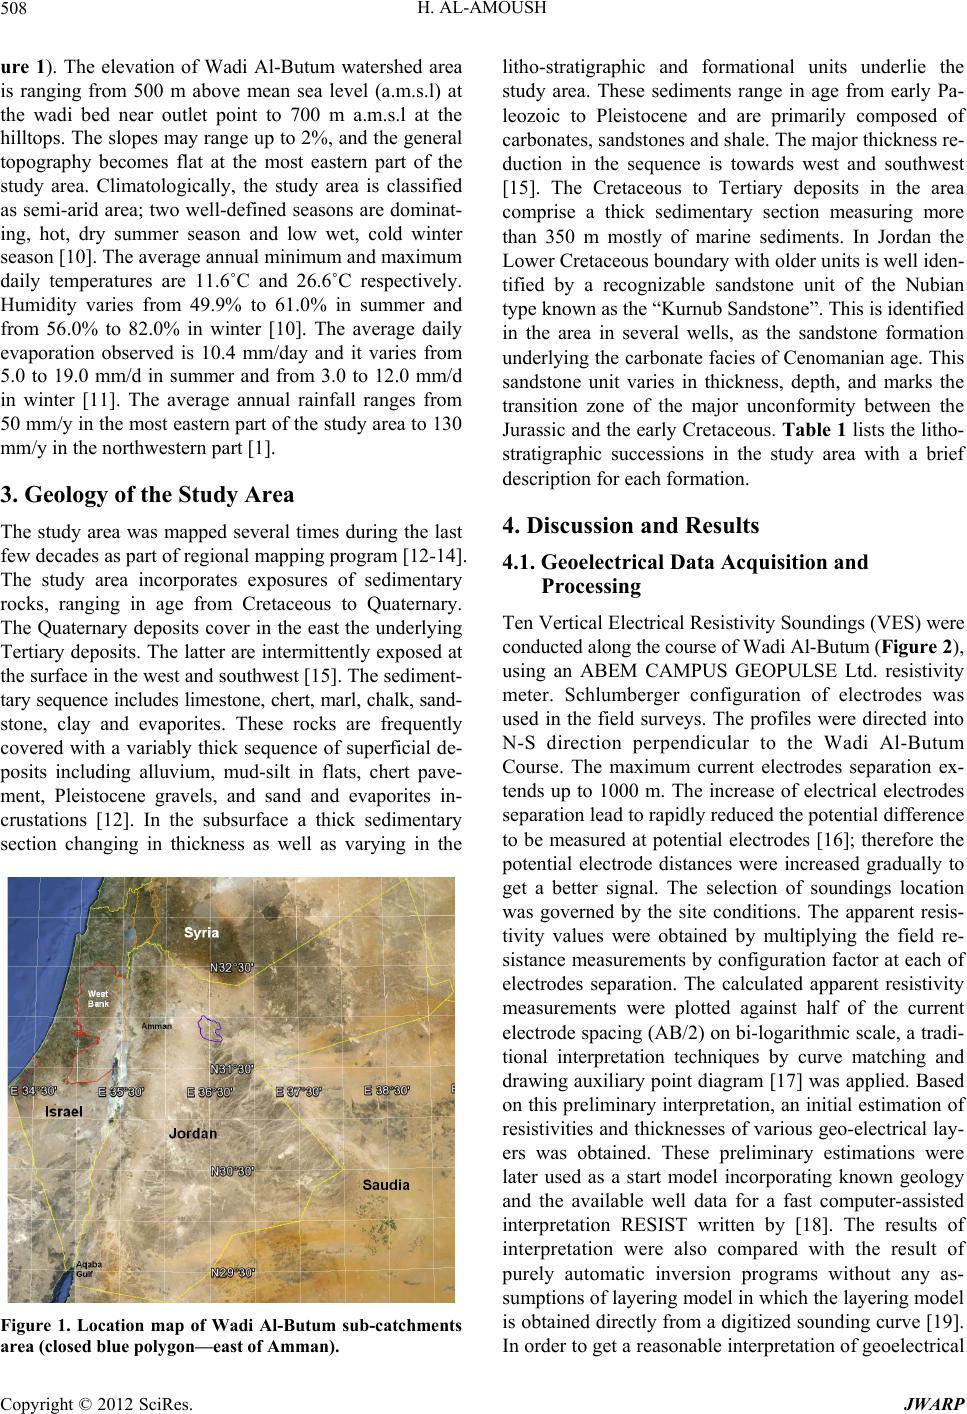 H. AL-AMOUSH 508 ure 1). The elevation of Wadi Al-Butum watershed area is ranging from 500 m above mean sea level (a.m.s.l) at the wadi bed near outlet point to 700 m a.m.s.l at the hilltops. The slopes may range up to 2%, and the general topography becomes flat at the most eastern part of the study area. Climatologically, the study area is classified as semi-arid area; two well-defined seasons are dominat- ing, hot, dry summer season and low wet, cold winter season [10]. The average annual minimum and maximum daily temperatures are 11.6˚C and 26.6˚C respectively. Humidity varies from 49.9% to 61.0% in summer and from 56.0% to 82.0% in winter [10]. The average daily evaporation observed is 10.4 mm/day and it varies from 5.0 to 19.0 mm/d in summer and from 3.0 to 12.0 mm/d in winter [11]. The average annual rainfall ranges from 50 mm/y in the most eastern part of the study area to 130 mm/y in the northwestern part [1]. 3. Geology of the Study Area The study area was mapped several times during the last few decades as part of regional mapping program [12-14]. The study area incorporates exposures of sedimentary rocks, ranging in age from Cretaceous to Quaternary. The Quaternary deposits cover in the east the underlying Tertiary deposits. The latter are intermittently exposed at the surface in the west and southwest [15]. The sediment- tary sequence includes limestone, chert, marl, chalk, sand- stone, clay and evaporites. These rocks are frequently covered with a variably thick sequence of superficial de- posits including alluvium, mud-silt in flats, chert pave- ment, Pleistocene gravels, and sand and evaporites in- crustations [12]. In the subsurface a thick sedimentary section changing in thickness as well as varying in the Figure 1. Location map of Wadi Al-Butum sub-catchments area (closed blue polygon—east of Amman). litho-stratigraphic and formational units underlie the study area. These sediments range in age from early Pa- leozoic to Pleistocene and are primarily composed of carbonates, sandstones and shale. The major thickness re- duction in the sequence is towards west and southwest [15]. The Cretaceous to Tertiary deposits in the area comprise a thick sedimentary section measuring more than 350 m mostly of marine sediments. In Jordan the Lower Cretaceous boundary with older units is well iden- tified by a recognizable sandstone unit of the Nubian type known as the “Kurnub Sandstone”. This is identified in the area in several wells, as the sandstone formation underlying the carbonate facies of Cenomanian age. This sandstone unit varies in thickness, depth, and marks the transition zone of the major unconformity between the Jurassic and the early Cretaceous. Table 1 lists the litho- stratigraphic successions in the study area with a brief description for each formation. 4. Discussion and Results 4.1. Geoelectrical Data Acquisition and Processing Ten Vertical Electrical Resistivity Soundings (VES) were conducted along the course of Wadi Al-Butum (Figure 2), using an ABEM CAMPUS GEOPULSE Ltd. resistivity meter. Schlumberger configuration of electrodes was used in the field surveys. The profiles were directed into N-S direction perpendicular to the Wadi Al-Butum Course. The maximum current electrodes separation ex- tends up to 1000 m. The increase of electrical electrodes separation lead to rapidly reduced the potential difference to be measured at potential electrodes [16]; therefore the potential electrode distances were increased gradually to get a better signal. The selection of soundings location was governed by the site conditions. The apparent resis- tivity values were obtained by multiplying the field re- sistance measurements by configuration factor at each of electrodes separation. The calculated apparent resistivity measurements were plotted against half of the current electrode spacing (AB/2) on bi-logarithmic scale, a tradi- tional interpretation techniques by curve matching and drawing auxiliary point diagram [17] was applied. Based on this preliminary interpretation, an initial estimation of resistivities and thicknesses of various geo-electrical lay- ers was obtained. These preliminary estimations were later used as a start model incorporating known geology and the available well data for a fast computer-assisted interpretation RESIST written by [18]. The results of interpretation were also compared with the result of purely automatic inversion programs without any as- sumptions of layering model in which the layering model is obtained directly from a digitized sounding curve [19]. In order to get a reasonable interpretation of geoelectrical Copyright © 2012 SciRes. JWARP  H. AL-AMOUSH Copyright © 2012 SciRes. JWARP 509 Table 1. Litho-strartigraphic successions in the study area (after [13,14]). Formation name Rock type and thickness (m) Age Alluvium and Mudflat Mud, laminated silt and clay Recent Holocene to Recent Sediments Alluvium and wadi sediment Sand, sorted and unsorted pebble and boulders of limestone and chert of local bedrock Recent Superficial deposits Fluviatile and lacustrine Gravels of Pleistocene/composed of non-cemented, poorly-sorted deposit of chert and limestone clasts Recent Wadi shallaleh chalk formation (B5) Chalk, marl, glauconitic and micritic limestone, (10 - 22) m in the central part of the study area Eocene Um Rijam chert limestone formation (B4) Chert, chalk, limestone, chalky limestone (80 - 130) m Paleocene Muwaqqar chalk marl F. (B3) Chalk, limestone, marly chalk, chert, bituminous (70 - 200) m Campanian-Danian Amman F. (B2) Limestone, chert, chalk, phosphatic (80 - 90) m Campanian Ghudran F. (B1) Belqa group Chalk, marl, marly-limestone (10 - 12) m NW of the study area Coniacian-Santonian Wadi El-Sir (A7) Crystalline limestone, marl, chert (90 - 100) m Touranian Upper Cenomanian Fuheis/Hummar/Shuieb (F/H/S) formations (A3 - A6) Marl, marly limestone Na’ur (A1/2) Ajlun group Upper-mid Cenomanian Lower-mid Cenomanian Thick bedded nodular dolomitic limestone, chert, marl Lower Cenomanian Figure 2. Location map of geoelectrical test sites and groundwater wells. measurements about the hydro-geological setting of the study area, a correlation between the available borehole log records in the vicinity of surveyed sites have been constructed (Figure 3) and used in deducing the Litholo- gical—resistivity interpretation A Summary list of the interpreted geo-electrical models for VES soundings are presented in Table 2, while (Figures 4-6) show three examples of VES curves and their geophysical interpre- tation. 4.2. Interpretation of Geoelectrical Resistivity Data Figure 7 shows geoelectrical cross section along a part of the course of wadi Al-Butum area constructed from a series of vertical electrical soundings and correlated with adjacent borehole F1274. The interpretation of resistivity data led to the following findings: The resistivity of the near surface layer is ranging be- tween 320 and 2000 Ohm.m that characterize and typi- cally indicative to alluvium deposits (gravel, sand). This layer reaches its maximum thickness between VES6 and VES4 (35 m), and does not exposed at VES1. This layer is considered of high potential for groundwater recharge. A relatively high resistivity layer (290 - 935) Ohm.m is found beneath VES10, VES5m, VES2 and VES1. The maximum thickness of this layer is found at VES5 (20 m). This layer is interpreted as paleo-channel alluvial deposits (Figure 2, location map) and it is considered of high potential for groundwater recharge. Low resistivity layer (15 - 18) Ohm.m has been de- tected at depth of 45 m below ground surface at VES9 and VES8. The maximum thickness of this layer (35 m) has been recorded at VES9 and does not detected at the other VES sites along the section. This layer is inter- preted as a saturated layer of saline groundwater which account for the high salinity of F1274 borehole (1750 μS/cm) (Table 3). The resistivity range (35 - 150) Ohm.m extending all over the geoelectrical section (e.g. at depth 38 m beneath VES7, VES8 and VES9, 44 m beneath VES6 and 60 m beneath VES5) is interpreted as the main aquifer to be recharged (Rijam aquifer, B4) in the study area. The va- riation of resistivity reflects lithological variation and de- gree of saturation within the aquifer. Two prominent high resistivity layers (500 - 15,000)  H. AL-AMOUSH 510 B4 B3 F1172 B3 B4 / B5 B4 B3 F1274 West 600m 500m Rijam Formation East Alluvial Deposits Muwaqqar Form ation 400m Elevation 300m 200m B4: B3: B5: Shallaleh Formation F1054 Alluvium deposits Figure 3. Correlation of the available borehole log records in vicinity of geoelectrical test sites illustrating the hydro-geologi- cal setting of the study area. Figure 4. Modeling of a sounding point VES-5: measured apparent resistivity (blue dots), best-fit model (tabulated and as a graph in logarithmic scale) and related curve model (full line) are shown. Figure 5. Modeling of a sounding VES-9: measured apparent resistivity (blue dots), best-fit model (tabulated and as a graph in logarithmic scale) and related curve model (full line) are shown. Copyright © 2012 SciRes. JWARP 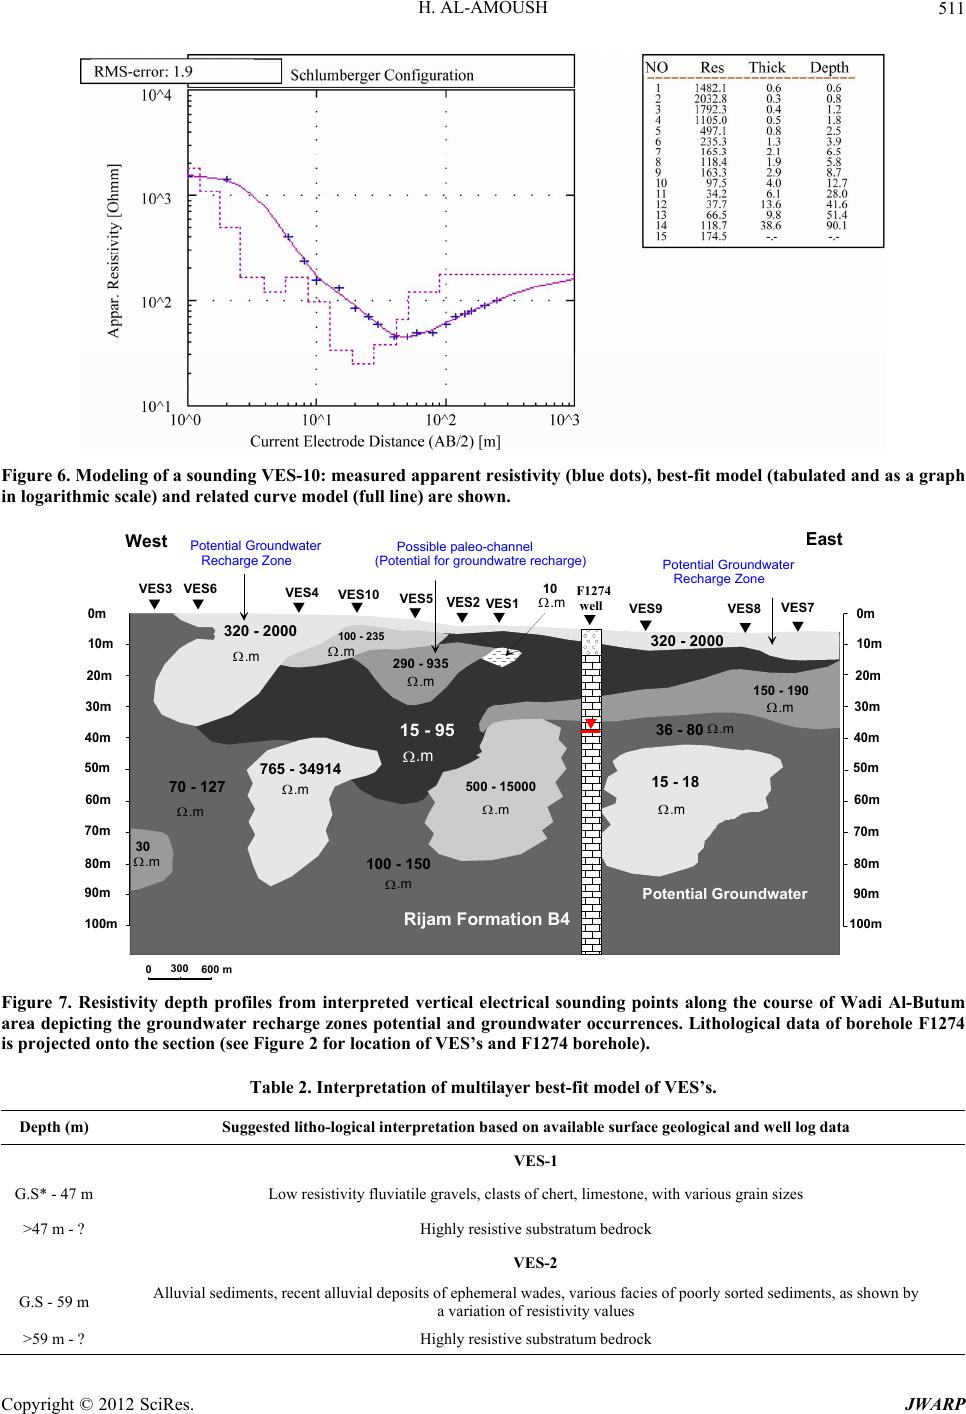 H. AL-AMOUSH 511 Figure 6. Modeling of a sounding VES-10: measured apparent resistivity (blue dots), best-fit model (tabulated and as a graph in logarithmic scale) and related curve model (full line) are shown. 40m 50m 60m 70m 80m 90m 100m 30m 20m 10m 0m VES1 VES6 VES4 285 VES10 VES5 VES2 VES9 VES8 VES3 VES7 625-1317 320 - 2000 70 - 127 .m 15 - 95 500 - 15000 765 - 34914 .m 290 - 935 .m 15 - 18 .m 15 100 - 235 .m 100 - 150 10 .m 0 - 190 .m 30 .m .m .m .m 320 - 2000 West 40m 50m 60m 70m 80m 90m 100m 30m 20m 10m East F1274 well Rijam Formation B4 36 - 80 .m .m 0 300 600 m Potential Ground Potential Groundwater Recharge Zone water Potenti al Groundwa Recharge Zone 0m ter Possible paleo-channel (Potential for groundwatre recharge) Figure 7. Resistivity depth profiles from interpreted vertical electrical sounding points along the course of Wadi Al-Butum area depicting the groundwater recharge zones potential and groundwater occurrences. Lithological data of borehole F1274 is projected onto the section (see Figure 2 for location of VES’s and F1274 borehole). Table 2. Interpretation of multilayer best-fit model of VES’s. Depth (m) Suggested litho-logical interpretation based on available surface geological and well log data VES-1 G.S* - 47 m Low resistivity fluviatile gravels, clasts of chert, limestone, with various grain sizes >47 m - ? Highly resistive substratum bedrock VES-2 G.S - 59 m Alluvial sediments, recent alluvial deposits of ephemeral wades, various facies of poorly sorted sediments, as shown by a variation of resistivity values >59 m - ? Highly resistive substratum bedrock Copyright © 2012 SciRes. JWARP 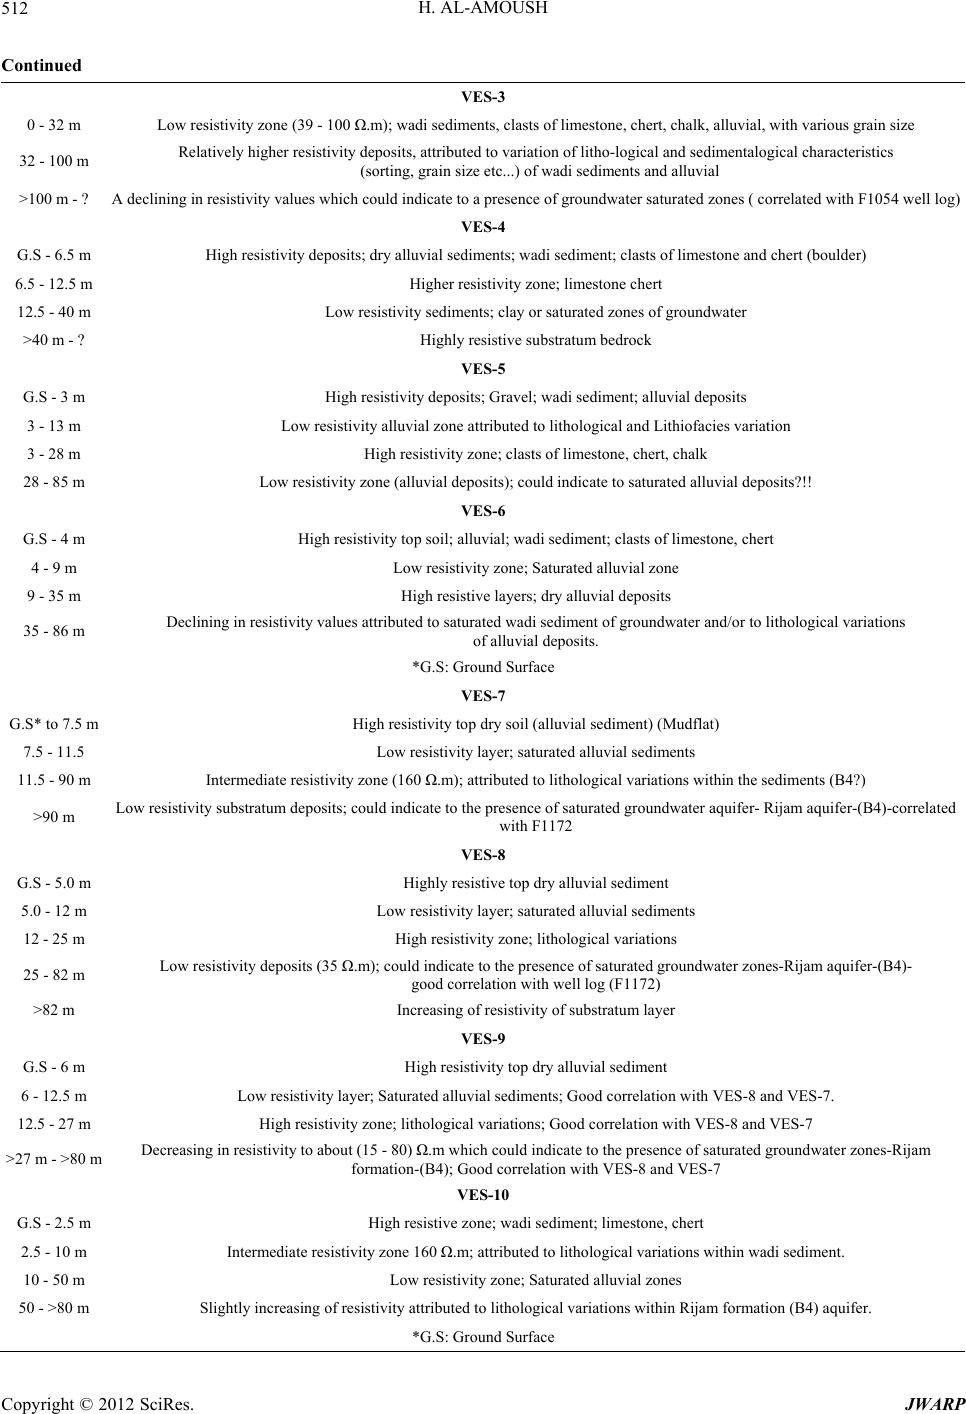 H. AL-AMOUSH 512 Continued VES-3 0 - 32 m Low resistivity zone (39 - 100 Ω.m); wadi sediments, clasts of limestone, chert, chalk, alluvial, with various grain size 32 - 100 m Relatively higher resistivity deposits, attributed to variation of litho-logical and sedimentalogical characteristics (sorting, grain size etc...) of wadi sediments and alluvial >100 m - ? A declining in resistivity values which could indicate to a presence of groundwater saturated zones ( correlated with F1054 well log) VES-4 G.S - 6.5 m High resistivity deposits; dry alluvial sediments; wadi sediment; clasts of limestone and chert (boulder) 6.5 - 12.5 m Higher resistivity zone; limestone chert 12.5 - 40 m Low resistivity sediments; clay or saturated zones of groundwater >40 m - ? Highly resistive substratum bedrock VES-5 G.S - 3 m High resistivity deposits; Gravel; wadi sediment; alluvial deposits 3 - 13 m Low resistivity alluvial zone attributed to lithological and Lithiofacies variation 3 - 28 m High resistivity zone; clasts of limestone, chert, chalk 28 - 85 m Low resistivity zone (alluvial deposits); could indicate to saturated alluvial deposits?!! VES-6 G.S - 4 m High resistivity top soil; alluvial; wadi sediment; clasts of limestone, chert 4 - 9 m Low resistivity zone; Saturated alluvial zone 9 - 35 m High resistive layers; dry alluvial deposits 35 - 86 m Declining in resistivity values attributed to saturated wadi sediment of groundwater and/or to lithological variations of alluvial deposits. *G.S: Ground Surface VES-7 G.S* to 7.5 m High resistivity top dry soil (alluvial sediment) (Mudflat) 7.5 - 11.5 Low resistivity layer; saturated alluvial sediments 11.5 - 90 m Intermediate resistivity zone (160 Ω.m); attributed to lithological variations within the sediments (B4?) >90 m Low resistivity substratum deposits; could indicate to the presence of saturated groundwater aquifer- Rijam aquifer-(B4)-correlated with F1172 VES-8 G.S - 5.0 m Highly resistive top dry alluvial sediment 5.0 - 12 m Low resistivity layer; saturated alluvial sediments 12 - 25 m High resistivity zone; lithological variations 25 - 82 m Low resistivity deposits (35 Ω.m); could indicate to the presence of saturated groundwater zones-Rijam aquifer-(B4)- good correlation with well log (F1172) >82 m Increasing of resistivity of substratum layer VES-9 G.S - 6 m High resistivity top dry alluvial sediment 6 - 12.5 m Low resistivity layer; Saturated alluvial sediments; Good correlation with VES-8 and VES-7. 12.5 - 27 m High resistivity zone; lithological variations; Good correlation with VES-8 and VES-7 >27 m - >80 m Decreasing in resistivity to about (15 - 80) Ω.m which could indicate to the presence of saturated groundwater zones-Rijam formation-(B4); Good correlation with VES-8 and VES-7 VES-10 G.S - 2.5 m High resistive zone; wadi sediment; limestone, chert 2.5 - 10 m Intermediate resistivity zone 160 Ω.m; attributed to lithological variations within wadi sediment. 10 - 50 m Low resistivity zone; Saturated alluvial zones 50 - >80 m Slightly increasing of resistivity attributed to lithological variations within Rijam formation (B4) aquifer. *G.S: Ground Surface Copyright © 2012 SciRes. JWARP 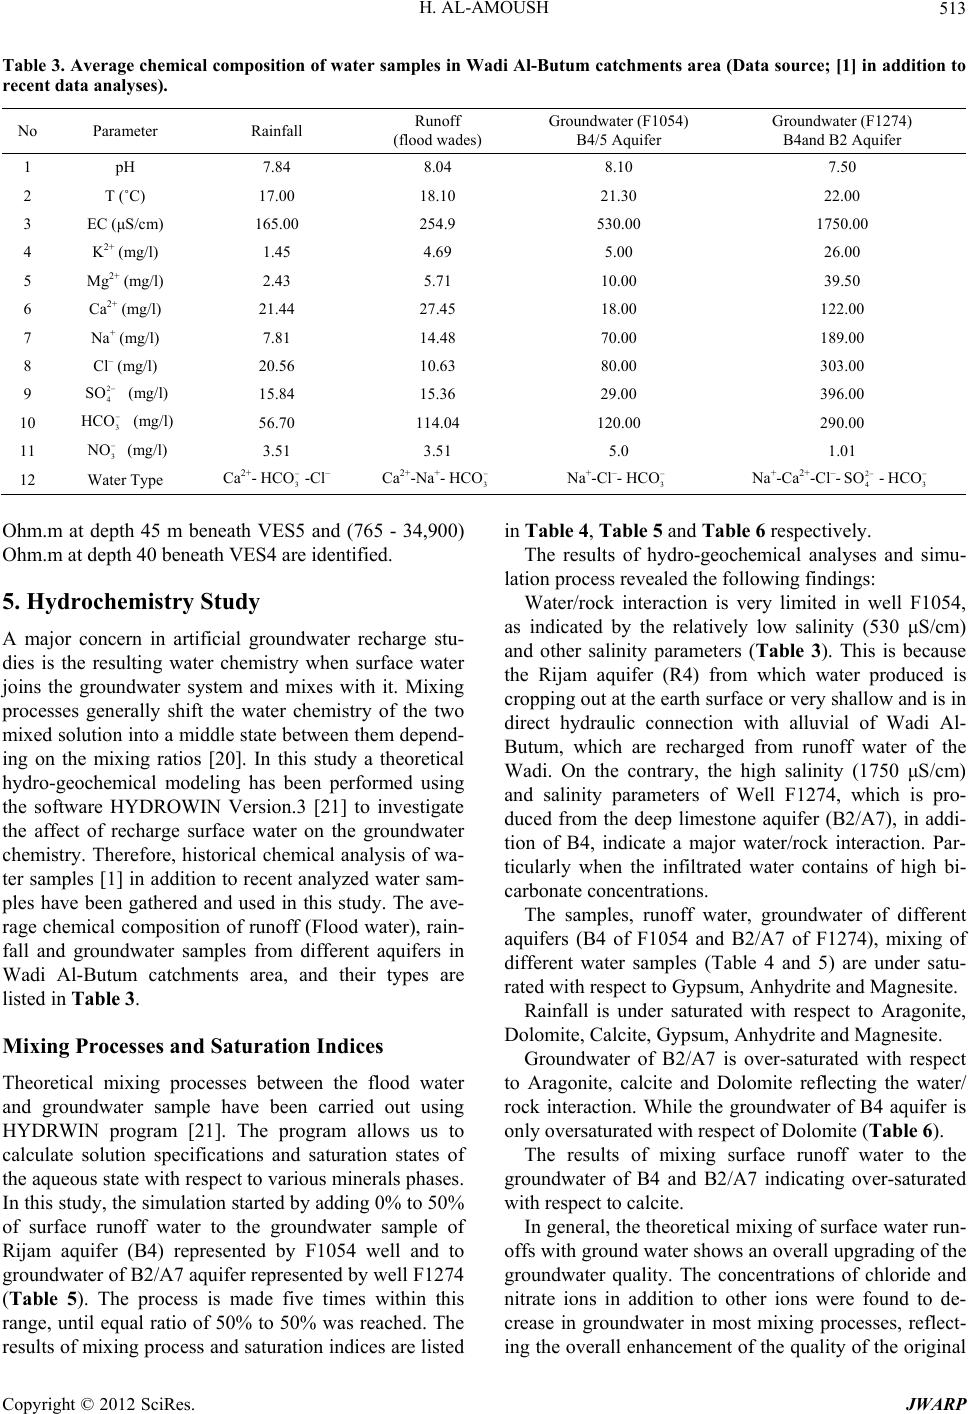 H. AL-AMOUSH Copyright © 2012 SciRes. JWARP 513 Table 3. Average chemical composition of water samples in Wadi Al-Butum catchments area (Data source; [1] in addition to recent data analyses). No Parameter Rainfall Runoff (flood wades) Groundwater (F1054) B4/5 Aquifer Groundwater (F1274) B4and B2 Aquifer 1 pH 7.84 8.04 8.10 7.50 2 T (˚C) 17.00 18.10 21.30 22.00 3 EC (μS/cm) 165.00 254.9 530.00 1750.00 4 K2+ (mg/l) 1.45 4.69 5.00 26.00 5 Mg2+ (mg/l) 2.43 5.71 10.00 39.50 6 Ca2+ (mg/l) 21.44 27.45 18.00 122.00 7 Na+ (mg/l) 7.81 14.48 70.00 189.00 8 Cl– (mg/l) 20.56 10.63 80.00 303.00 9 2 4 SO 3 HCO 3 NO 3 HCO 3 HCO (mg/l) 15.84 15.36 29.00 396.00 10 (mg/l) 56.70 114.04 120.00 290.00 11 (mg/l) 3.51 3.51 5.0 1.01 12 Water Type Ca2+--Cl– Ca2+-Na+- Na+-Cl–-3 HCO Na+-Ca2+-Cl–- - 2 4 SO 3 HCO Ohm.m at depth 45 m beneath VES5 and (765 - 34,900) Ohm.m at depth 40 beneath VES4 are identified. 5. Hydrochemistry Study A major concern in artificial groundwater recharge stu- dies is the resulting water chemistry when surface water joins the groundwater system and mixes with it. Mixing processes generally shift the water chemistry of the two mixed solution into a middle state between them depend- ing on the mixing ratios [20]. In this study a theoretical hydro-geochemical modeling has been performed using the software HYDROWIN Version.3 [21] to investigate the affect of recharge surface water on the groundwater chemistry. Therefore, historical chemical analysis of wa- ter samples [1] in addition to recent analyzed water sam- ples have been gathered and used in this study. The ave- rage chemical composition of runoff (Flood water), rain- fall and groundwater samples from different aquifers in Wadi Al-Butum catchments area, and their types are listed in Table 3. Mixing Processes and Saturation Indices Theoretical mixing processes between the flood water and groundwater sample have been carried out using HYDRWIN program [21]. The program allows us to calculate solution specifications and saturation states of the aqueous state with respect to various minerals phases. In this study, the simulation started by adding 0% to 50% of surface runoff water to the groundwater sample of Rijam aquifer (B4) represented by F1054 well and to groundwater of B2/A7 aquifer represented by well F1274 (Table 5). The process is made five times within this range, until equal ratio of 50% to 50% was reached. The results of mixing process and saturation indices are listed in Table 4, Table 5 and Table 6 respectively. The results of hydro-geochemical analyses and simu- lation process revealed the following findings: Water/rock interaction is very limited in well F1054, as indicated by the relatively low salinity (530 μS/cm) and other salinity parameters (Table 3). This is because the Rijam aquifer (R4) from which water produced is cropping out at the earth surface or very shallow and is in direct hydraulic connection with alluvial of Wadi Al- Butum, which are recharged from runoff water of the Wadi. On the contrary, the high salinity (1750 μS/cm) and salinity parameters of Well F1274, which is pro- duced from the deep limestone aquifer (B2/A7), in addi- tion of B4, indicate a major water/rock interaction. Par- ticularly when the infiltrated water contains of high bi- carbonate concentrations. The samples, runoff water, groundwater of different aquifers (B4 of F1054 and B2/A7 of F1274), mixing of different water samples (Table 4 and 5) are under satu- rated with respect to Gypsum, Anhydrite and Magnesite. Rainfall is under saturated with respect to Aragonite, Dolomite, Calcite, Gypsum, Anhydrite and Magnesite. Groundwater of B2/A7 is over-saturated with respect to Aragonite, calcite and Dolomite reflecting the water/ rock interaction. While the groundwater of B4 aquifer is only oversaturated with respect of Dolomite (Table 6). The results of mixing surface runoff water to the groundwater of B4 and B2/A7 indicating over-saturated with respect to calcite. In general, the theoretical mixing of surface water run- offs with ground water shows an overall upgrading of the groundwater quality. The concentrations of chloride and nitrate ions in addition to other ions were found to de- crease in groundwater in most mixing processes, reflect- ing the overall enhancement of the quality of the original 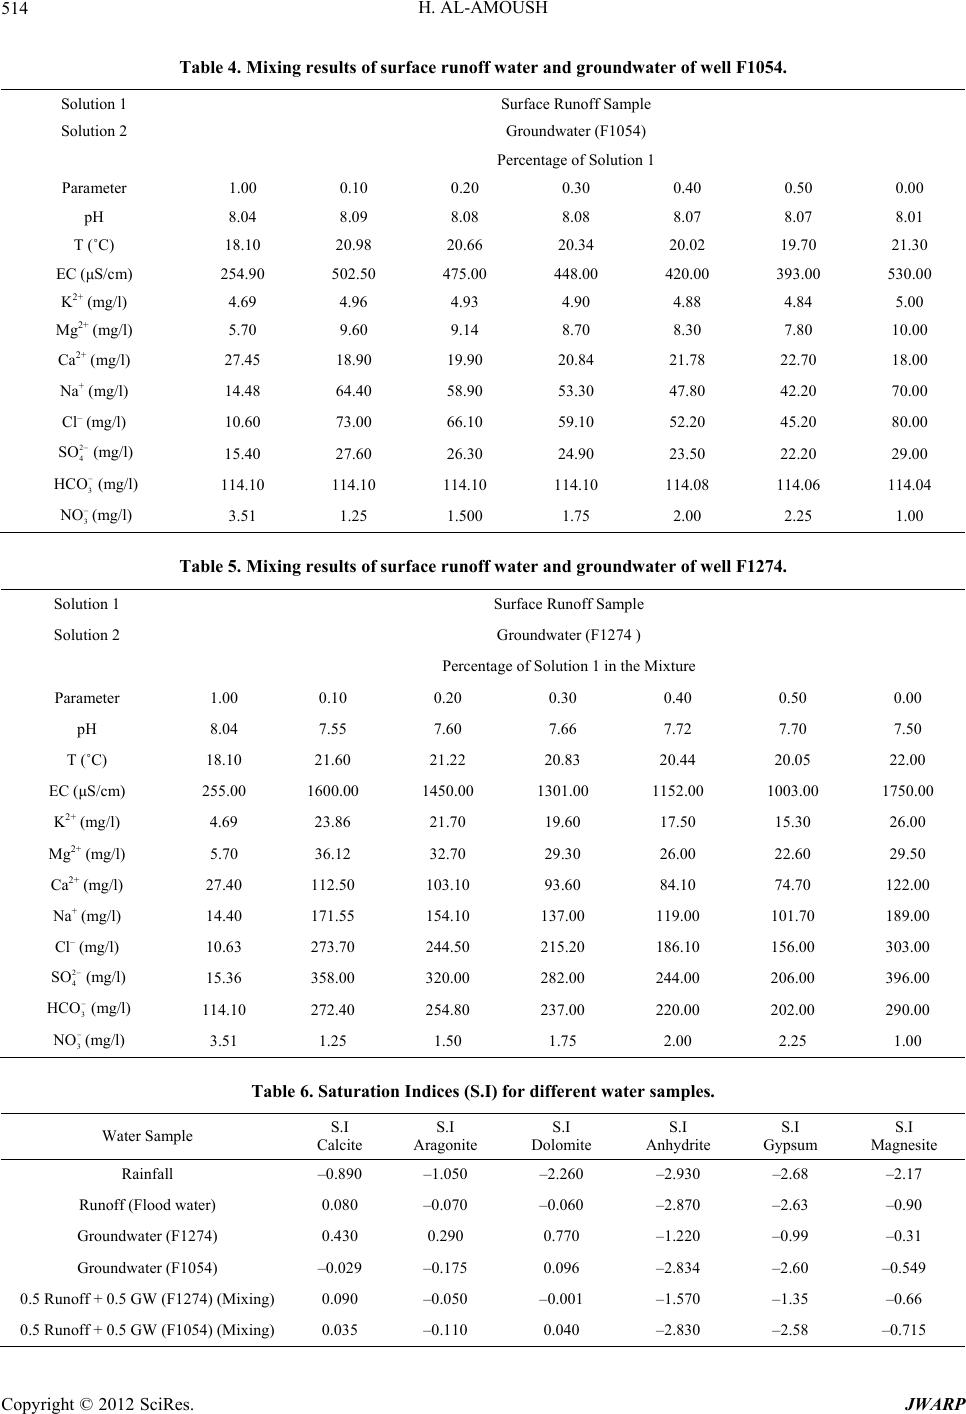 H. AL-AMOUSH 514 Table 4. Mixing results of surface runoff water and groundwater of well F1054. Solution 1 Surface Runoff Sample Solution 2 Groundwater (F1054) Percentage of Solution 1 Parameter 1.00 0.10 0.20 0.30 0.40 0.50 0.00 pH 8.04 8.09 8.08 8.08 8.07 8.07 8.01 T (˚C) 18.10 20.98 20.66 20.34 20.02 19.70 21.30 EC (μS/cm) 254.90 502.50 475.00 448.00 420.00 393.00 530.00 K2+ (mg/l) 4.69 4.96 4.93 4.90 4.88 4.84 5.00 Mg2+ (mg/l) 5.70 9.60 9.14 8.70 8.30 7.80 10.00 Ca2+ (mg/l) 27.45 18.90 19.90 20.84 21.78 22.70 18.00 Na+ (mg/l) 14.48 64.40 58.90 53.30 47.80 42.20 70.00 Cl– (mg/l) 10.60 73.00 66.10 59.10 52.20 45.20 80.00 2 4 SO 3 HCO 3 NO (mg/l) 15.40 27.60 26.30 24.90 23.50 22.20 29.00 (mg/l) 114.10 114.10 114.10 114.10 114.08 114.06 114.04 (mg/l) 3.51 1.25 1.500 1.75 2.00 2.25 1.00 Table 5. Mixing results of surface runoff water and groundwater of well F1274. Solution 1 Surface Runoff Sample Solution 2 Groundwater (F1274 ) Percentage of Solution 1 in the Mixture Parameter 1.00 0.10 0.20 0.30 0.40 0.50 0.00 pH 8.04 7.55 7.60 7.66 7.72 7.70 7.50 T (˚C) 18.10 21.60 21.22 20.83 20.44 20.05 22.00 EC (μS/cm) 255.00 1600.00 1450.00 1301.00 1152.00 1003.00 1750.00 K2+ (mg/l) 4.69 23.86 21.70 19.60 17.50 15.30 26.00 Mg2+ (mg/l) 5.70 36.12 32.70 29.30 26.00 22.60 29.50 Ca2+ (mg/l) 27.40 112.50 103.10 93.60 84.10 74.70 122.00 Na+ (mg/l) 14.40 171.55 154.10 137.00 119.00 101.70 189.00 Cl– (mg/l) 10.63 273.70 244.50 215.20 186.10 156.00 303.00 2 4 SO 3 HCO 3 NO (mg/l) 15.36 358.00 320.00 282.00 244.00 206.00 396.00 (mg/l) 114.10 272.40 254.80 237.00 220.00 202.00 290.00 (mg/l) 3.51 1.25 1.50 1.75 2.00 2.25 1.00 Table 6. Saturation Indices (S.I) for different water samples. Water Sample S.I Calcite S.I Aragonite S.I Dolomite S.I Anhydrite S.I Gypsum S.I Magnesite Rainfall –0.890 –1.050 –2.260 –2.930 –2.68 –2.17 Runoff (Flood water) 0.080 –0.070 –0.060 –2.870 –2.63 –0.90 Groundwater (F1274) 0.430 0.290 0.770 –1.220 –0.99 –0.31 Groundwater (F1054) –0.029 –0.175 0.096 –2.834 –2.60 –0.549 0.5 Runoff + 0.5 GW (F1274) (Mixing) 0.090 –0.050 –0.001 –1.570 –1.35 –0.66 0.5 Runoff + 0.5 GW (F1054) (Mixing) 0.035 –0.110 0.040 –2.830 –2.58 –0.715 Copyright © 2012 SciRes. JWARP  H. AL-AMOUSH 515 groundwater. 6. Conclusions Ten vertical electrical resistivity soundings (VES) have been used to investigate the subsurface hydro-geological conditions (to a depth of about 100 m) in Wadi Al-Butum sub-catchments area for groundwater artificial recharge purposes. Adjacent boreholes, historical and recent ana- lyzed chemical analyses of rainfall, surface water and groundwater of two aquifer types’ samples were also available. Interpretation of geoelectrical data indicates the pre- sence of near-surface potential layer of alluvial deposits to store and recharge the shallow limestone aquifer. The thickness of this layer was found to be 35 m in the west- ern part of study area (beneath VES4) and around 10 m at the most eastern part at VES7. Moreover, a highly po- tential alluvial paleo-channel deposits (20 m) for ground- water recharged is found at VES5. The results of hydro- geochemical modeling, saturation indices and rock/water interactions indicate an overall enhancement of the origi- nal ground quality could be expected. 7. Acknowledgements The author sincerely acknowledges Prof. Elias Salameh from university of Jordan for the great valuable collabo- ration and suggestions. Special thanks for my colleagues Adnan Rizg, Mo’ns Al-Alwneh and Majdi Al-Sirhan for their great cooperation during field works. Critical and constructive review of the manuscript by the reviewers is greatly treasured. REFERENCES [1] Ministry of Water and Irrigation (MWI) Open Files, Jor- dan, 2011. www.mwi.gov.jo [2] E. N. Salameh and H. Bannayan, “Water Resources of Jordan. Present Status and Future potentials,” Fridrich Ebert Stiftung, Amman, Jordan, 1993. [3] R. A. Al-Adamat, “GIS as a Decision Support System for Siting Water Harvesting Ponds in Jordan,” Journal of En - vironmental Assessment Policy and Management, Vol. 10, No. 2, 2008, pp. 189-206. doi:10.1142/S1464333208003020 [4] UNPD, “Sustaining Water: An Update World Population Prospects, the 1994 Revision. The United Nations, New York,” In: M. Shahin, Ed., Water Resources and Hydro- meteorology of the Arab Region, Netherlands, 2007, pp. 525-526. [5] A. R. Freeze and A. J. Cherry, “Groundwater,” Prentice- Hall, Englewood Cliffs, 1979. [6] M. Shahin, “Water Resources and Hydrometeorology of the Arab Region,” Springer, the Netherlands, 2007. [7] M. F. Abu-Taleb, “The Use of Infiltration Field Tests for Groundwater Artificial Recharge,” Environmental Geology, Vol. 37, 1999, pp. 64-71. doi:10.1007/s002540050361 [8] M. Israil, M. Al-hadithi and D. C. Singhal, “Application of a Resistivity Survey and Geographical Information System (GIS) Analysis for Hydro-Geological Zoning of a Piedmont Area, Himalayan Foothill Region, India,” Hy- drogeology Journal, Vol. 14, 2006, pp. 753-759. doi:10.1007/s10040-005-0483-0 [9] H. R. Al-Amoush, “Hydro-Geophysical Investigations for the Purposes of Groundwater Artificial Recharge in the Jordan Valley Area,” Ph.D. Dissertation, University of Jordan, Amman, 2006. [10] Department of Meteorology (DOM) Open Files, Jordan, 2011. [11] Department of Meteorology (DOM) Open Files, Jordan, 2003. [12] A. Quennell, “The Structure and Evolution of the Dead Sea Rift,” Quarterly Journal of the Geological Society, Vol. 64, 1959, pp. 1-24. [13] S. M. McDonald and Partners in Cooperation with Hunt- ing Geological Survey Limited, “East Bank Water Re- sources,” Ministry of Water and Irrigation, Amman, Vol. 5, 1965, p. 512. [14] Natural Resources Authority (NRA) Open Files, Jordan 2004. [15] J. H. Powell, “Stratigraphy and Sedimentation of the Phanerozoic Rocks in Central and South Jordan: Part B- Kurnub, Ajlun and Belqa Groups,” Natural Resources Authority (NRA), Amman, Geological mapping Division, Bulletin 11B, 1989, 130 p. [16] R. Kirsch and K. Ernstson, “Geoelectrical Methods,” In: R. Kirsch, Ed., Groundwater Geophysics, a Tool for Hydrogeology, Germany, 2006, pp. 85-116. [17] E. Orenella and H. M. Mooney, “Master Tables and Curves for Vertical Electrical Sounding over Layered Structures,” Interciencia, Madrid, 34 p. [18] B. P. A. Vander Velpen and R. J. Sporry, “RESIST. A Computer Program to Process Resistivity Sounding Data on PC Compatibles,” Computer and Geosciences, Vol. 19, No. 5, 1993, pp. 691-703. doi:10.1016/0098-3004(93)90102-B [19] A. Zohdy and R. J. Bisdorf, “Programs for the Automatic Processing and Interpretation of Schlumberger Sounding Curves in Quick Basic. U.S.G.S,” Open File Report, 89- 137-2, 1989, 64 p. [20] A. L. Bloom, “Geomorphology a Systematic Analysis of Late Cenozoic Land Forms,” Prentice Hall, Englewood Cliffs, 1978. [21] L. Calmbach, “HYDROWIN Software Version 3,” Insti- tute de Mineralogy, Lausanne, 1995. Copyright © 2012 SciRes. JWARP |