

Paper Menu >>
Journal Menu >>
 Journal of Water Resource and Protection, 2012, 4, 487-492 http://dx.doi.org/10.4236/jwarp.2012.47056 Published Online July 2012 (http://www.SciRP.org/journal/jwarp) The Preparation and Performance Study of a Phosphate-Free Corrosion/Scale Inhibitor Defang Zeng*, Wei Zhang School of Resource and Environmental Engineering, Wuhan University of Technology, Wuhan, China Email: *[email protected] Received November 29, 2011; revised April 3, 2012; accepted May 7, 2012 ABSTRACT By using acrylic acid copolymer, sodium citrate, hydrolyzed polymaleic anhydride (HPMA), corrosion inhibitor D and Zn2+ synergist as raw materials, a multi-component phosphate-free corrosion and scale inhibitor was developed. The performance of the composite phosphate-free corrosion and scale inhibitor was evaluated using the rotary hanging sheet corrosion test, the static scale inhibition test and the corrosion electrochemical test. And the surface morphology of the carbon steel was observed by scanning electronic microscope (SEM). Orthogonal experiment results indicated that the optimal mass ratios of amino acid: Zn2+ synergist: HPMA: corrosion inhibitor D: acrylic acid copolymer was 0.5:10:12:1:8. It was also observed that phosphate-free corrosion and scale inhibitor based on an anodic reaction through the electrochemical corrosion experiment, its annual corrosion rate and scale inhibition rate reached 0.0176 mm·a–1 and 98.3%, respectively, showing excellent corrosion and scale inhibition performance. Keywords: Phosphate-Free Corrosion/Scale Inhibitor; Static Scale Inhibition Method; SEM; Electrochemical Corrosion 1. Introduction Industrial recirculating cooling water accounts for 60% - 70% in the industrial water, it will result in corrosion, scaling and microbial slime of the equipment and the pipeline as well as reduce their service life without treat- ing. Thus, to treat recirculating cooling water has aroused the concern from the whole society. Organophosphorus compound was a type of corrosion inhibitor extensively used since 1980s. However, it’s di- minishing because of its toxic effects on aquatic and other life [1]. Therefore, the public began to focus on the development of low phosphorus, non-phosphorus and heavy nonmetal salt corrosion and scale inhibitors. On one hand, low phosphorus corrosion and scale inhibitor is developing rapidly, such as 2-phosphono-1,2,4-tricarbo- xylic acid butane (PBTCA) and hydrolyzed polymaleic anhydride (HPMA) [2]. On the other hand, the non-phos- phorus corrosion and scale inhibitor has also obtained new achievements. In this paper, a multi-component phosphate-free cor- rosion and scale inhibitor blend composed of acrylic acid copolymer, sodium citrate, hydrolyzed polymaleic anhy- dride (HPMA), corrosion inhibitor D and Zn2+ synergist was prepared [3-7]. The recirculating cooling water was obtained from water treatment plant. The performance of the phosphate-free corrosion and scale inhibitor was eva- luated by rotary hanging sheet corrosion test and static scale inhibition test. The mechanism of corrosion and scale inhibition was preliminarily investigated by corro- sion electrochemistry test and scanning electron micro- scope (SEM) techniques [8-11]. 2. Experimental 2.1. Main Materials Acrylic acid copolymer, sodium citrate, hydrolyzed poly- maleic anhydride (HPMA), sodium citrate, Zn2+ synergist and anhydrous alcohol. All chemicals were of analytical reagent-grade. 2.2. The Rotary Hanging Sheet Corrosion Test The corrosion rate of A3 type carbon steel was deter- mined by weight loss test. The carbon steel sheets were polished with different grades of emery paper, degreased with anhydrous alcohol, and rinsed with distilled water. Having been dried by electric dry oven and accurately weighed by electronic balance, the carbon steel were im- mersed in a beaker with water sample and with or with- out inhibitors. And the quality index of water sample was presented in Table 1. The beakers were put into the ro- tary hanging piece corrosion test instrument. Experi- mental conditions as follows: 1) constant temperature was 45˚C ± 1˚C; 2) rotating speed was 75 r·min–1; 3) *Corresponding author. C opyright © 2012 SciRes. JWARP 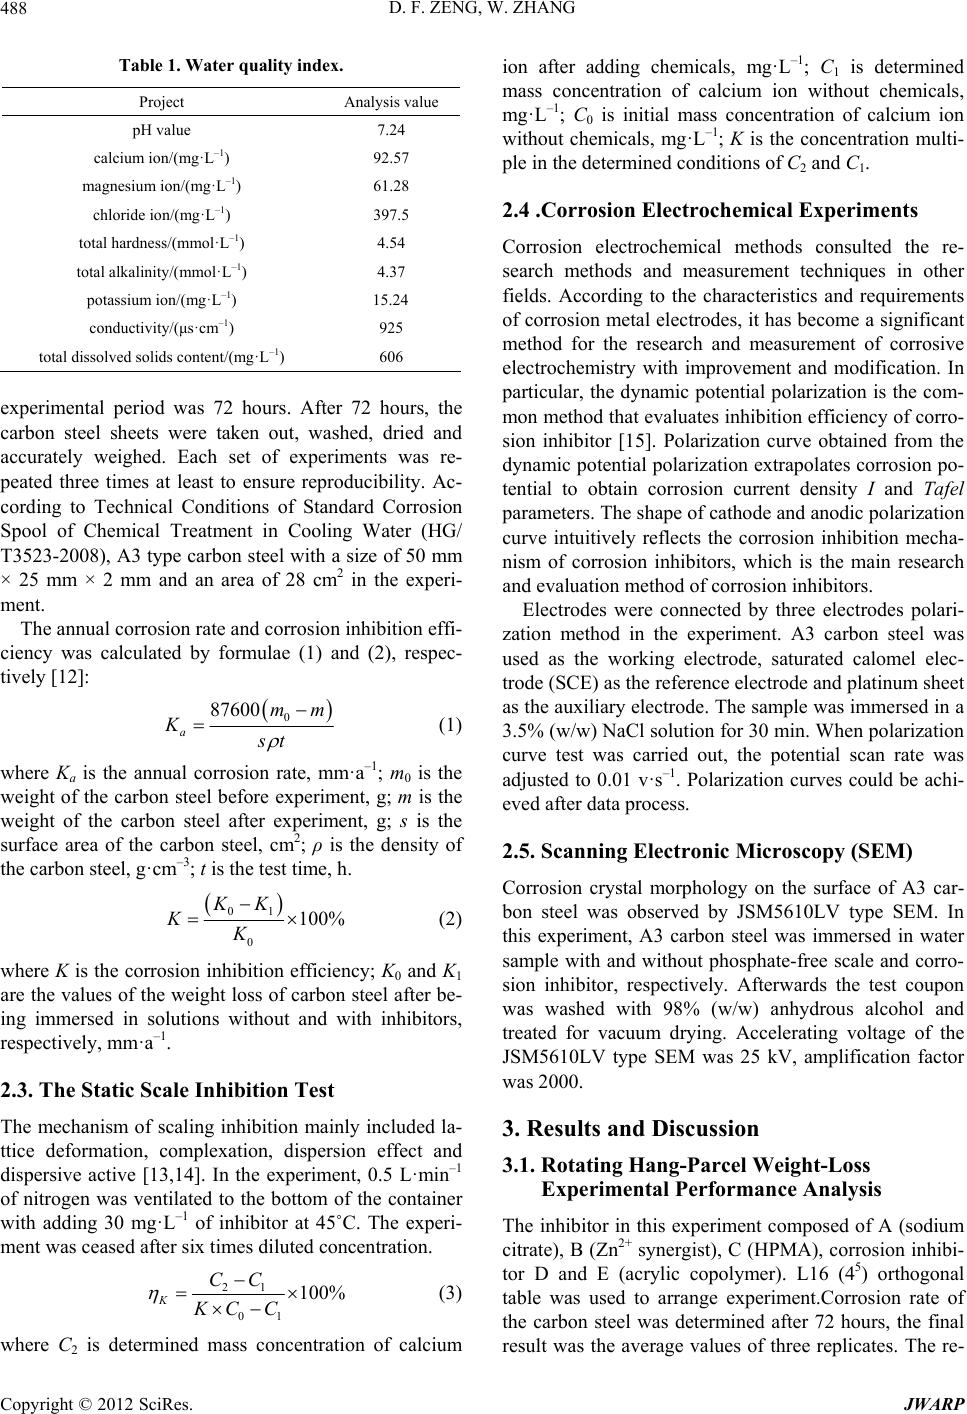 D. F. ZENG, W. ZHANG 488 Table 1. Water quality index. Project Analysis value pH value 7.24 calcium ion/(mg·L–1) 92.57 magnesium ion/(mg·L–1) 61.28 chloride ion/(mg·L–1) 397.5 total hardness/(mmol·L–1) 4.54 total alkalinity/(mmol·L–1) 4.37 potassium ion/(mg·L–1) 15.24 conductivity/(μs·cm–1) 925 total dissolved solids content/(mg·L–1) 606 experimental period was 72 hours. After 72 hours, the carbon steel sheets were taken out, washed, dried and accurately weighed. Each set of experiments was re- peated three times at least to ensure reproducibility. Ac- cording to Technical Conditions of Standard Corrosion Spool of Chemical Treatment in Cooling Water (HG/ T3523-2008), A3 type carbon steel with a size of 50 mm × 25 mm × 2 mm and an area of 28 cm2 in the experi- ment. The annual corrosion rate and corrosion inhibition effi- ciency was calculated by formulae (1) and (2), respec- tively [12]: 0 0mm st 8760 a K (1) where Ka is the annual corrosion rate, mm·a–1; m0 is the weight of the carbon steel before experiment, g; m is the weight of the carbon steel after experiment, g; s is the surface area of the carbon steel, cm2; ρ is the density of the carbon steel, g·cm–3; t is the test time, h. 01 0 100% KKKK (2) where K is the corrosion inhibition efficiency; K0 and K1 are the values of the weight loss of carbon steel after be- ing immersed in solutions without and with inhibitors, respectively, mm·a–1. 2.3. The Static Scale Inhibition Test The mechanism of scaling inhibition mainly included la- ttice deformation, complexation, dispersion effect and dispersive active [13,14]. In the experiment, 0.5 L·min–1 of nitrogen was ventilated to the bottom of the container with adding 30 mg·L–1 of inhibitor at 45˚C. The experi- ment was ceased after six times diluted concentration. 21 01 100% CC C KKC (3) where C2 is determined mass concentration of calcium ion after adding chemicals, mg·L–1; C1 is determined mass concentration of calcium ion without chemicals, mg· L –1; C0 is initial mass concentration of calcium ion without chemicals, mg·L–1; K is the concentration multi- ple in the determined conditions of C2 and C1. 2.4 .Corrosion Electrochemical Experiments Corrosion electrochemical methods consulted the re- search methods and measurement techniques in other fields. According to the characteristics and requirements of corrosion metal electrodes, it has become a significant method for the research and measurement of corrosive electrochemistry with improvement and modification. In particular, the dynamic potential polarization is the com- mon method that evaluates inhibition efficiency of corro- sion inhibitor [15]. Polarization curve obtained from the dynamic potential polarization extrapolates corrosion po- tential to obtain corrosion current density I and Tafel parameters. The shape of cathode and anodic polarization curve intuitively reflects the corrosion inhibition mecha- nism of corrosion inhibitors, which is the main research and evaluation method of corrosion inhibitors. Electrodes were connected by three electrodes polari- zation method in the experiment. A3 carbon steel was used as the working electrode, saturated calomel elec- trode (SCE) as the reference electrode and platinum sheet as the auxiliary electrode. The sample was immersed in a 3.5% (w/w) NaCl solution for 30 min. When polarization curve test was carried out, the potential scan rate was adjusted to 0.01 v·s–1. Polarization curves could be achi- eved after data process. 2.5. Scanning Electronic Microscopy (SEM) Corrosion crystal morphology on the surface of A3 car- bon steel was observed by JSM5610LV type SEM. In this experiment, A3 carbon steel was immersed in water sample with and without phosphate-free scale and corro- sion inhibitor, respectively. Afterwards the test coupon was washed with 98% (w/w) anhydrous alcohol and treated for vacuum drying. Accelerating voltage of the JSM5610LV type SEM was 25 kV, amplification factor was 2000. 3. Results and Discussion 3.1. Rotating Hang-Parcel Weight-Loss Experimental Performance Analysis The inhibitor in this experiment composed of A (sodium citrate), B (Zn2+ synergist), C (HPMA), corrosion inhibi- tor D and E (acrylic copolymer). L16 (45) orthogonal table was used to arrange experiment.Corrosion rate of the carbon steel was determined after 72 hours, the final result was the average values of three replicates. The re- Copyright © 2012 SciRes. JWARP 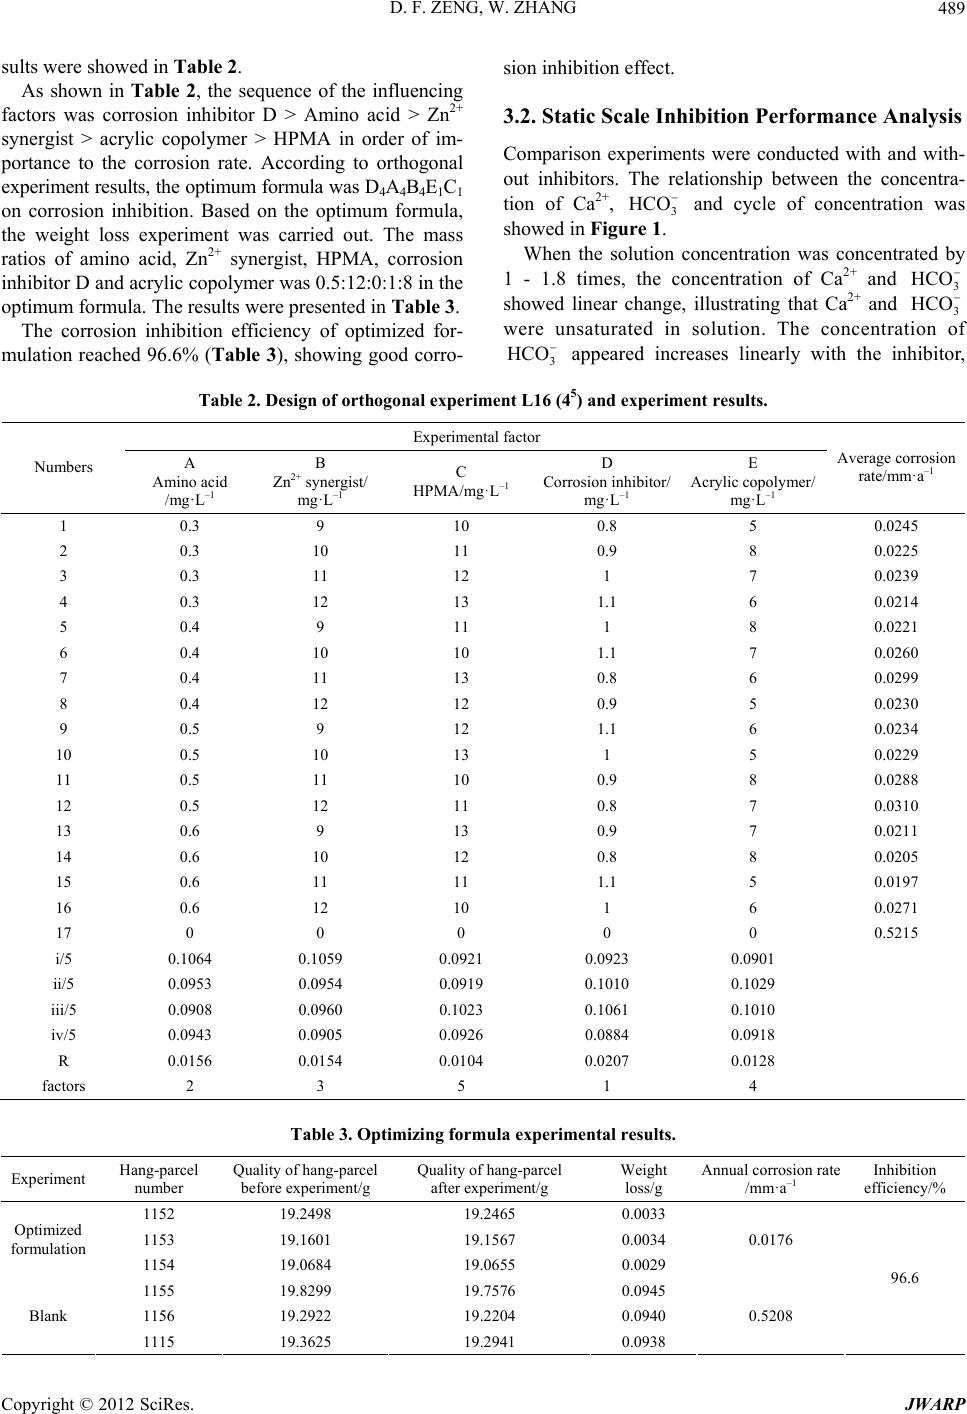 D. F. ZENG, W. ZHANG Copyright © 2012 SciRes. JWARP 489 HCO sults were showed in Table 2. sion inhibition effect. As shown in Table 2, the sequence of the influencing factors was corrosion inhibitor D > Amino acid > Zn2+ synergist > acrylic copolymer > HPMA in order of im- portance to the corrosion rate. According to orthogonal experiment results, the optimum formula was D4A4B4E1C1 on corrosion inhibition. Based on the optimum formula, the weight loss experiment was carried out. The mass ratios of amino acid, Zn2+ synergist, HPMA, corrosion inhibitor D and acrylic copolymer was 0.5:12:0:1:8 in the optimum formula. The results were presented in Table 3. 3.2. Static Scale Inhibition Performance Analysis Comparison experiments were conducted with and with- out inhibitors. The relationship between the concentra- tion of Ca2+, 3 and cycle of concentration was showed in Figure 1. When the solution concentration was concentrated by 1 - 1.8 times, the concentration of Ca2+ and 3 HCO showed linear change, illustrating that Ca2+ and 3 HCO were unsaturated in solution. The concentration of The corrosion inhibition efficiency of optimized for- mulation reached 96.6% (Table 3), showing good corro- 3 HCO appeared increases linearly with the inhibitor, Table 2. Design of orthogonal experiment L16 (45) and experiment results. Experimental factor Numbers A Amino acid /mg·L–1 B Zn2+ synergist/ mg·L–1 C HPMA/mg·L–1 D Corrosion inhibitor/ mg·L–1 E Acrylic copolymer/ mg·L–1 Average corrosion rate/mm·a–1 1 0.3 9 10 0.8 5 0.0245 2 0.3 10 11 0.9 8 0.0225 3 0.3 11 12 1 7 0.0239 4 0.3 12 13 1.1 6 0.0214 5 0.4 9 11 1 8 0.0221 6 0.4 10 10 1.1 7 0.0260 7 0.4 11 13 0.8 6 0.0299 8 0.4 12 12 0.9 5 0.0230 9 0.5 9 12 1.1 6 0.0234 10 0.5 10 13 1 5 0.0229 11 0.5 11 10 0.9 8 0.0288 12 0.5 12 11 0.8 7 0.0310 13 0.6 9 13 0.9 7 0.0211 14 0.6 10 12 0.8 8 0.0205 15 0.6 11 11 1.1 5 0.0197 16 0.6 12 10 1 6 0.0271 17 0 0 0 0 0 0.5215 i/5 0.1064 0.1059 0.0921 0.0923 0.0901 ii/5 0.0953 0.0954 0.0919 0.1010 0.1029 iii/5 0.0908 0.0960 0.1023 0.1061 0.1010 iv/5 0.0943 0.0905 0.0926 0.0884 0.0918 R 0.0156 0.0154 0.0104 0.0207 0.0128 factors 2 3 5 1 4 Table 3. Optimizing formula experimental results. Experiment Hang-parcel number Quality of hang-parcel before experiment/g Quality of hang-parcel after experiment/g Weight loss/g Annual corrosion rate /mm·a–1 Inhibition efficiency/% 1152 19.2498 19.2465 0.0033 1153 19.1601 19.1567 0.0034 Optimized formulation 1154 19.0684 19.0655 0.0029 0.0176 1155 19.8299 19.7576 0.0945 1156 19.2922 19.2204 0.0940 Blank 1115 19.3625 19.2941 0.0938 0.5208 96.6 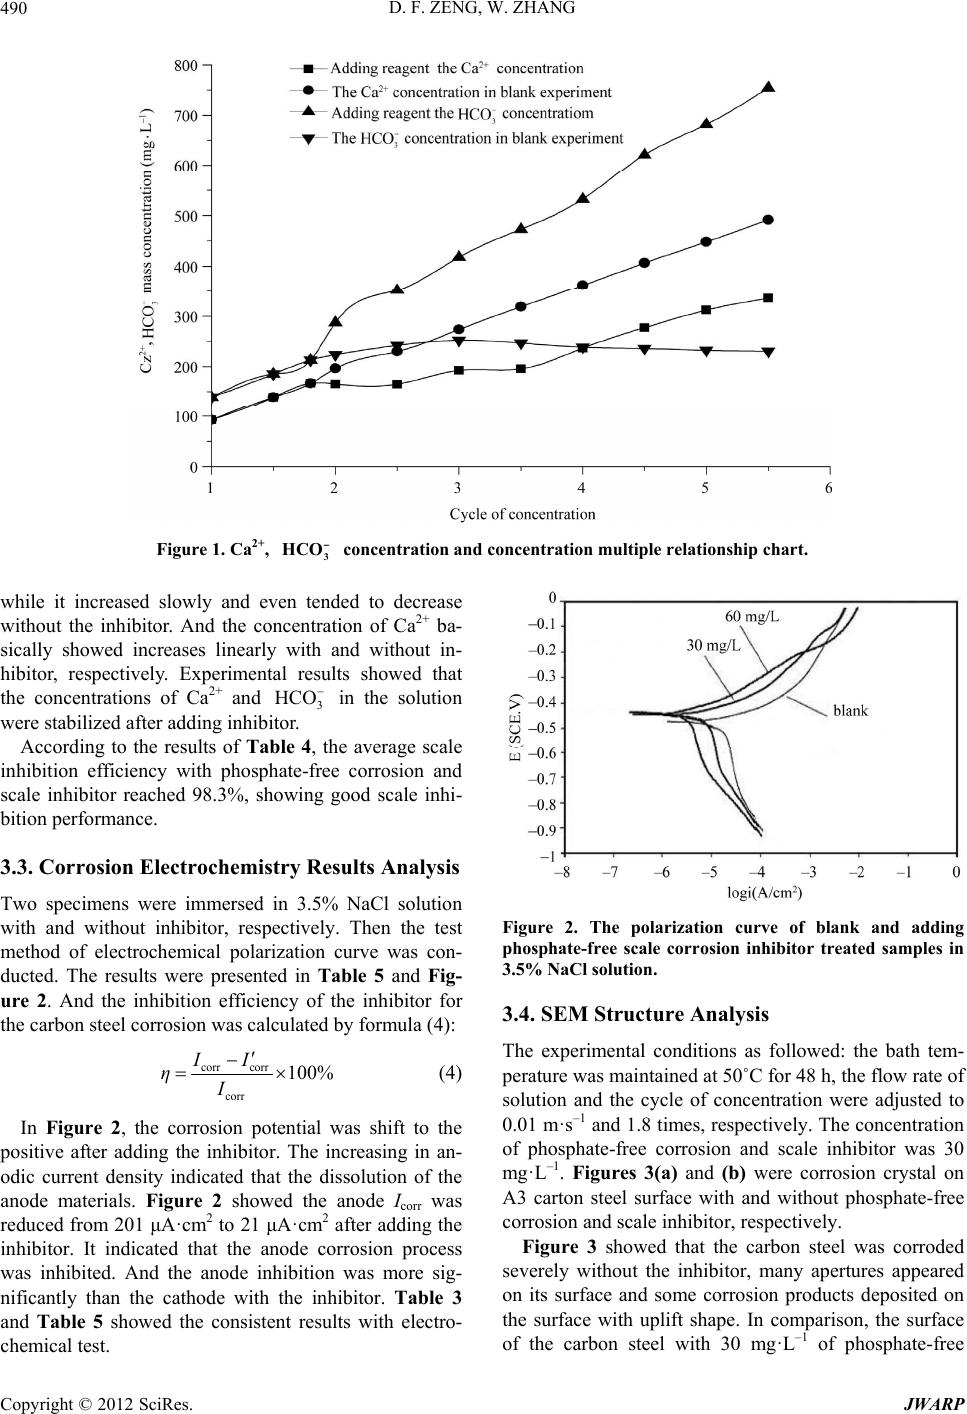 D. F. ZENG, W. ZHANG 490 Figure 1. Ca2+, conce ntr ation and conc e ntration multiple relationship chart. 3 HCO 3 HCO while it increased slowly and even tended to decrease without the inhibitor. And the concentration of Ca2+ ba- sically showed increases linearly with and without in- hibitor, respectively. Experimental results showed that the concentrations of Ca2+ and in the solution were stabilized after adding inhibitor. According to the results of Table 4, the average scale inhibition efficiency with phosphate-free corrosion and scale inhibitor reached 98.3%, showing good scale inhi- bition performance. 3.3. Corrosion Electrochemistry Results Analysis Two specimens were immersed in 3.5% NaCl solution with and without inhibitor, respectively. Then the test method of electrochemical polarization curve was con- ducted. The results were presented in Table 5 and Fig- ure 2. And the inhibition efficiency of the inhibitor for the carbon steel corrosion was calculated by formula (4): corr ηI corr corr 100% II (4) In Figure 2, the corrosion potential was shift to the positive after adding the inhibitor. The increasing in an- odic current density indicated that the dissolution of the anode materials. Figure 2 showed the anode Icorr was reduced from 201 μA·cm2 to 21 μA·cm2 after adding the inhibitor. It indicated that the anode corrosion process was inhibited. And the anode inhibition was more sig- nificantly than the cathode with the inhibitor. Table 3 and Table 5 showed the consistent results with electro- chemical test. Figure 2. The polarization curve of blank and adding phosphate-free scale corrosion inhibitor treated samples in 3.5% NaCl solution. 3.4. SEM Structure Analysis The experimental conditions as followed: the bath tem- perature was maintained at 50˚C for 48 h, the flow rate of solution and the cycle of concentration were adjusted to 0.01 m·s–1 and 1.8 times, respectively. The concentration of phosphate-free corrosion and scale inhibitor was 30 mg· L –1. Figures 3(a) and (b) were corrosion crystal on A3 carton steel surface with and without phosphate-free corrosion and scale inhibitor, respectively. Figure 3 showed that the carbon steel was corroded severely without the inhibitor, many apertures appeared on its surface and some corrosion products deposited on the surface with uplift shape. In comparison, the surface of the carbon steel with 30 mg·L–1 of phosphate-free Copyright © 2012 SciRes. JWARP 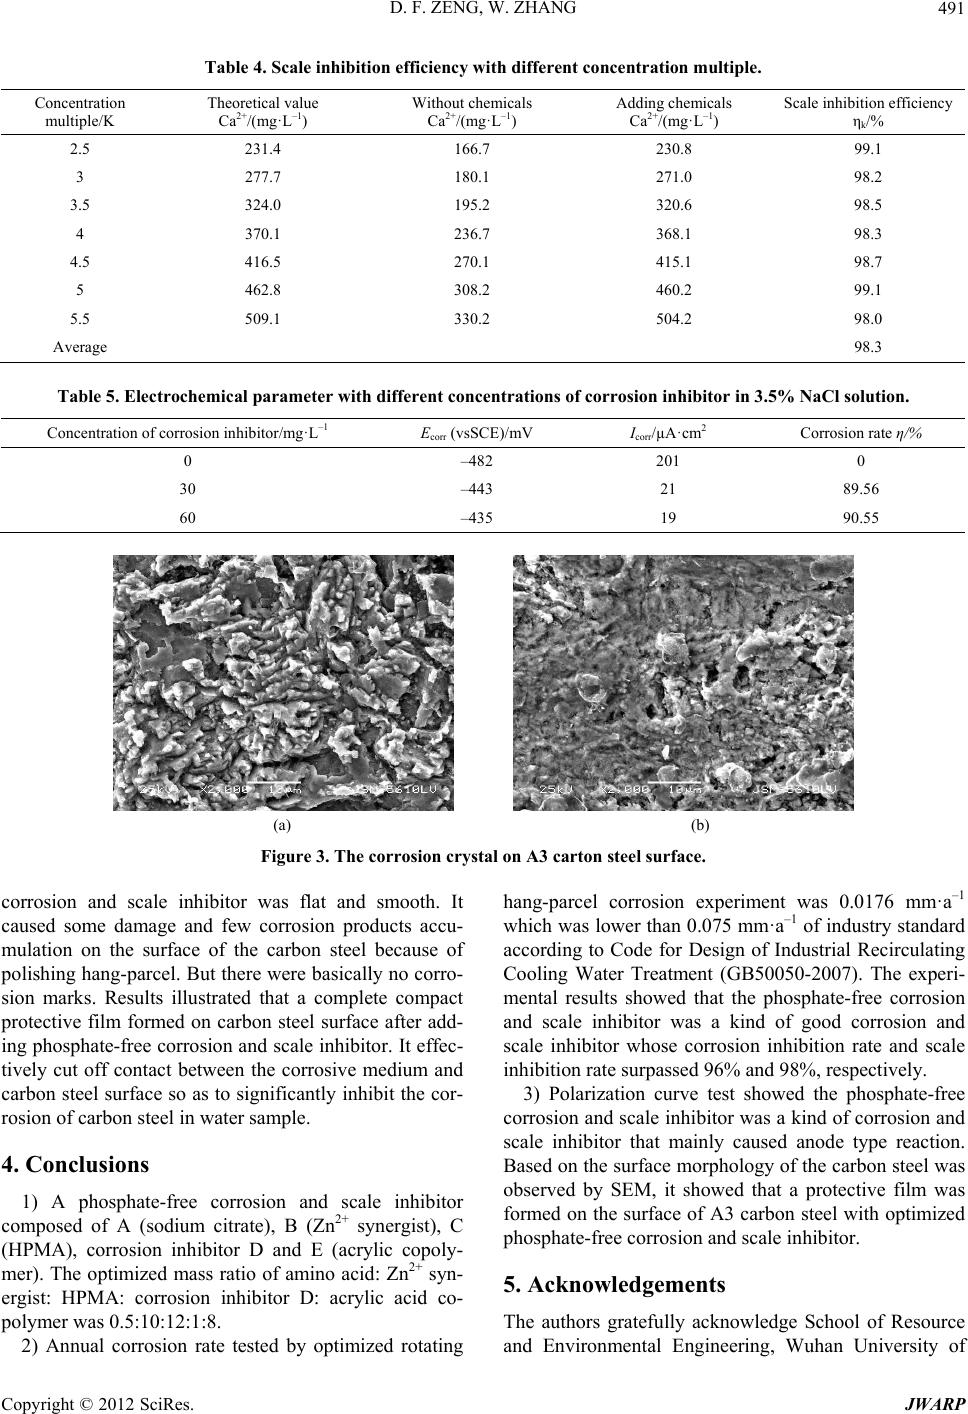 D. F. ZENG, W. ZHANG 491 Table 4. Scale inhibition efficiency with different concentration multiple. Concentration multiple/K Theoretical value Ca2+/(mg·L–1) Without chemicals Ca2+/(mg·L–1) Adding chemicals Ca2+/(mg·L–1) Scale inhibition efficiency ηk/% 2.5 231.4 166.7 230.8 99.1 3 277.7 180.1 271.0 98.2 3.5 324.0 195.2 320.6 98.5 4 370.1 236.7 368.1 98.3 4.5 416.5 270.1 415.1 98.7 5 462.8 308.2 460.2 99.1 5.5 509.1 330.2 504.2 98.0 Average 98.3 Table 5. Electrochemical parameter with different concentrations of corrosion inhibitor in 3.5% NaCl solution. Concentration of corrosion inhibitor/mg·L–1 Ecorr (vsSCE)/mV Icorr/µA·cm2 Corrosion rate η/% 0 –482 201 0 30 –443 21 89.56 60 –435 19 90.55 (a) (b) Figure 3. The corrosion crystal on A3 carton steel surface. corrosion and scale inhibitor was flat and smooth. It caused some damage and few corrosion products accu- mulation on the surface of the carbon steel because of polishing hang-parcel. But there were basically no corro- sion marks. Results illustrated that a complete compact protective film formed on carbon steel surface after add- ing phosphate-free corrosion and scale inhibitor. It effec- tively cut off contact between the corrosive medium and carbon steel surface so as to significantly inhibit the cor- rosion of carbon steel in water sample. 4. Conclusions 1) A phosphate-free corrosion and scale inhibitor composed of A (sodium citrate), B (Zn2+ synergist), C (HPMA), corrosion inhibitor D and E (acrylic copoly- mer). The optimized mass ratio of amino acid: Zn2+ syn- ergist: HPMA: corrosion inhibitor D: acrylic acid co- polymer was 0.5:10:12:1:8. 2) Annual corrosion rate tested by optimized rotating hang-parcel corrosion experiment was 0.0176 mm·a–1 which was lower than 0.075 mm·a–1 of industry standard according to Code for Design of Industrial Recirculating Cooling Water Treatment (GB50050-2007). The experi- mental results showed that the phosphate-free corrosion and scale inhibitor was a kind of good corrosion and scale inhibitor whose corrosion inhibition rate and scale inhibition rate surpassed 96% and 98%, respectively. 3) Polarization curve test showed the phosphate-free corrosion and scale inhibitor was a kind of corrosion and scale inhibitor that mainly caused anode type reaction. Based on the surface morphology of the carbon steel was observed by SEM, it showed that a protective film was formed on the surface of A3 carbon steel with optimized phosphate-free corrosion and scale inhibitor. 5. Acknowledgements The authors gratefully acknowledge School of Resource and Environmental Engineering, Wuhan University of Copyright © 2012 SciRes. JWARP 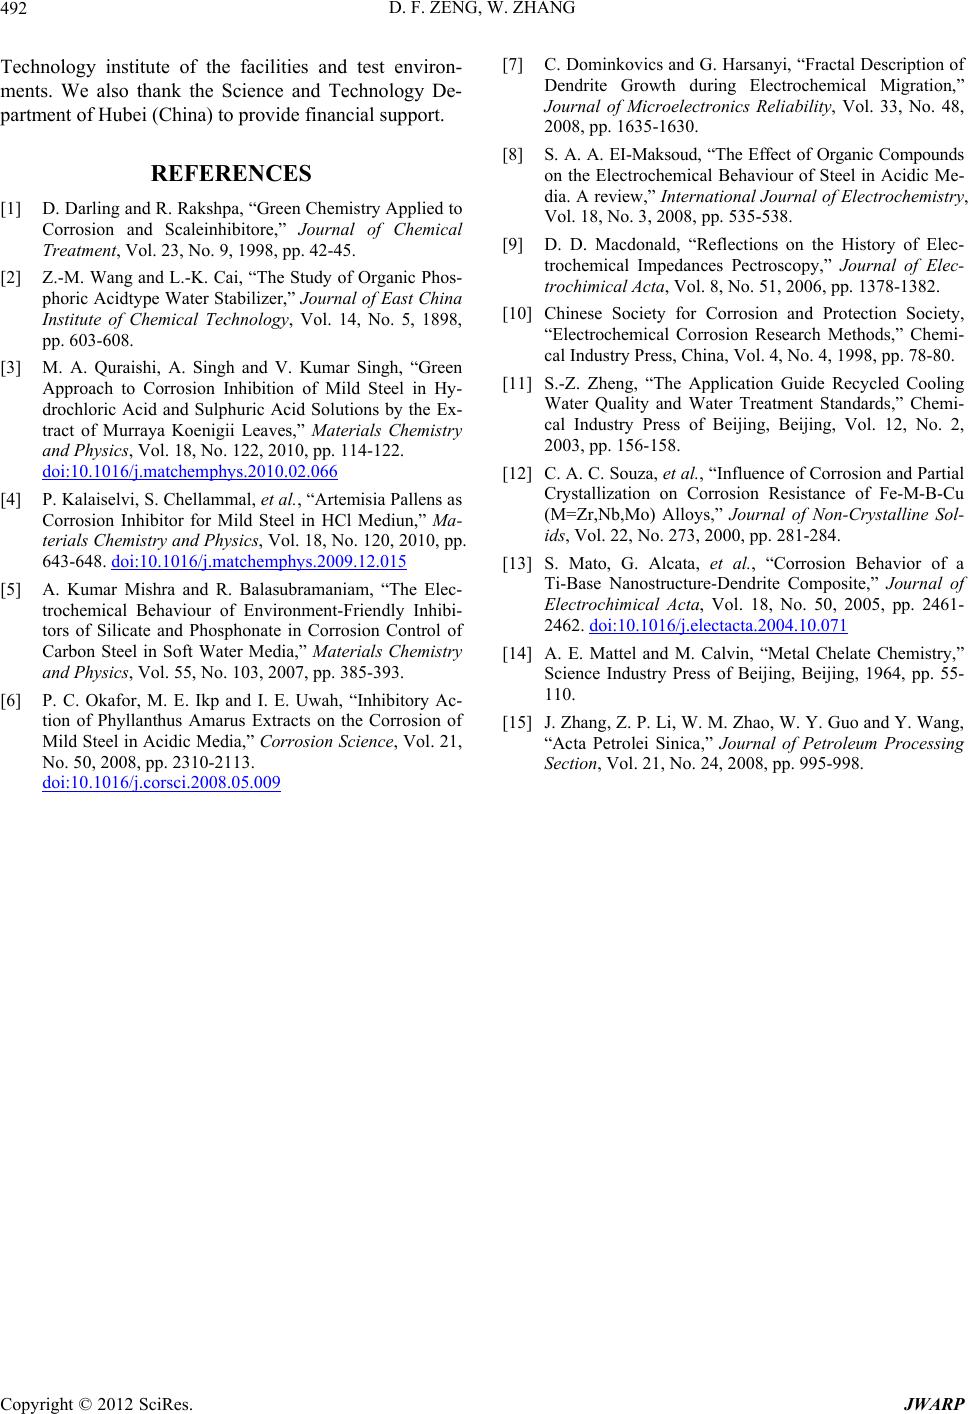 D. F. ZENG, W. ZHANG 492 Technology institute of the facilities and test environ- ments. We also thank the Science and Technology De- partment of Hubei (China) to provide financial support. REFERENCES [1] D. Darling and R. Rakshpa, “Green Chemistry Applied to Corrosion and Scaleinhibitore,” Journal of Chemical Treatment, Vol. 23, No. 9, 1998, pp. 42-45. [2] Z.-M. Wang and L.-K. Cai, “The Study of Organic Phos- phoric Acidtype Water Stabilizer,” Journal of East China Institute of Chemical Technology, Vol. 14, No. 5, 1898, pp. 603-608. [3] M. A. Quraishi, A. Singh and V. Kumar Singh, “Green Approach to Corrosion Inhibition of Mild Steel in Hy- drochloric Acid and Sulphuric Acid Solutions by the Ex- tract of Murraya Koenigii Leaves,” Materials Chemistry and Physics, Vol. 18, No. 122, 2010, pp. 114-122. doi:10.1016/j.matchemphys.2010.02.066 [4] P. Kalaiselvi, S. Chellammal, et al., “Artemisia Pallens as Corrosion Inhibitor for Mild Steel in HCl Mediun,” Ma- terials Chemistry and Physics, Vol. 18, No. 120, 2010, pp. 643-648. doi:10.1016/j.matchemphys.2009.12.015 [5] A. Kumar Mishra and R. Balasubramaniam, “The Elec- trochemical Behaviour of Environment-Friendly Inhibi- tors of Silicate and Phosphonate in Corrosion Control of Carbon Steel in Soft Water Media,” Materials Chemistry and Physics, Vol. 55, No. 103, 2007, pp. 385-393. [6] P. C. Okafor, M. E. Ikp and I. E. Uwah, “Inhibitory Ac- tion of Phyllanthus Amarus Extracts on the Corrosion of Mild Steel in Acidic Media,” Corrosion Science, Vol. 21, No. 50, 2008, pp. 2310-2113. doi:10.1016/j.corsci.2008.05.009 [7] C. Dominkovics and G. Harsanyi, “Fractal Description of Dendrite Growth during Electrochemical Migration,” Journal of Microelectronics Reliability, Vol. 33, No. 48, 2008, pp. 1635-1630. [8] S. A. A. EI-Maksoud, “The Effect of Organic Compounds on the Electrochemical Behaviour of Steel in Acidic Me- dia. A review,” International Journal of Electrochemistry, Vol. 18, No. 3, 2008, pp. 535-538. [9] D. D. Macdonald, “Reflections on the History of Elec- trochemical Impedances Pectroscopy,” Journal of Elec- trochimical Acta, Vol. 8, No. 51, 2006, pp. 1378-1382. [10] Chinese Society for Corrosion and Protection Society, “Electrochemical Corrosion Research Methods,” Chemi- cal Industry Press, China, Vol. 4, No. 4, 1998, pp. 78-80. [11] S.-Z. Zheng, “The Application Guide Recycled Cooling Water Quality and Water Treatment Standards,” Chemi- cal Industry Press of Beijing, Beijing, Vol. 12, No. 2, 2003, pp. 156-158. [12] C. A. C. Souza, et al., “Influence of Corrosion and Partial Crystallization on Corrosion Resistance of Fe-M-B-Cu (M=Zr,Nb,Mo) Alloys,” Journal of Non-Crystalline Sol- ids, Vol. 22, No. 273, 2000, pp. 281-284. [13] S. Mato, G. Alcata, et al., “Corrosion Behavior of a Ti-Base Nanostructure-Dendrite Composite,” Journal of Electrochimical Acta, Vol. 18, No. 50, 2005, pp. 2461- 2462. doi:10.1016/j.electacta.2004.10.071 [14] A. E. Mattel and M. Calvin, “Metal Chelate Chemistry,” Science Industry Press of Beijing, Beijing, 1964, pp. 55- 110. [15] J. Zhang, Z. P. Li, W. M. Zhao, W. Y. Guo and Y. Wang, “Acta Petrolei Sinica,” Journal of Petroleum Processing Section, Vol. 21, No. 24, 2008, pp. 995-998. Copyright © 2012 SciRes. JWARP |