

Paper Menu >>
Journal Menu >>
 Smart Grid and Renewable Energy, 2012, 3, 89-95 http://dx.doi.org/10.4236/sgre.2012.32013 Published Online May 2012 (http://www.SciRP.org/journal/sgre) 1 Generation Reliability Evaluation in Deregulated Power Systems Using Game Theory and Neural Networks Hossein Haroonabadi1, Hassan Barati2 1Electrical Department, Islamic Azad University (Islamshahr Branch), Tehran, Iran; 2Electric al Department, Isla mic Azad University (Dezful Branch), Dezful, Iran. Email: [email protected]c.ir, [email protected] Received March 30th, 2012; revised April 27th, 2012; accepted May 4th, 2012 ABSTRACT Deregulation policy has caused some changes in the concepts of power systems reliability assessment and enhancement. In the present research, generation reliability is considered, and a method for its assessment is proposed using Game Theory (GT) and Neural Networks (NN). Also, due to the stochastic behavior of power markets and generators’ forced outages, Monte Carlo Simulation (MCS) is used for reliability evaluation. Generation reliability focuses merely on the interaction between generation complex and load. Therefore, in the research, based on the behavior of players in the market and using GT, two outco mes are con sider ed : co op eration and non-co op eratio n. Th e proposed meth od is assessed on IEEE-Reliability Test System with satisfactory results. Loss of Load Expectation (LOLE) is used as the reliability index and the resu lts show generation reliability in cooperation market is better than non-coop eration outcome. Keywords: Power Market; Generation Reliability; Game Theory (GT); Neural Networks (NN); Monte Carlo Simulation (MCS) 1. Introduction Power systems have evolved over decades. Their primary emphasis is on providing a reliable and economic supply of electrical energy to their customers [1]. A real power system is complex, highly integrated and almost very large. It is divided into appropriate subsystems or func- tional zones that can be analyzed separately [1]. This paper deals with generation reliability assessment (Hier- archical Level I-HLI) in power pool market, and the trans- mission and distribution systems are considered reliable and adequate as shown in Figure 1. Most of the methods used for generation reliability evaluation are based on the loss of load or energy ap- proach. One of the suitable indices that describes genera- tion reliability level is “Loss of Load Expectation” (LOLE), that is the time in which load is more than the available generation capacity. Reliabl e Transmis- si on & Di stribution Systems Ge n. 1 Ge n. 2 Ge n. n Load Figure 1. Power pool market schematic for HLI reliability assessment. Generally, the reliability indices of a system can be evaluated using one of the following two basic approaches [1]: Analytical techniques, Stochastic simulation. Simulation techniques estimate the reliability indices by simulating the actual process and random behavior of the system. Since power markets and generators’ forced outages have stochastic behavior, Monte Carlo Simula- tion (MCS), as one of the most powerful methods for statistical analysis of stochastic problems, is used for reliability assessment in this research. Since the beginning of the 21st century, many countries have been trying to deregulate their power systems and create power markets [2,3]. In the power markets, the main function of players is their own profit maximization, which severely depends on the type of the market. As a result, generation reliability assessment depends on the market’s type and characteristics. Reliability problems have been evaluated in power markets during the last decade [4,5]. This paper deals with generation reliability in power pool markets using game theory (GT) and Neural Networks (NN). GT is the mathematical study of interaction among independent, self-interested agents [6]. That is, where the actions of one agent affect the payoff (utility or profit) of another agent in a way that affects the choice of best action by Copyright © 2012 SciRes. SGRE 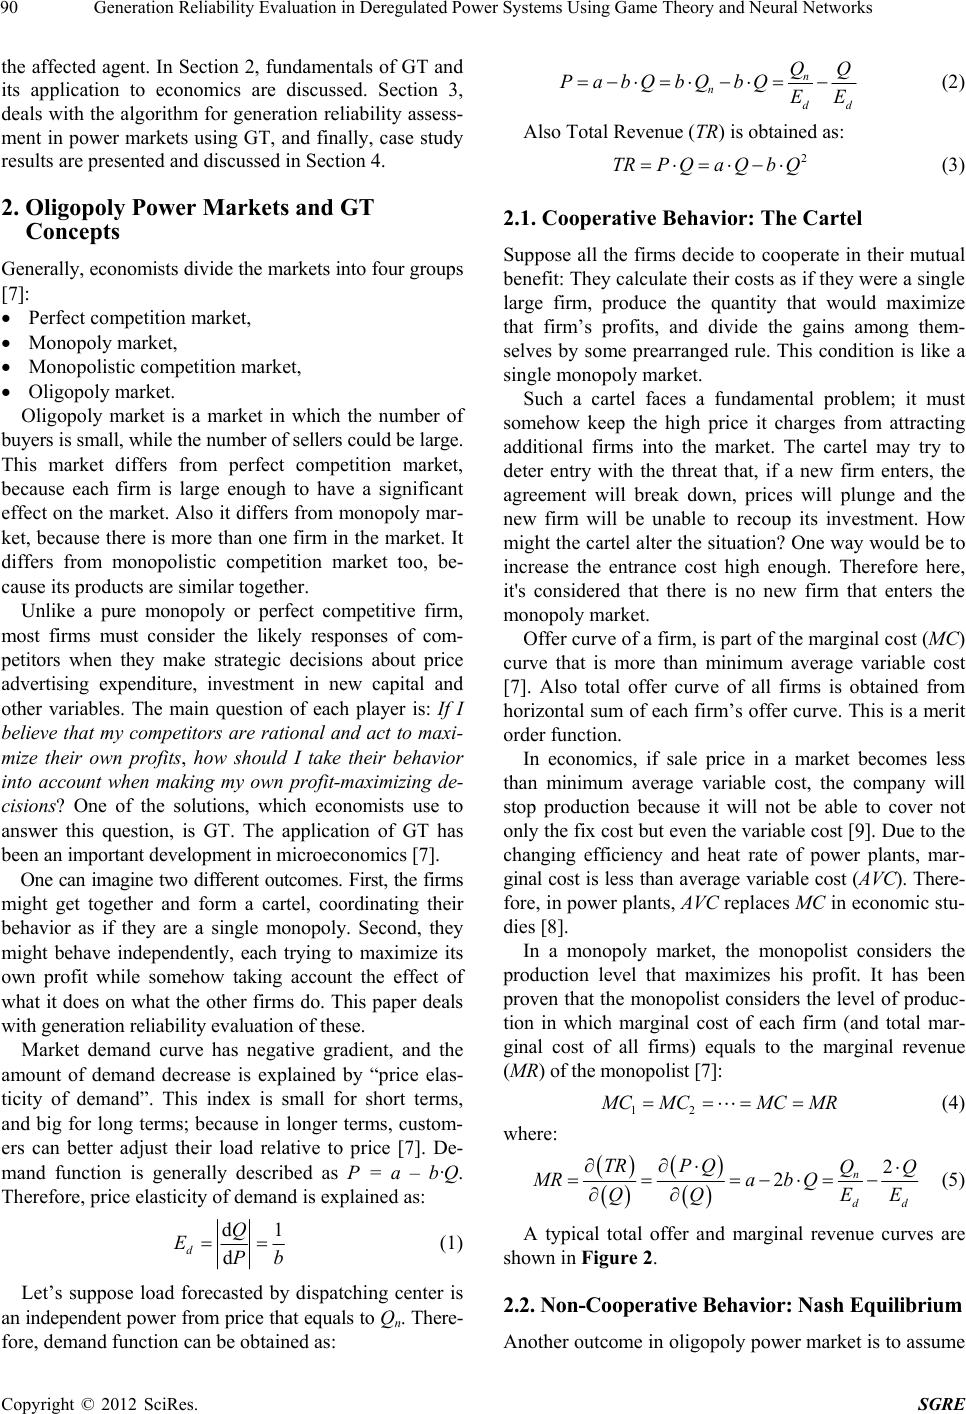 Generation Reliability Evaluation in Deregulated Power Systems Using Game Theory and Neural Networks 90 the affected agent. In Section 2, fundamentals of GT and its application to economics are discussed. Section 3, deals with the algorithm for generation reliability assess- ment in power markets using GT, and finally, case study results are presented and discussed in Section 4. 2. Oligopoly Power Markets and GT Concepts Generally, economists divide the markets into four groups [7]: Perfect competition market, Monopoly market, Monopolistic competition market, Oligopoly market. Oligopoly market is a market in which the number of buyers is small, while the number of sellers could be large. This market differs from perfect competition market, because each firm is large enough to have a significant effect on the market. Also it differs from monopoly mar- ket, because there is more than one firm in the market. It differs from monopolistic competition market too, be- cause its products are similar together. Unlike a pure monopoly or perfect competitive firm, most firms must consider the likely responses of com- petitors when they make strategic decisions about price advertising expenditure, investment in new capital and other variables. The main question of each player is: If I believe that my competitors are rational and act to maxi- mize their own profits, how should I take their behavior into account when making my own profit-maximizing de- cisions? One of the solutions, which economists use to answer this question, is GT. The application of GT has been an important devel opment in mi croeconomics [7]. One can imag ine two different outcomes . First, the firms might get together and form a cartel, coordinating their behavior as if they are a single monopoly. Second, they might behave independently, each trying to maximize its own profit while somehow taking account the effect of what it does on what the other firms do. This paper deals with generation reliability evaluation of these. Market demand curve has negative gradient, and the amount of demand decrease is explained by “price elas- ticity of demand”. This index is small for short terms, and big for long terms; because in longer terms, custom- ers can better adjust their load relative to price [7]. De- mand function is generally described as P = a – b·Q. Therefore, price elasticity of demand is explained as: d d dQ EPb 1 (1) Let’s suppose load forecasted by dispatching center is an independent power from price that equals to Qn. There- fore, dem a nd function can be obt ai n ed as: n ndd QQ Pa bQbQbQEE (2) Also Total Revenue (TR) is obtained as: 2 TRP Qa Qb Q (3) 2.1. Cooperative Behavior: The Cartel Suppose all the firms decide to cooperate in their mutual benefit: They calculate their co sts as if they were a single large firm, produce the quantity that would maximize that firm’s profits, and divide the gains among them- selves by some prearranged rule. This condition is like a single monopoly market. Such a cartel faces a fundamental problem; it must somehow keep the high price it charges from attracting additional firms into the market. The cartel may try to deter entry with the threat that, if a new firm enters, the agreement will break down, prices will plunge and the new firm will be unable to recoup its investment. How might the cartel alter the situatio n? One way would be to increase the entrance cost high enough. Therefore here, it's considered that there is no new firm that enters the monopoly market. Offer curve of a firm, is part of the marginal cost (MC) curve that is more than minimum average variable cost [7]. Also total offer curve of all firms is obtained from horizontal sum of each firm’s offer curve. This is a merit order function. In economics, if sale price in a market becomes less than minimum average variable cost, the company will stop production because it will not be able to cover not only the fix cost but even the variable cost [9]. Due to the changing efficiency and heat rate of power plants, mar- ginal cost is le ss than average variable cost (AVC). There- fore, in power plants, AVC replaces MC in economic stu- dies [8]. In a monopoly market, the monopolist considers the production level that maximizes his profit. It has been proven that the monopolist considers the level of produc- tion in which marginal cost of each firm (and total mar- ginal cost of all firms) equals to the marginal revenue (MR) of the monopolist [7]: 12 M CMC MCMR (4) where: 2 2n dd TRP QQQ MRab Q QQ E E (5) A typical total offer and marginal revenue curves are shown in Figure 2. 2.2. Non-Cooperative Behavior: Nash Equilibrium Another outcome in oligopoly power market is to assume Copyright © 2012 SciRes. SGRE 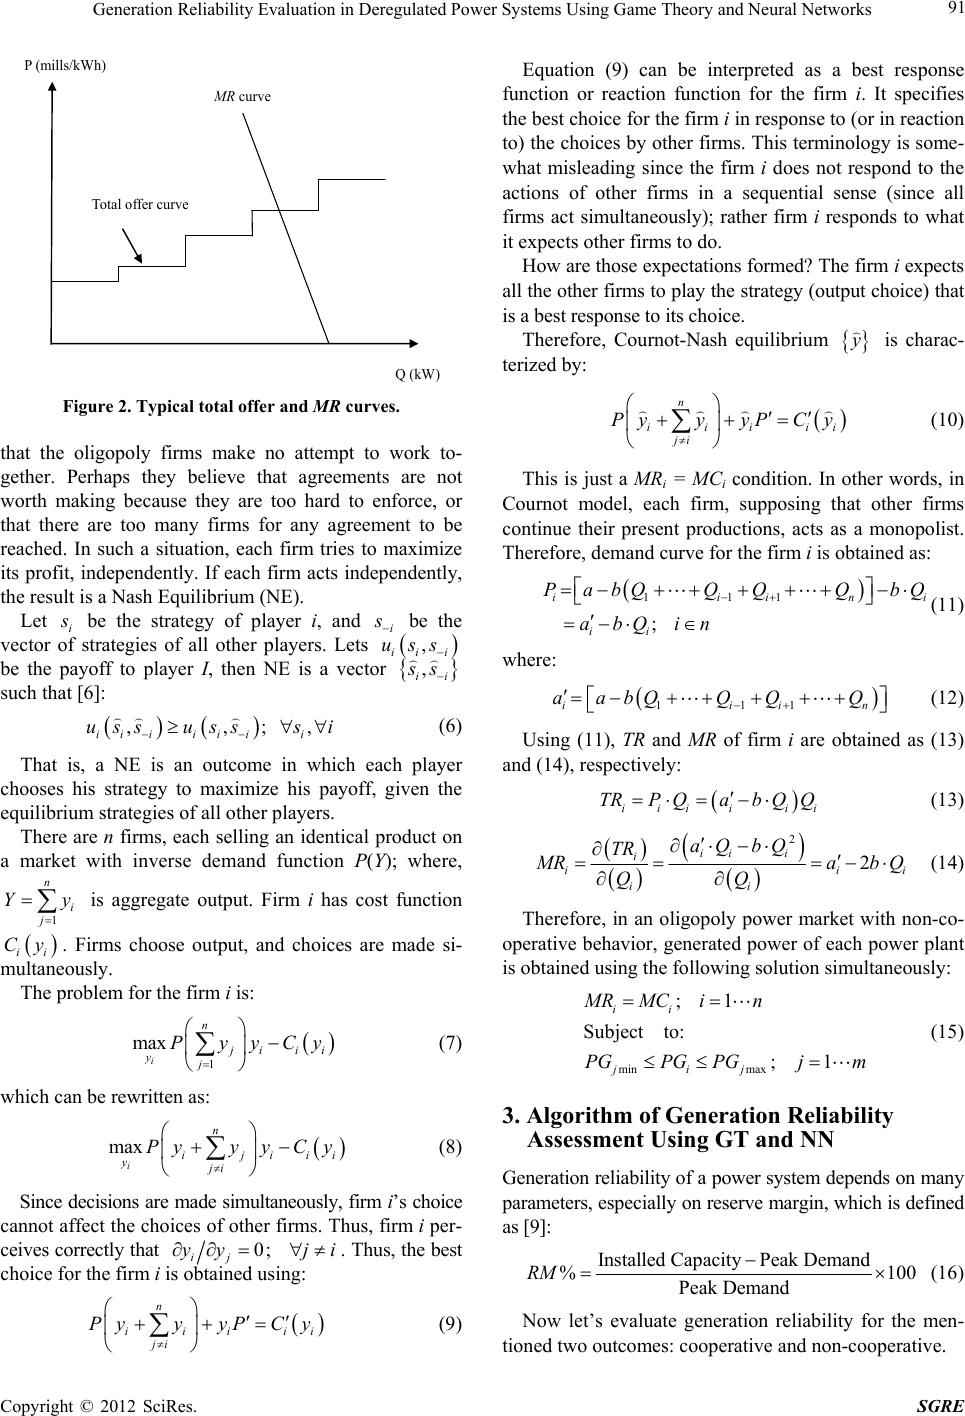 Generation Reliability Evaluation in Deregulated Power Systems Using Game Theory and Neural Networks 91 MR curve Total offer curve P (mills/kWh) Q (kW) Figure 2. Typical total offer and MR curves. that the oligopoly firms make no attempt to work to- gether. Perhaps they believe that agreements are not worth making because they are too hard to enforce, or that there are too many firms for any agreement to be reached. In such a situation, each firm tries to maximize its profit, independently. If each firm acts independently, the result is a Nash Equilibrium (NE). Let i s be the strategy of player i, and i s be the vector of strategies of all other players. Lets , ii i uss be the payoff to player I, then NE is a vector , ii s s such that [6]: ,,; ii iii ii ussusss i , (6) That is, a NE is an outcome in which each player chooses his strategy to maximize his payoff, given the equilibrium strategies of all other players. There are n firms, each selling an identical product on a market with inverse demand function P(Y); where, 1 n i j Y y is aggregate output. Firm i has cost function ii Cy. Firms choose output, and choices are made si- multaneously. The problem for the firm i is: 1 max i n j iii yj PyyCy (7) which can be rewritten as: max i n ijii yji Pyy yCy i (8) Since decisions are made simultaneously, firm i’s choice cannot affect the choices of other firms. Thus, firm i per- ceives correctly that 0; ij yy ji . Thus, the best choice for the firm i is obtained using: n iiii ji PyyyP Cy Equation (9) can be interpreted as a best response function or reaction function for the firm i. It specifies the best choice for the firm i in response to (or in reaction to) the choices by other firms. This terminology is some- what misleading since the firm i does not respond to the actions of other firms in a sequential sense (since all firms act simultaneously); rather firm i responds to what it expects other firms to do. How are those expectations formed? The firm i expects all the other firms to play the strategy (output choice) that is a best response to its choice. Therefore, Cournot-Nash equilibrium y is charac- terized by: n iiii ji PyyyP Cy i (10) This is just a MRi = MCi condition. In other words, in Cournot model, each firm, supposing that other firms continue their present productions, acts as a monopolist. Therefore, demand curve for the firm i is obtained as: 111 ; iiin ii PabQQ QQbQ abQin i (11) where: 111iii aabQ QQQ n (12) Using (11), TR and MR of firm i are obtained as (13) and (14), respectively: iii ii TRPQab QQ i (13) 2 2 ii i i ii ii aQ bQ TR i M Ra QQ bQ (14) Therefore, in an oligopoly power market with non-co- operative behavior, generated power of each power plant is obtained using the follo wing solution simultaneously: min max ;1 Subject to: ;1 ii jij MR MCin PGPG PGjm (15) 3. Algorithm of Generation Reliability Assessment Using GT and NN Generation reliability of a power system depends on many parameters, especially on reserve margin, which is defined as [9]: Installed CapacityPeak Demand %1 Peak Demand RM 00 (16) Now let’s evaluate generation reliability for the men- tioned two outcomes: cooperative and non-cooperative. i (9) Copyright © 2012 SciRes. SGRE  Generation Reliability Evaluation in Deregulated Power Systems Using Game Theory and Neural Networks 92 3.1. Generation Reliability Assessment in Cooperative Condition (Monopoly Market) As explained before, in cooperative outcome, the market acts as a monopoly market. The algorithm of generation reliability assessment in monopoly power pool market using Monte Carlo simulation is as follows: 1) Calculate total offer curve of the power plants. 2) Select a random day and its load (Qn), and calculate MR curve using (5). 3) The power plants, selected for generation in the se- lected day, are determined from the intersection of the power plants’ total offer curve and MR cu rve with regard to the reserve margin. 4) For each power plant selected in the previous step, a random number between 0 - 1 is generated. If the gener- ated number is more than the power plant’s Forced Out- age Rate (FOR), the power plant is considered as avail- able in the mentioned iteration; otherwise, it encounters forced outage and thus can not generate power. This process is performed for all power plants using an inde- pendent random number generated for each plant. Finally, sum of the available power plants’ generation capacities is calculated. If the sum becomes less than the intersec- tion of the power plants’ total offer curve and demand exponent curve, we will have interrup tion in th e iteration, and therefore, LOLE will increase by as much as one unit; otherwise, we will go to the next iteration. The algorithm of available generated power and LOLE calculation for each iteration in MCS is shown in Figure 3. 5) The Steps 2 to 4 are repeated for calculation of the final LOLE. 3.2. Generation Reliability Assessment in Non-Cooperative Condition (Cournot-Nash Equilibrium) The algorithm of generation reliability assessment in oli- gopoly power pool market for non-cooperation outcome using MCS is as follows: 1) Select a random day and its load (Qn), and calculate demand curve cross of basis and gradient using (2). 2) Calculate the power plants’ generated powers in the selected day using (11)-(15). Also, the amount of total demand is obtained using sum of plants’ generated pow- ers regard l es s of rese r v e margi n . 3) For each power plant selected in the previous step, with regard to the reserve margin, a random number be- tween 0 - 1 is generated. If the generated number is more than the power plant’s Forced Outage Rate (FOR), the power plant is considered as available in the mentioned iteration; otherwise, it encounters forced outage and thus can not generate power. This process is performed for all power plants using an independent random number gen- erated for each plant. Finally, sum of the available power Generate a random number between [0-1] (U i ) Select the first generator (i = 1); Available Generated Power (AGP) = 0; LOLE = 0 AG P = AGP + P G i U i >= FOR i i = NG i = i + 1 Total AGP calculation AGP < Load LOLE = LOLE + 1 LOLE does not change N N Y N Y Figure 3. The algorithm of available generated power and LOLE calculation for each iteration using MCS. plants’ generation capacities is calculated. If the sum becomes less than the intersection of the power plants’ total offer curve and demand exponent curve, we will have interruption in the iteration, and therefore, LOLE will increase by as much as one unit; otherwise, we will go to the next iteration. 4) Steps 1-3 are repeated for calculation of the final LOLE. 3.3. Generation Reliability Evaluation Using NN Now, to create a unique structure, a four-layer Perceptron NN is used for reliability evaluation. Th e number of neu- rons in each layer is 20, 15, 10 and 1, respectively (Fig- ure 4). All neurons in the first, third and last layers have POSLIN transfer function, and the second layer has TANSIG transfer function. Three inputs of the NN in- clude: C: A number that shows the kind of outcome (1 for cooperative, and 2 for non-cooperative outcomes), Ed: Price elasticity of demand, RM: Reserve margin. Also, the NN’s output is LOLE index. Copyright © 2012 SciRes. SGRE 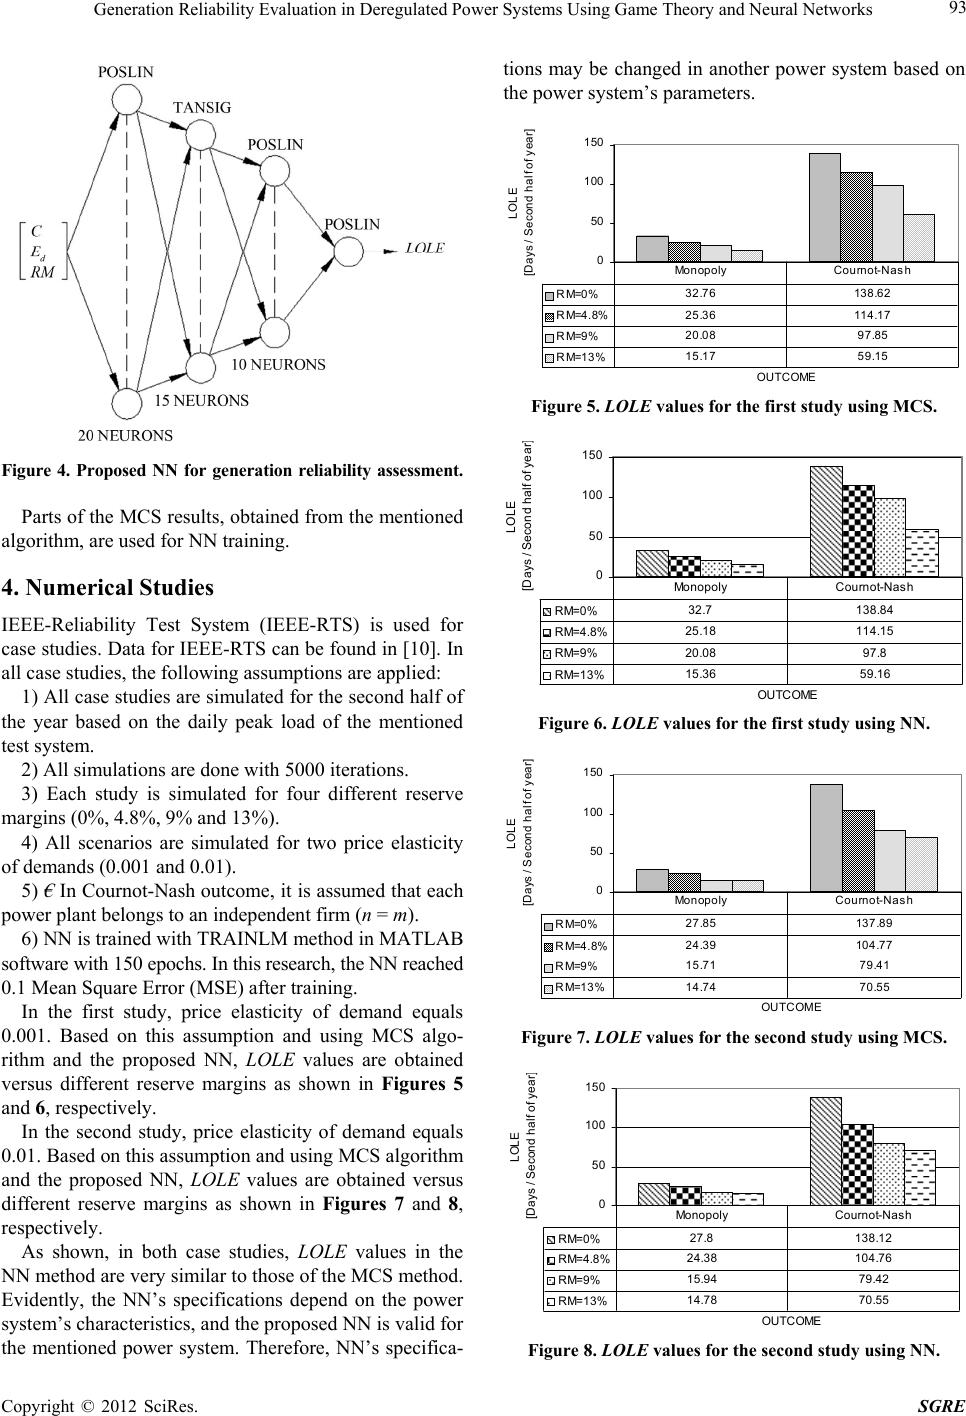 Generation Reliability Evaluation in Deregulated Power Systems Using Game Theory and Neural Networks 93 Figure 4. Proposed NN for generation reliability assessment. Parts of the MCS results, obtained from the mentioned algorithm, are used for NN training. 4. Numerical Studies IEEE-Reliability Test System (IEEE-RTS) is used for case studies. Data for IEEE-RTS can be found in [10]. In all case studies, the following assumptions are applied: 1) All case studies are simulated for the second half of the year based on the daily peak load of the mentioned test system. 2) All simulations are done with 5000 iterations. 3) Each study is simulated for four different reserve margins (0%, 4.8%, 9% and 13%). 4) All scenarios are simulated for two price elasticity of demands (0.001 and 0.01). 5) € In Cournot-Nash outcome, it is assumed that each power plant belongs to an independent firm (n = m). 6) NN is trained with TRAINLM method in MATLAB software with 150 epochs. In this research, the NN reached 0.1 Mean Square Error (MSE) after training. In the first study, price elasticity of demand equals 0.001. Based on this assumption and using MCS algo- rithm and the proposed NN, LOLE values are obtained versus different reserve margins as shown in Figures 5 and 6, respectively. In the second study, price elasticity of demand equals 0.01. Based on this assumption and using MCS algorithm and the proposed NN, LOLE values are obtained versus different reserve margins as shown in Figures 7 and 8, respectively. As shown, in both case studies, LOLE values in the NN method are very similar to those of the MCS method. Evidently, the NN’s specifications depend on the power system’s characteristics, and the proposed NN is valid for the mentioned power system. Therefore, NN’s specifica- tions may be changed in another power system based on the power system’s parameters. 0 50 100 150 OUTCOM E LOLE [Days / S econd half of ye ar] RM=0% 32.76 138.62 RM=4.8%25.36114.17 RM=9% 20.08 97.85 RM=13% 15.1759.15 Monopoly Cournot-Nash Figure 5. LOLE values for the first study using MCS. 0 50 100 150 OUTCOME LOLE [ Day s / Sec ond half of year ] RM=0% 32.7 138.84 RM=4.8% 25.18 114.15 RM=9% 20.08 97.8 RM=13% 15.36 59.16 Monopoly Cournot-Nash Figure 6. LOLE values for the first study using NN. 0 50 100 150 OUTCOME LOLE [Days / Sec o nd half of y ear ] RM=0% 27.85 137.89 RM=4.8% 24.39 104.77 RM=9% 15.71 79.41 RM=13% 14.74 70.55 Monopoly Cournot-Nash Figure 7. LOLE values for the second study using M CS. 0 50 100 150 OUTCOME LOLE [Days / Second half of year ] RM=0%27.8 138.12 RM=4.8% 24.38 104.76 RM=9% 15.94 79.42 RM=13%14.78 70.55 Monopoly Cournot-Nash Figure 8. LOLE values for the second study using NN. Copyright © 2012 SciRes. SGRE  Generation Reliability Evaluation in Deregulated Power Systems Using Game Theory and Neural Networks Copyright © 2012 SciRes. SGRE 94 In both case studies, if reserve margin increases, LOLE will decrease and reliability will improve. In monopoly market, if price elasticity increases, MR curve takes less gradient. As a result, intersection of the power plants’ total offer curve and MR curve occurs at less demand. This leads to the operation of fewer power plants. Therefore, in all case studies in monopoly market, if price elasticity increases, LOLE will decrease. In Cournot-Nash equilibrium, if price elasticity varies, the generated power of every power plant varies, too. Therefore, LOLE will differ based on the share of every plant’s generated power and FOR. LOLE values in Cournot-Nash outcome are very big- ger than those of the monopoly outcome. Because in mo- nopoly market, only the plants, which are selected by in- tersection of the total offer and MR curves, are in service (considering RM), while in Cournot-Nash outcome, all of the players participate in the market, and the load feeds based on the plants’ optimum generated power. Therefore, in monopoly market, at every time period, only a few plants are in service, while in Cournot-Nash ou tcome, all of the power plants are in service based on their optimum generation. Since the number of in-service plants in Cournot-Nash outcome is very bigger than in monopoly market, generation reliability in monopoly market is bet- ter than in Cournot-Nash outcome. It is worth noting that, since available capacity of hy- dro plants in IEEE-RTS are different in the first and the second halves of the year, therefore, in the present work, simulations were done for the second half of the year. Evidently, the proposed method can be utilized for every simulation time. 5. Conclusions This research deals with generation reliability assessment in power pool market using GT. Due to the stochastic behavior of market and generators’ FOR, MCS was used for simulations. Also, for creation of a unique structure for reliability assessment, a NN was used, which its out- puts were very similar to the MCS results. Based on the players’ cooperation conditions, two out- comes (Monopoly and Cournot-Nash equilibrium) were considered. LOLE was used as generation reliability in- dex, and it was shown that generation reliability in mo- nopoly market is better than Cournot-Nash model. Also, in monopoly market, if price elasticity increases, LOLE will improve. On the other hand , in Cournot-Nash model, if the price elasticity of demand varies, the power plants’ generated powers will vary too, and that is why LOLE changes. REFERENCES [1] R. Billinton and R. Allan, “Relia bility Evaluation of Power Systems,” 2nd Edition, Plenum Press, New York, 1996, pp. 1, 10, 372. [2] L. Salvaderi, “Electric Sector Restructuring in Italy,” IEEE Power Engineering Review, Vol. 20, No. 4, 2000, pp. 12- 16. doi:10.1109/39.833009 [3] H. B. Puttgen, D. R. Volzka and M. I. Olken, “Restructur- ing and Reregulation of The US Electric Utility Industry,” IEEE Power Engineering Review, Vol. 21, No. 2, 2001, pp. 8-10. doi:10.1109/39.896811 [4] R. Azami, A. H. Abbasi, J. Shakeri and A. F. Fard, “Impact of EDRP on Composite Reliability of Restructured Power Systems,” IEEE PowerTech, Bucharest, 28 June-2 July 2009, pp. 1-8. doi:10.1109/PTC.2009.5281812 [5] P. Wang, Y. Ding and L. Goel, “Reliability Assessment of Restructured Power Systems Using Optimal Load Shed- ding Technique,” Generation, Transmission & Distribu- tion, Vol. 3, No. 7, 2009, pp. 628-640. [6] K. Leyton-Bro wn and Y. Shoham, “Essentials of Game The- ory,” Morgan & Claypool Publishers, USA, p. 11. [7] R. S. Pindyck and D. L. Rubinfeld, “Microeconomics,” 5th Edition, Prentice Hall, Saddle River, 2001. [8] S. Borenstein, “Understanding Competitive Pricing and Market Power in Wholesale Electricity Market,” Energy Institute, University of California, Berkeley, 1999. [9] International Energy Agency (IEA), “Security of Supply in Electricity Markets—Evidence and Policy Issues,” IEA, Paris, 2002, p. 16. [10] IEEE Reliability Test System Task Force of Application of Probability Methods Subcommittee, “IEEE Reliability Test System,” IE EE Transactio ns on Powe r Appa ratus an d Systems, Vol. 98, No. 6, 1979, pp. 2047-2054.  Generation Reliability Evaluation in Deregulated Power Systems Using Game Theory and Neural Networks 95 Symbol List MC: Marginal cost (mills/kWh) (1 mills = 0.001 $) TR: Total revenue (mills/h) MR: Marginal revenue (mills/kWh) AGP: Avail able gener ated powe r Ui: A random number between [0 - 1] NG: Number of power plants Q: Quantity of power (kW) P: Electrical energy price (mills/kWh) RM: Reserve margin (%) Ed: Price elasticity of demand (kW2h/mills) C: Type of outcome Qn: Forecasted load (kW) LOLE: Loss of load expectation (days/second half of the year) FOR: Forced outage rate of power plants a: Demand exponent curve cross of basis (mills/kWh) b: Demand exponent curve gradient (mills/kW2h) m: Number of power plants in the pool market n: Number of independent firms in the pool market PG: Generated power (kW) PGmin: Minimu m limit of generator (kW) PGmax: Maximum limit of generator (kW) Copyright © 2012 SciRes. SGRE |