

Paper Menu >>
Journal Menu >>
 International Journal of Geosciences, 2012, 3, 398-403 http://dx.doi.org/10.4236/ijg.2012.32044 Published Online May 2012 (http://www.SciRP.org/journal/ijg) Estimation of Basal Area in West Oak Forests of Iran Using Remote Sensing Imagery Loghman Ghahramany1, Parviz Fatehi2, Hedayat Ghazanfari1 1Department of Forestry, College of Natural Resources, University of Kurdistan, Sanandaj, Iran 2Remote Sensing Laboratories, Department of Geography, University of Zurich, Zurich, Switzerland Email: [email protected], [email protected] Received November 20, 2011; revised January 2, 2012; accepted February 7, 2012 ABSTRACT The objective of this study is to evaluate the capability of satellite imagery for the estimation of basal area in Northern Zagros Forests. The data of the high resolution geometric (HRG) sensor of SPOT-5 satellite dated in July 2005 were used. Investigation of the quality of Satellite images shows that these images have no radiometric distortion. Overlaying of geocoded images with the digital topographic maps indicated that the images have high geometric precision. A num- ber of 319 circular plots (0.1 ha) were established using systematic random method in the study area. All trees having diameter at breast height (DBH) (i.e. 1.3 m above ground) greater than 5 cm were callipered in each plot. Basal area in each plot was determined using field data. Main bands, artificial bands such as vegetation indices and principle compo- nent analysis (PCA) were studied. Digital numbers related to each plot were extracted from original and artificial bands. All plots were ordinated by major geographic aspects and the best fitted regression models were determined for both the study area without consideration of aspects and with consideration of major geographic aspects by multiple regression analysis (step wise regression). The results from regression analysis indicated that the square root of basal area without consideration of aspects has a high correlation with band B1 (r = –0.60). The consideration of aspects resulted in corre- lation of different indices with square root of basal area such that in northern forests, band B1 had higher correlation coefficient (r = –0.67) among other indices. In Eastern forests, the same band showed correlation of basal area with dif- ferent correlation coefficient (r = –0.65). In southern and western forests, the square root of basal area had higher corre- lation (r = –0.68) with RVI. The use of the square root of basal area as a dependent variable in multivariate linear re- gression improved the results. The assessment of model validity indicated that the proposed models are properly valid. Keywords: Northern Zagros Forests; Basal Area; SPOT-5 Data 1. Introduction Northern Zagros oak forests represent the most important forest communities in natural forested landscapes in west of Iran [1]. These forests have a great economical value and are a source of revenue for local residents. Even though these forests have been known as conservative forests, the local communities have to traditionally utilize them as a source. In this traditional forest management, the owner of forest applies mixture styles of evenaged coppice on tree (on trunk & crown) and unevenaged coppice (on ground) for preparing food for domestic animals and for wood [1]. These forests produce little amount of woods for industry and have low standing volume; however, tree crowns are utilized in every 3- year period. Thus, the basal area can be an appropriate index to determine the changes in these forests and can provide valuable information about the effect of man- agement activities on the forests. The estimation of this index using field study is difficult, taking plenty of time and needing a great deal of money. In last decades, the science of forest biometry has markedly progressed, re- sulting in using more sophisticated instruments in forest inventory. This provides an opportunity for collecting data and computing indices with less field working and time. One of the most important instruments used in for- est inventory is remote sensing. The integration of the data and information collected from satellite images and field data is the base of modern forest biometry [2]. Many studies have used satellite data to estimate forest quantitative parameters such as density, standing volume, basal area, and etc. in last two decades [3]. Ripple et al. compared Digital Landsat Thematic Mapper (TM) and Satellite SPOT High Resolution Visible (HRV) images of coniferous forests to estimate standing volume using correlation and regression analyses. Significant inverse relationships were found between softwood volume and the spectral bands from both sensors (P < 0.01). The highest correlations were found between the logarithm of C opyright © 2012 SciRes. IJG 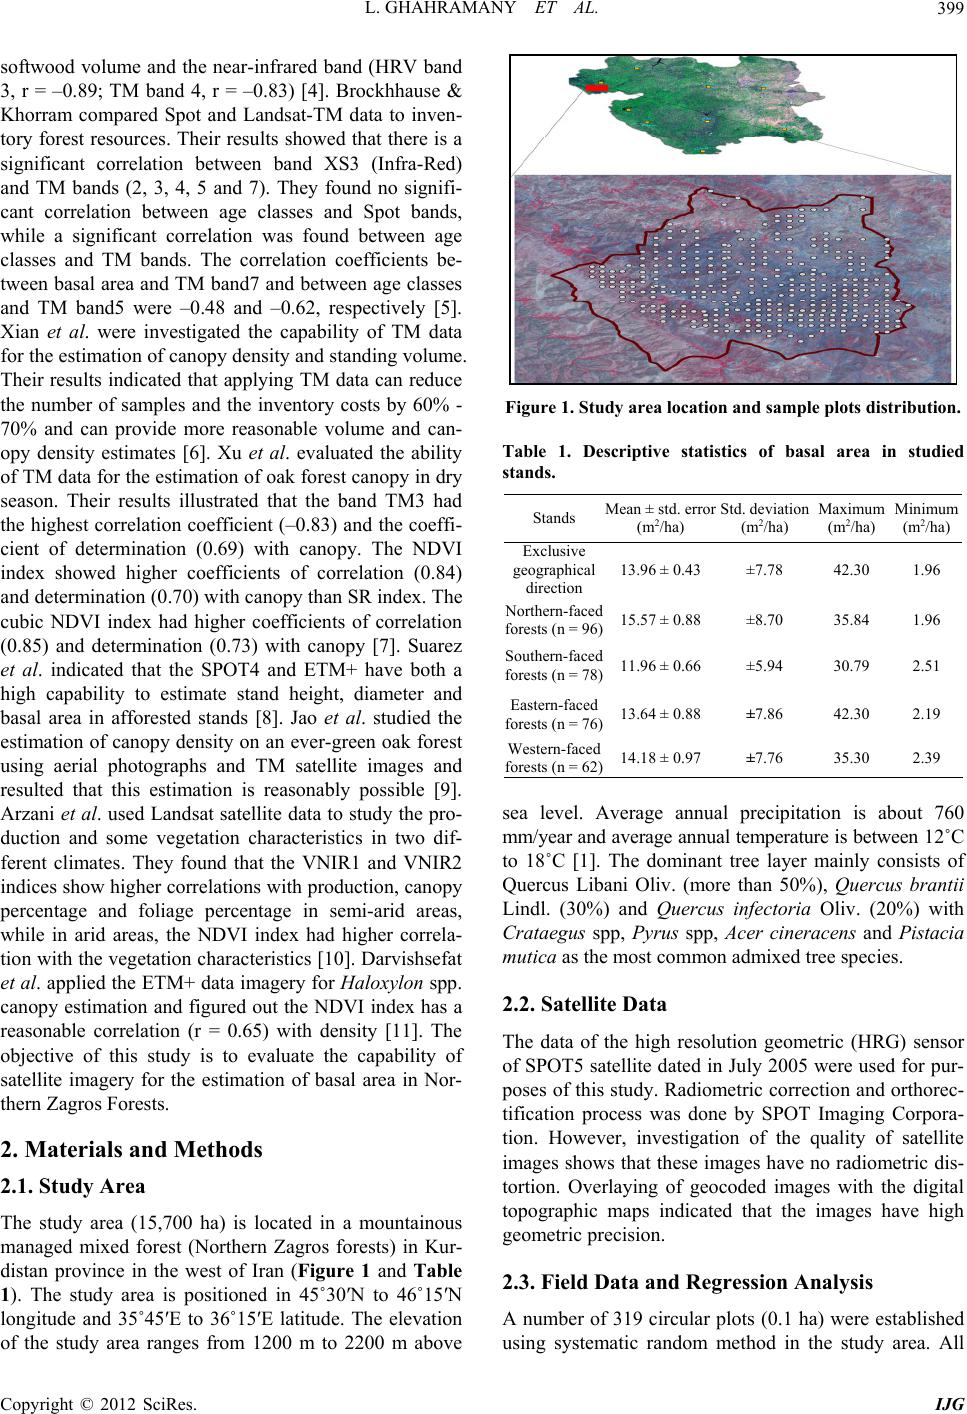 L. GHAHRAMANY ET AL. 399 softwood volume and the near-infrared band (HRV band 3, r = –0.89; TM band 4, r = –0.83) [4]. Brockhhause & Khorram compared Spot and Landsat-TM data to inven- tory forest resources. Their results showed that there is a significant correlation between band XS3 (Infra-Red) and TM bands (2, 3, 4, 5 and 7). They found no signifi- cant correlation between age classes and Spot bands, while a significant correlation was found between age classes and TM bands. The correlation coefficients be- tween basal area and TM band7 and between age classes and TM band5 were –0.48 and –0.62, respectively [5]. Xian et al. were investigated the capability of TM data for the estimation of canopy density and standing volume. Their results indicated that applying TM data can reduce the number of samples and the inventory costs by 60% - 70% and can provide more reasonable volume and can- opy density estimates [6]. Xu et al. evaluated the ability of TM data for the estimation of oak forest canopy in dry season. Their results illustrated that the band TM3 had the highest correlation coefficient (–0.83) and the coeffi- cient of determination (0.69) with canopy. The NDVI index showed higher coefficients of correlation (0.84) and determination (0.70) with canopy than SR index. The cubic NDVI index had higher coefficients of correlation (0.85) and determination (0.73) with canopy [7]. Suarez et al. indicated that the SPOT4 and ETM+ have both a high capability to estimate stand height, diameter and basal area in afforested stands [8]. Jao et al. studied the estimation of canopy density on an ever-green oak forest using aerial photographs and TM satellite images and resulted that this estimation is reasonably possible [9]. Arzani et al. used Landsat satellite data to study the pro- duction and some vegetation characteristics in two dif- ferent climates. They found that the VNIR1 and VNIR2 indices show higher correlations with production, canopy percentage and foliage percentage in semi-arid areas, while in arid areas, the NDVI index had higher correla- tion with the vegetation characteristics [10]. Darvishsefat et al. applied the ETM+ data imagery for Haloxylon spp. canopy estimation and figured out the NDVI index has a reasonable correlation (r = 0.65) with density [11]. The objective of this study is to evaluate the capability of satellite imagery for the estimation of basal area in Nor- thern Zagros Forests. 2. Materials and Methods 2.1. Study Area The study area (15,700 ha) is located in a mountainous managed mixed forest (Northern Zagros forests) in Kur- distan province in the west of Iran (Figure 1 and Table 1). The study area is positioned in 45˚30′N to 46˚15′N longitude and 35˚45′E to 36˚15′E latitude. The elevation of the study area ranges from 1200 m to 2200 m above Figure 1. Study area location and sample plots distr i bution. Table 1. Descriptive statistics of basal area in studied stands. Minimum (m2/ha) Maximum (m2/ha) Std. deviation (m2/ha) Mean ± std. error (m2/ha) Stands 1.96 42.30 ±7.78 13.96 ± 0.43 Exclusive geographical direction 1.96 35.84 ±8.70 15.57 ± 0.88 Northern-faced forests (n = 96) 2.51 30.79 ±5.94 11.96 ± 0.66 Southern-faced forests (n = 78) 2.19 42.30 ±7.86 13.64 ± 0.88 Eastern-faced forests (n = 76) 2.39 35.30 ±7.76 14.18 ± 0.97 Western-faced forests (n = 62) sea level. Average annual precipitation is about 760 mm/year and average annual temperature is between 12˚C to 18˚C [1]. The dominant tree layer mainly consists of Quercus Libani Oliv. (more than 50%), Quercus brantii Lindl. (30%) and Quercus infectoria Oliv. (20%) with Crataegus spp, Pyrus spp, Acer cineracens and Pistacia mutica as the most common admixed tree species. 2.2. Satellite Data The data of the high resolution geometric (HRG) sensor of SPOT5 satellite dated in July 2005 were used for pur- poses of this study. Radiometric correction and orthorec- tification process was done by SPOT Imaging Corpora- tion. However, investigation of the quality of satellite images shows that these images have no radiometric dis- tortion. Overlaying of geocoded images with the digital topographic maps indicated that the images have high geometric precision. 2.3. Field Data and Regression Analysis A number of 319 circular plots (0.1 ha) were established using systematic random method in the study area. All Copyright © 2012 SciRes. IJG 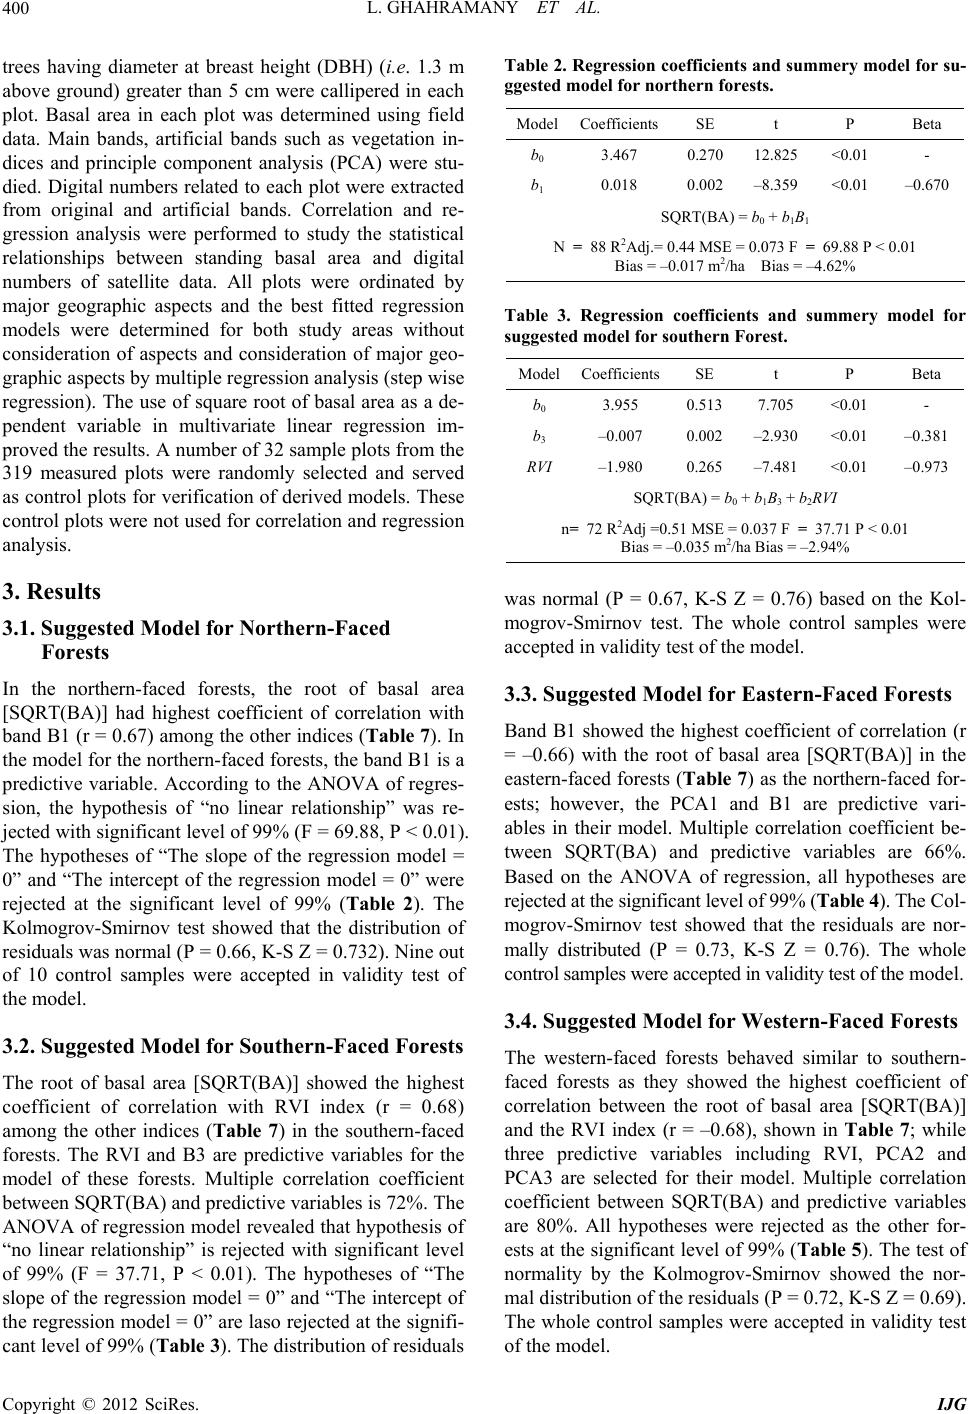 L. GHAHRAMANY ET AL. 400 trees having diameter at breast height (DBH) (i.e. 1.3 m above ground) greater than 5 cm were callipered in each plot. Basal area in each plot was determined using field data. Main bands, artificial bands such as vegetation in- dices and principle component analysis (PCA) were stu- died. Digital numbers related to each plot were extracted from original and artificial bands. Correlation and re- gression analysis were performed to study the statistical relationships between standing basal area and digital numbers of satellite data. All plots were ordinated by major geographic aspects and the best fitted regression models were determined for both study areas without consideration of aspects and consideration of major geo- graphic aspects by multiple regression analysis (step wise regression). The use of square root of basal area as a de- pendent variable in multivariate linear regression im- proved the results. A number of 32 sample plots from the 319 measured plots were randomly selected and served as control plots for verification of derived models. These control plots were not used for correlation and regression analysis. 3. Results 3.1. Suggested Model for Northern-Faced Forests In the northern-faced forests, the root of basal area [SQRT(BA)] had highest coefficient of correlation with band B1 (r = 0.67) among the other indices (Table 7). In the model for the northern-faced forests, the band B1 is a predictive variable. According to the ANOVA of regres- sion, the hypothesis of “no linear relationship” was re- jected with significant level of 99% (F = 69.88, P < 0.01). The hypotheses of “The slope of the regression model = 0” and “The intercept of the regression model = 0” were rejected at the significant level of 99% (Table 2). The Kolmogrov-Smirnov test showed that the distribution of residuals was normal (P = 0.66, K-S Z = 0.732). Nine out of 10 control samples were accepted in validity test of the model. 3.2. Suggested Model for Southern-Faced Forests The root of basal area [SQRT(BA)] showed the highest coefficient of correlation with RVI index (r = 0.68) among the other indices (Table 7) in the southern-faced forests. The RVI and B3 are predictive variables for the model of these forests. Multiple correlation coefficient between SQRT(BA) and predictive variables is 72%. The ANOVA of regression model revealed that hypothesis of “no linear relationship” is rejected with significant level of 99% (F = 37.71, P < 0.01). The hypotheses of “The slope of the regression model = 0” and “The intercept of the regression model = 0” are laso rejected at the signifi- cant level of 99% (Table 3). The distribution of residuals Table 2. Regression coefficients and summery model for su- ggested model for northern forests. Beta P t SE CoefficientsModel - <0.01 12.825 0.270 3.467 b0 –0.670 <0.01 –8.359 0.002 0.018 b1 SQRT(BA) = b0 + b1B1 N = 88 R2Adj.= 0.44 MSE = 0.073 F = 69.88 P < 0.01 Bias = –0.017 m2/ha Bias = –4.62% Table 3. Regression coefficients and summery model for suggested model for southern Forest. Beta P t SE CoefficientsModel - <0.01 7.705 0.513 3.955 b0 –0.381 <0.01 –2.930 0.002 –0.007 b3 –0.973 <0.01 –7.481 0.265 –1.980 RVI SQRT(BA) = b0 + b1B3 + b2RVI n= 72 R2Adj =0.51 MSE = 0.037 F = 37.71 P < 0.01 Bias = –0.035 m2/ha Bias = –2.94% was normal (P = 0.67, K-S Z = 0.76) based on the Kol- mogrov-Smirnov test. The whole control samples were accepted in validity test of the model. 3.3. Suggested Model for Eastern-Faced Forests Band B1 showed the highest coefficient of correlation (r = –0.66) with the root of basal area [SQRT(BA)] in the eastern-faced forests (Table 7) as the northern-faced for- ests; however, the PCA1 and B1 are predictive vari- ables in their model. Multiple correlation coefficient be- tween SQRT(BA) and predictive variables are 66%. Based on the ANOVA of regression, all hypotheses are rejected at the significant level of 99% (Table 4). The Col- mogrov-Smirnov test showed that the residuals are nor- mally distributed (P = 0.73, K-S Z = 0.76). The whole control samples were accepted in validity test of the model. 3.4. Suggested Model for Western-Faced Forests The western-faced forests behaved similar to southern- faced forests as they showed the highest coefficient of correlation between the root of basal area [SQRT(BA)] and the RVI index (r = –0.68), shown in Table 7; while three predictive variables including RVI, PCA2 and PCA3 are selected for their model. Multiple correlation coefficient between SQRT(BA) and predictive variables are 80%. All hypotheses were rejected as the other for- ests at the significant level of 99% (Ta ble 5). The test of normality by the Kolmogrov-Smirnov showed the nor- mal distribution of the residuals (P = 0.72, K-S Z = 0.69). The whole control samples were accepted in validity test of the model. Copyright © 2012 SciRes. IJG 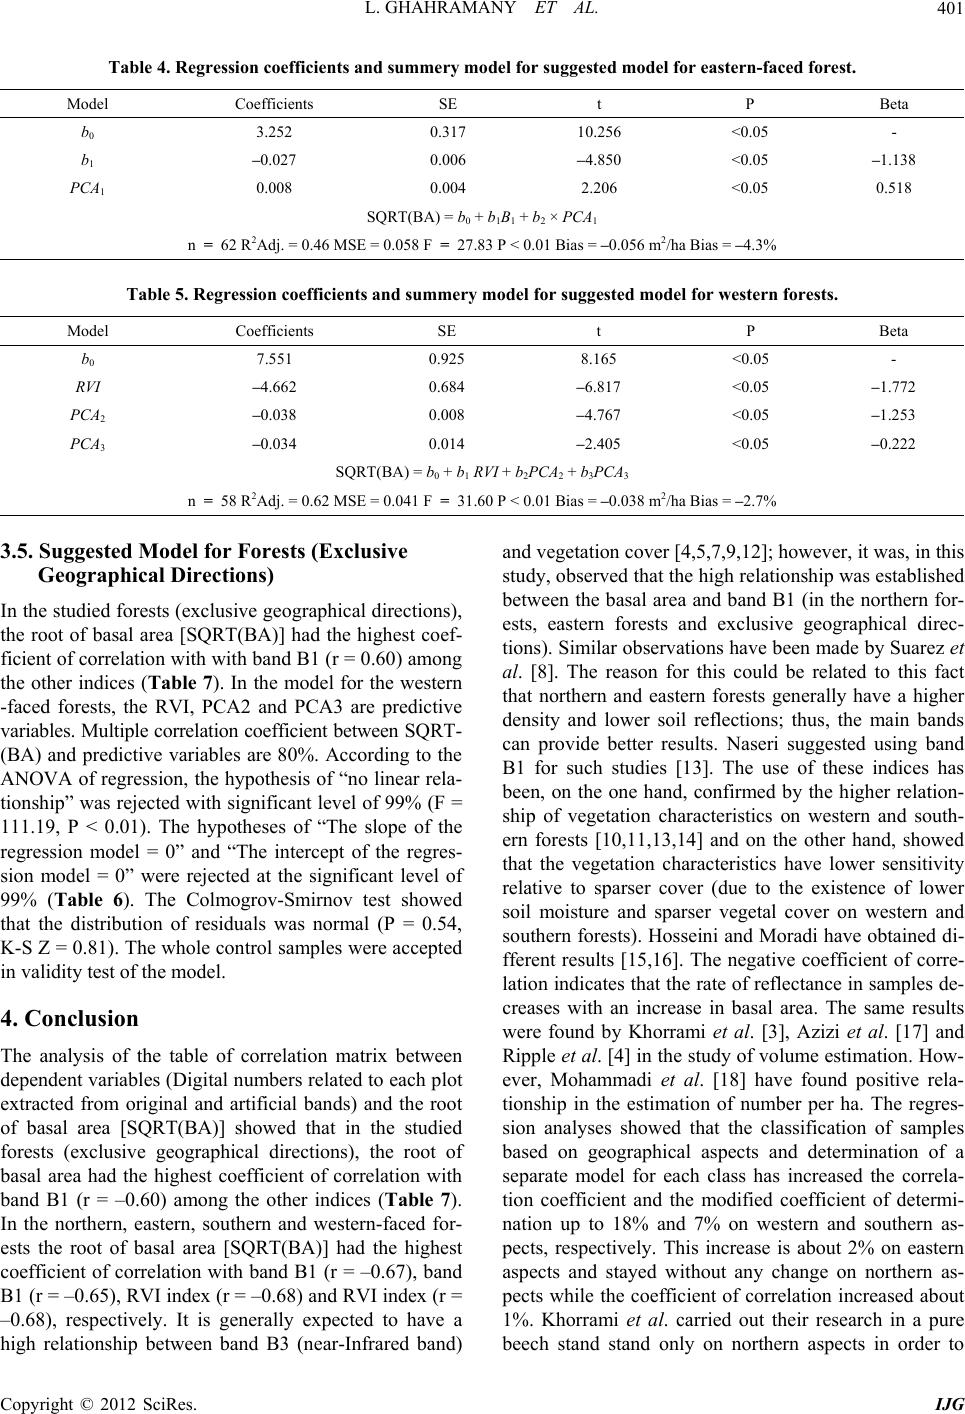 L. GHAHRAMANY ET AL. Copyright © 2012 SciRes. IJG 401 Table 4. Regression coefficients and summery model for suggested model for eastern-faced forest. Beta P t SE Coefficients Model - <0.05 10.256 0.317 3.252 b0 –1.138 <0.05 –4.850 0.006 –0.027 b1 0.518 <0.05 2.206 0.004 0.008 PCA1 SQRT(BA) = b0 + b1B1 + b2 × PCA1 n = 62 R2Adj. = 0.46 MSE = 0.058 F = 27.83 P < 0.01 Bias = –0.056 m2/ha Bias = –4.3% Table 5. Regression coefficients and summery model for suggested model for western forests. Beta P t SE Coefficients Model - <0.05 8.165 0.925 7.551 b0 –1.772 <0.05 –6.817 0.684 –4.662 RVI –1.253 <0.05 –4.767 0.008 –0.038 PCA2 –0.222 <0.05 –2.405 0.014 –0.034 PCA3 SQRT(BA) = b0 + b1 RVI + b2PCA2 + b3PCA3 n = 58 R2Adj. = 0.62 MSE = 0.041 F = 31.60 P < 0.01 Bias = –0.038 m2/ha Bias = –2.7% 3.5. Suggested Model for Forests (Exclusive Geographical Directions) In the studied forests (exclusive geographical directions), the root of basal area [SQRT(BA)] had the highest coef- ficient of correlation with with band B1 (r = 0.60) among the other indices (Table 7). In the model for the western -faced forests, the RVI, PCA2 and PCA3 are predictive variables. Multiple correlation coefficient between SQRT- (BA) and predictive variables are 80%. According to the ANOVA of regression, the hypothesis of “no linear rela- tionship” was rejected with significant level of 99% (F = 111.19, P < 0.01). The hypotheses of “The slope of the regression model = 0” and “The intercept of the regres- sion model = 0” were rejected at the significant level of 99% (Table 6). The Colmogrov-Smirnov test showed that the distribution of residuals was normal (P = 0.54, K-S Z = 0.81). The whole control samples were accepted in validity test of the model. 4. Conclusion The analysis of the table of correlation matrix between dependent variables (Digital numbers related to each plot extracted from original and artificial bands) and the root of basal area [SQRT(BA)] showed that in the studied forests (exclusive geographical directions), the root of basal area had the highest coefficient of correlation with band B1 (r = –0.60) among the other indices (Table 7). In the northern, eastern, southern and western-faced for- ests the root of basal area [SQRT(BA)] had the highest coefficient of correlation with band B1 (r = –0.67), band B1 (r = –0.65), RVI index (r = –0.68) and RVI index (r = –0.68), respectively. It is generally expected to have a high relationship between band B3 (near-Infrared band) and vegetation cover [4,5,7,9,12]; however, it was, in this study, observed that the high relationship was established between the basal area and band B1 (in the northern for- ests, eastern forests and exclusive geographical direc- tions). Similar observations have been made by Suarez et al. [8]. The reason for this could be related to this fact that northern and eastern forests generally have a higher density and lower soil reflections; thus, the main bands can provide better results. Naseri suggested using band B1 for such studies [13]. The use of these indices has been, on the one hand, confirmed by the higher relation- ship of vegetation characteristics on western and south- ern forests [10,11,13,14] and on the other hand, showed that the vegetation characteristics have lower sensitivity relative to sparser cover (due to the existence of lower soil moisture and sparser vegetal cover on western and southern forests). Hosseini and Moradi have obtained di- fferent results [15,16]. The negative coefficient of corre- lation indicates that the rate of reflectance in samples de- creases with an increase in basal area. The same results were found by Khorrami et al. [3], Azizi et al. [17] and Ripple et al. [4] in the study of volume estimation. How- ever, Mohammadi et al. [18] have found positive rela- tionship in the estimation of number per ha. The regres- sion analyses showed that the classification of samples based on geographical aspects and determination of a separate model for each class has increased the correla- tion coefficient and the modified coefficient of determi- nation up to 18% and 7% on western and southern as- pects, respectively. This increase is about 2% on eastern aspects and stayed without any change on northern as- pects while the coefficient of correlation increased about 1%. Khorrami et al. carried out their research in a pure beech stand stand only on northern aspects in order to  L. GHAHRAMANY ET AL. 402 Table 6. Regression coefficients and summery model for suggested model for studied forests (exclusive geographical direc- tions). Beta P t SE Coefficients Model - <0.01 22.406 0.141 3.153 b0 −0.426 <0.01 −7.285 0.001 −0.009 B1 −1.920 <0.01 −6.389 0.124 −0.794 RVI SQRT(BA) = b0 + b1B1 + b2RVI n = 287 R2Adj. = 0.44 MSE = 0.062 F = 111.19 P < 0.01 Bias = −0.061 m2/ha Bias = −4.6% Table 7. Pearson’s correlation coefficient between standing volume of sample plots and corresponded spectral values (DNs) in original bands. Northern-faced forests (n = 88) PCA3PCA2PCA1 TVI SAVINRVIRVI NDVIIPVI DVI AVI B3 B2 B1 Main bands, artificial bands Dependent Variable **0.39- **0.6 **0.57- **0.51 **0.49 **0.49- **0.53- **0.49 **0.49 **0.46 **0.46 0.05- **0.61- **0.67- SQRT(BA) Southern-faced forests (n = 72) *0.27- **0.61*0.24- **0.68 **0.67 **0.67- **0.68- **0.67 **0.67 **0.67 **0.67 **0.37 **0.40- **0.56- SQRT(BA) Eastern-faced forests (n = 69) **0.36- **0.40 **0.53- **0.54 **0.54 **0.54- **0.55- **0.54- **0.54 **0.53- **0.53- 0.05- **0.59- **0.66- SQRT(BA) Western-faced forests (n = 58) **0.43- **0.53 **0.46- **0.38 **0.67 **0.67- **0.68- **0.67 **0.67 **0.66 **0.66 0.05 **0.55- **0.65- SQRT(BA) Studied Forests (exclusive geographical directions) (n = 287) **0.38- **0.44 **0.44- **0.57 **0.55 **0.55- **0.58- **0.55 *0.55 **0.53 **0.53 0.06 **0.52- **0.60- SQRT(BA) **Significant at 99% confidence level; *Significant at 95% confidence level; ns: No significant. eliminate the effect of geographical aspects [3]. In this research, applying of regression analysis led to better results and Naseri [13], Hosseini [15], and Xu et al. [7] confirmed these findings. The use of mathematical trans- formations such as logarithmic function, power func- tion, root function, and reciprocal function on de pen- dent variable (basal area) and their relationships with independent variable resulted in an increase in correla- tion coefficient such that the maximum coefficient was obtained between the root of basal area and the inde- pendent variable. Many previous studies have obtained better results when using logarithmic functions [3,4,7,17]. In Iran, many studies on quantitative characteristics of forest stands have conducted in northern forests with a high density of deciduous trees. In this research, the co- efficient of correlation was determined 66% (exclusive geographical directions) and it was reached 80% when considering the geographical aspects. The low canopy density of Zagros forests and the similarity of the results with other studies can be a good indication of relatively reasonable capability of SPOT data for the study area [3,17]. REFERENCES [1] H. Ghazanfari, “Study of Growth and Diameter Distribu- tion, in Quercus Libanii-Quercus Brantii Stands in Order to Preparing the Forest Regulation Method in Bane Re- gion, (Case Study: Havarh-Khole, Baneh, Iran),” Ph.D. Dissertation, College of Natural Resources, University of Tehran, Tehran, 2003. [2] N. P. Anuchin, “Forest Biometry,” Moscow, 1982. [3] R. Khorrami, A. A. Darvishsefat and M. Namiranian, “Efficiency of ETM+ Satellite Data in Estimating Beech Stands Volume, (Case Study: Sangdeh Forests, Iran),” Iranian Journal of Natural Resources, Vol. 60, No. 4, 2007, pp. 1281-1289. [4] W. J. Ripple, S. Wang, D. L. Isaacson and D. P. Paine, “A Preliminary Comparison of Landsat TM and Spot-1 HRV Multispectral Data for Estimating Coniferous Forest Volume,” International Journal of Remote Sensing, Vol. 12, No. 9, 1991, pp. 1971-1977. doi:10.1080/01431169108955230 [5] J. A. Brockhause and S. Khoram, “A comparison of Spot and Landsat-TM Data for Use in Conducting Invetiries of Forest Resources,” International Journal of Remote Sens- ing, Vol. 13, No. 16, 1992, pp. 3035-3043. doi:10.1080/01431169208904100 Copyright © 2012 SciRes. IJG 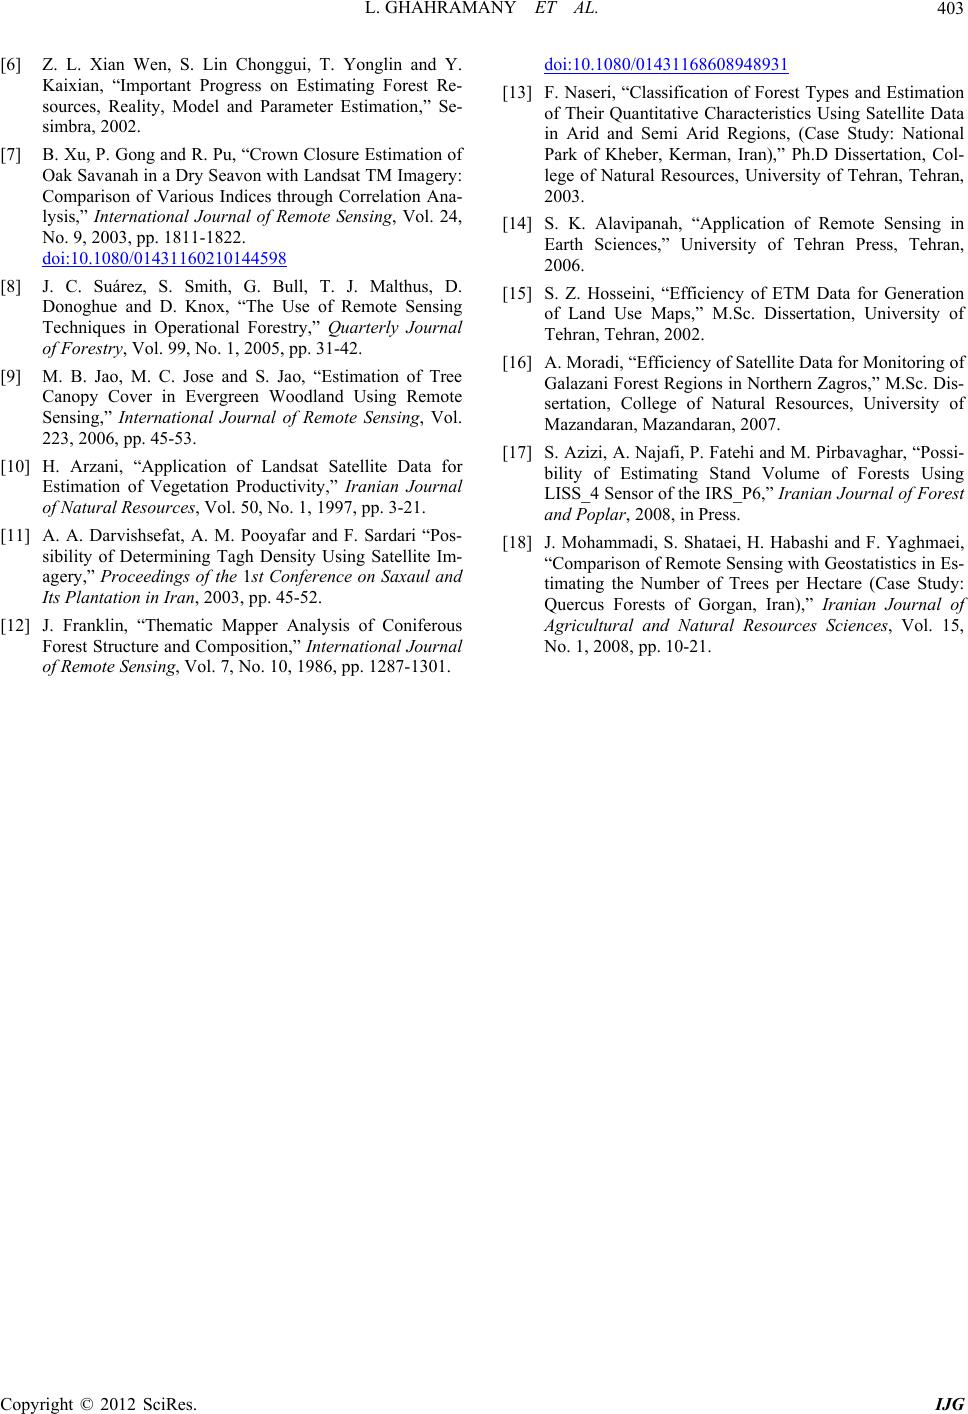 L. GHAHRAMANY ET AL. 403 [6] Z. L. Xian Wen, S. Lin Chonggui, T. Yonglin and Y. Kaixian, “Important Progress on Estimating Forest Re- sources, Reality, Model and Parameter Estimation,” Se- simbra, 2002. [7] B. Xu, P. Gong and R. Pu, “Crown Closure Estimation of Oak Savanah in a Dry Seavon with Landsat TM Imagery: Comparison of Various Indices through Correlation Ana- lysis,” International Journal of Remote Sensing, Vol. 24, No. 9, 2003, pp. 1811-1822. doi:10.1080/01431160210144598 [8] J. C. Suárez, S. Smith, G. Bull, T. J. Malthus, D. Donoghue and D. Knox, “The Use of Remote Sensing Techniques in Operational Forestry,” Quarterly Journal of Forestry, Vol. 99, No. 1, 2005, pp. 31-42. [9] M. B. Jao, M. C. Jose and S. Jao, “Estimation of Tree Canopy Cover in Evergreen Woodland Using Remote Sensing,” International Journal of Remote Sensing, Vol. 223, 2006, pp. 45-53. [10] H. Arzani, “Application of Landsat Satellite Data for Estimation of Vegetation Productivity,” Iranian Journal of Natural Resources, Vol. 50, No. 1, 1997, pp. 3-21. [11] A. A. Darvishsefat, A. M. Pooyafar and F. Sardari “Pos- sibility of Determining Tagh Density Using Satellite Im- agery,” Proceedings of the 1st Conference on Saxaul and Its Plantation in Iran, 2003, pp. 45-52. [12] J. Franklin, “Thematic Mapper Analysis of Coniferous Forest Structure and Composition,” International Journal of Remote Sensing, Vol. 7, No. 10, 1986, pp. 1287-1301. doi:10.1080/01431168608948931 [13] F. Naseri, “Classification of Forest Types and Estimation of Their Quantitative Characteristics Using Satellite Data in Arid and Semi Arid Regions, (Case Study: National Park of Kheber, Kerman, Iran),” Ph.D Dissertation, Col- lege of Natural Resources, University of Tehran, Tehran, 2003. [14] S. K. Alavipanah, “Application of Remote Sensing in Earth Sciences,” University of Tehran Press, Tehran, 2006. [15] S. Z. Hosseini, “Efficiency of ETM Data for Generation of Land Use Maps,” M.Sc. Dissertation, University of Tehran, Tehran, 2002. [16] A. Moradi, “Efficiency of Satellite Data for Monitoring of Galazani Forest Regions in Northern Zagros,” M.Sc. Dis- sertation, College of Natural Resources, University of Mazandaran, Mazandaran, 2007. [17] S. Azizi, A. Najafi, P. Fatehi and M. Pirbavaghar, “Possi- bility of Estimating Stand Volume of Forests Using LISS_4 Sensor of the IRS_P6,” Iranian Journal of Forest and Poplar, 2008, in Press. [18] J. Mohammadi, S. Shataei, H. Habashi and F. Yaghmaei, “Comparison of Remote Sensing with Geostatistics in Es- timating the Number of Trees per Hectare (Case Study: Quercus Forests of Gorgan, Iran),” Iranian Journal of Agricultural and Natural Resources Sciences, Vol. 15, No. 1, 2008, pp. 10-21. Copyright © 2012 SciRes. IJG |