

Paper Menu >>
Journal Menu >>
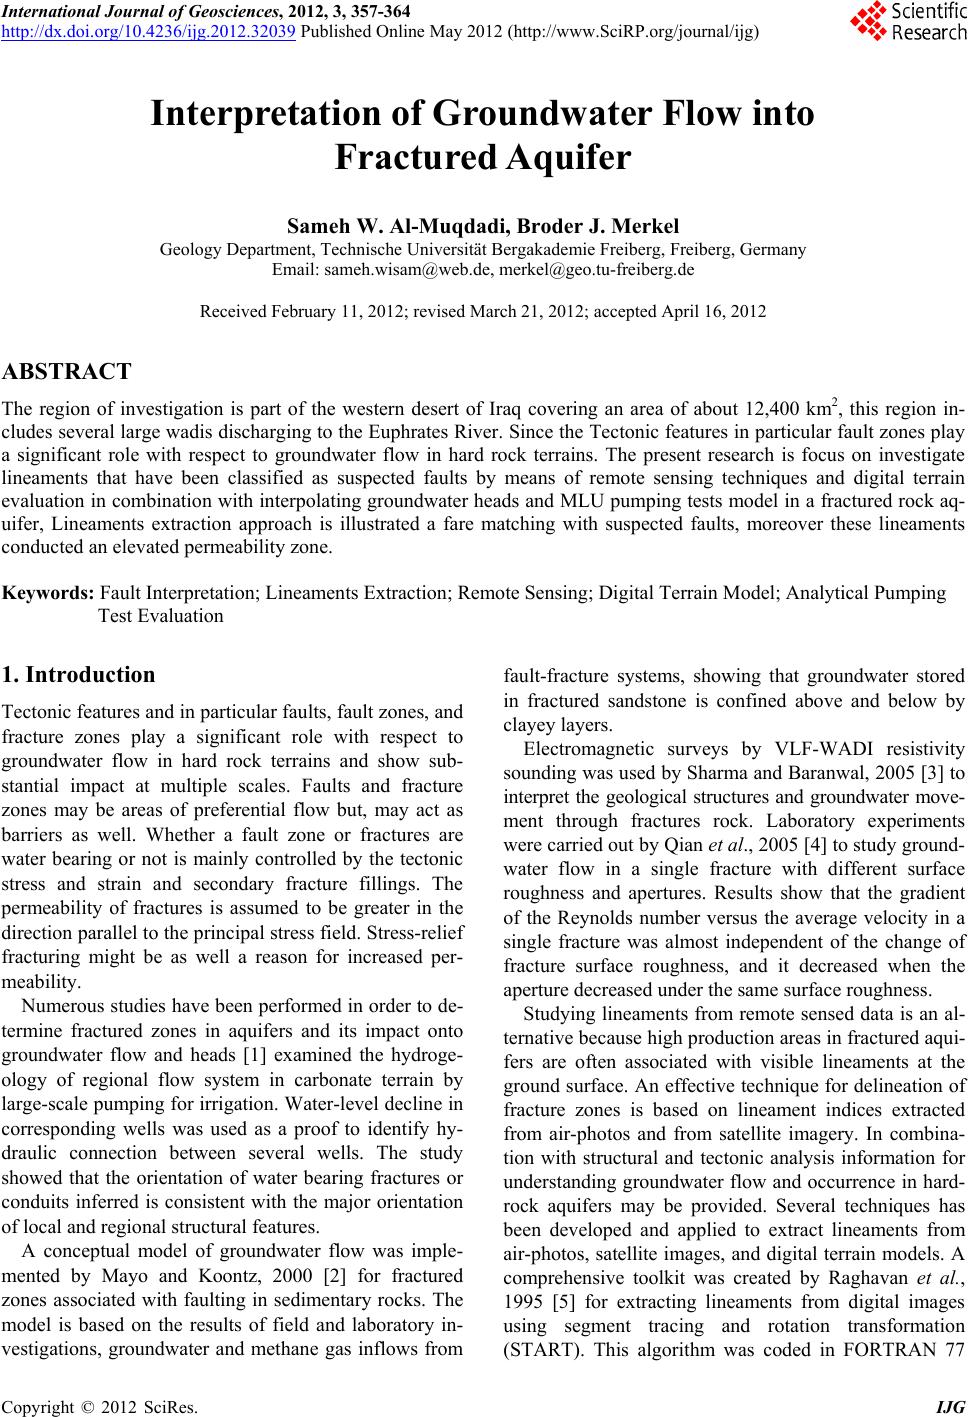 International Journal of Geosciences, 2012, 3, 357-364 http://dx.doi.org/10.4236/ijg.2012.32039 Published Online May 2012 (http://www.SciRP.org/journal/ijg) Interpretation of Groundwater Flow into Fractured Aquifer Sameh W. Al-Muqdadi, Broder J. Merkel Geology Department, Technische Universität Bergakademie Freiberg, Freiberg, Germany Email: sameh.wisa[email protected], [email protected] Received February 11, 2012; revised March 21, 2012; accepted April 16, 2012 ABSTRACT The region of investigation is part of the western desert of Iraq covering an area of about 12,400 km2, this region in- cludes several large wadis discharging to the Euphrates River. Since the Tectonic features in particular fault zones play a significant role with respect to groundwater flow in hard rock terrains. The present research is focus on investigate lineaments that have been classified as suspected faults by means of remote sensing techniques and digital terrain evaluation in combination with interpolating groundwater heads and MLU pumping tests model in a fractured rock aq- uifer, Lineaments extraction approach is illustrated a fare matching with suspected faults, moreover these lineaments conducted an elevated permeability zone. Keywords: Fault Interpretation; Lineaments Extraction; Remote Sensing; Digital Terrain Model; Analytical Pumping Test Evaluation 1. Introduction Tectonic features and in particular faults, fault zones, and fracture zones play a significant role with respect to groundwater flow in hard rock terrains and show sub- stantial impact at multiple scales. Faults and fracture zones may be areas of preferential flow but, may act as barriers as well. Whether a fault zone or fractures are water bearing or not is mainly controlled by the tectonic stress and strain and secondary fracture fillings. The permeability of fractures is assumed to be greater in the direction parallel to the principal stress field. Stress-relief fracturing might be as well a reason for increased per- meability. Numerous studies have been performed in order to de- termine fractured zones in aquifers and its impact onto groundwater flow and heads [1] examined the hydroge- ology of regional flow system in carbonate terrain by large-scale pumping for irrigation. Water-level decline in corresponding wells was used as a proof to identify hy- draulic connection between several wells. The study showed that the orientation of water bearing fractures or conduits inferred is consistent with the major orientation of local and regional structural features. A conceptual model of groundwater flow was imple- mented by Mayo and Koontz, 2000 [2] for fractured zones associated with faulting in sedimentary rocks. The model is based on the results of field and laboratory in- vestigations, groundwater and methane gas inflows from fault-fracture systems, showing that groundwater stored in fractured sandstone is confined above and below by clayey layers. Electromagnetic surveys by VLF-WADI resistivity sounding was used by Sharma and Baranwal, 2005 [3] to interpret the geological structures and groundwater move- ment through fractures rock. Laboratory experiments were carried out by Qian et al., 2005 [4] to study ground- water flow in a single fracture with different surface roughness and apertures. Results show that the gradient of the Reynolds number versus the average velocity in a single fracture was almost independent of the change of fracture surface roughness, and it decreased when the aperture decreased under the same surface roughness. Studying lineaments from remote sensed data is an al- ternative because high production areas in fractured aqui- fers are often associated with visible lineaments at the ground surface. An effective technique for delineation of fracture zones is based on lineament indices extracted from air-photos and from satellite imagery. In combina- tion with structural and tectonic analysis information for understanding groundwater flow and occurrence in hard- rock aquifers may be provided. Several techniques has been developed and applied to extract lineaments from air-photos, satellite images, and digital terrain models. A comprehensive toolkit was created by Raghavan et al., 1995 [5] for extracting lineaments from digital images using segment tracing and rotation transformation (START). This algorithm was coded in FORTRAN 77 C opyright © 2012 SciRes. IJG 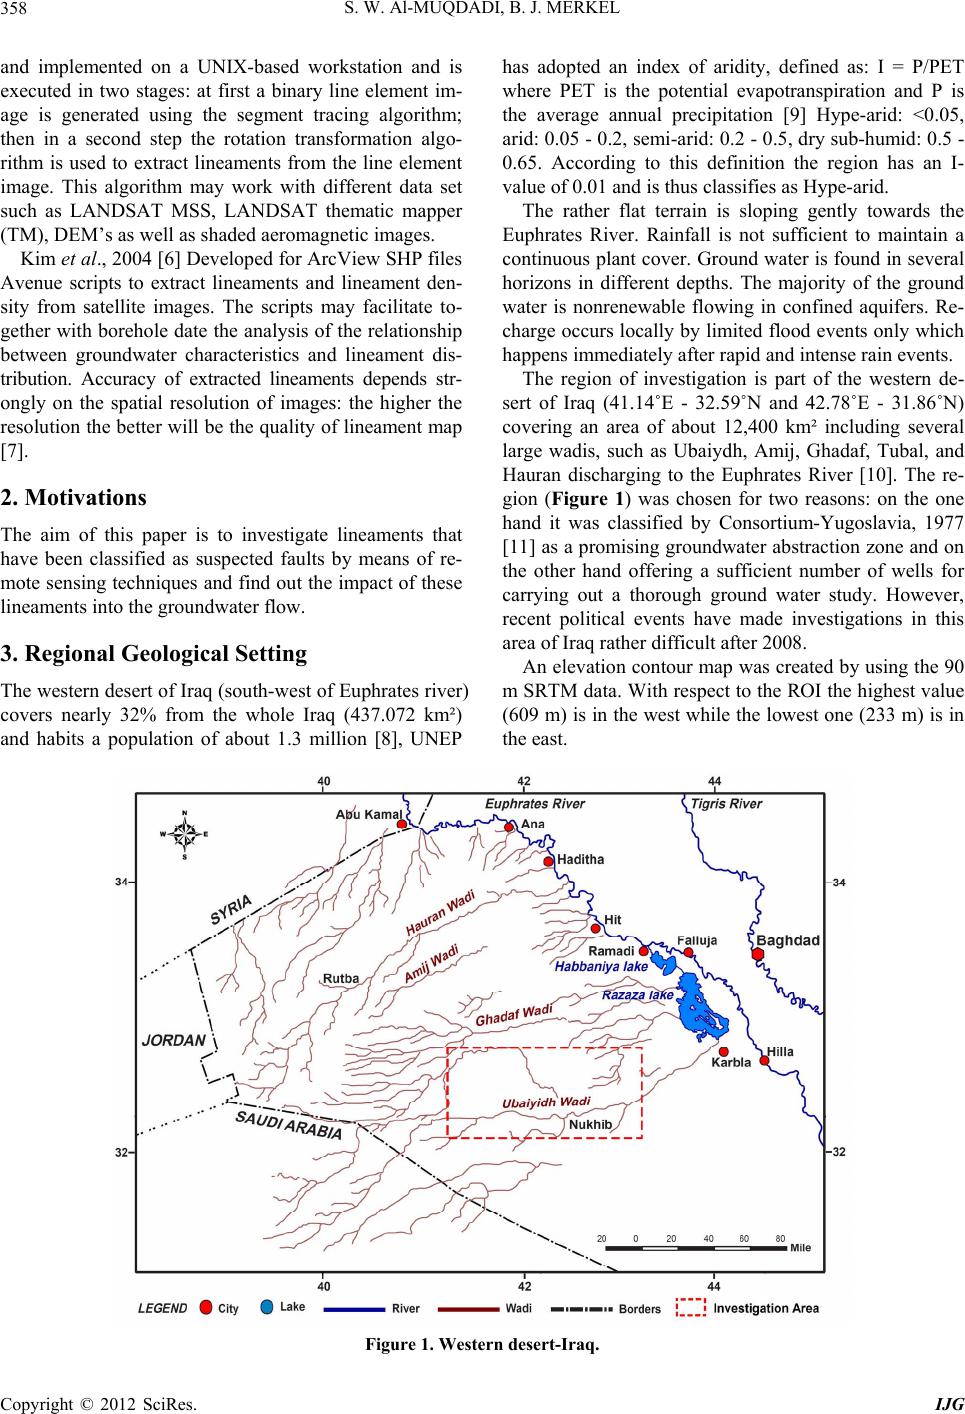 S. W. Al-MUQDADI, B. J. MERKEL 358 and implemented on a UNIX-based workstation and is executed in two stages: at first a binary line element im- age is generated using the segment tracing algorithm; then in a second step the rotation transformation algo- rithm is used to extract lineaments from the line element image. This algorithm may work with different data set such as LANDSAT MSS, LANDSAT thematic mapper (TM), DEM’s as well as shaded aeromagnetic images. Kim et al., 2004 [6] Developed for ArcView SHP files Avenue scripts to extract lineaments and lineament den- sity from satellite images. The scripts may facilitate to- gether with borehole date the analysis of the relationship between groundwater characteristics and lineament dis- tribution. Accuracy of extracted lineaments depends str- ongly on the spatial resolution of images: the higher the resolution the better will be the quality of lineament map [7]. 2. Motivations The aim of this paper is to investigate lineaments that have been classified as suspected faults by means of re- mote sensing techniques and find out the impact of these lineaments into the groundwater flow. 3. Regional Geological Setting The western desert of Iraq (south-west of Euphrates river) covers nearly 32% from the whole Iraq (437.072 km²) and habits a population of about 1.3 million [8], UNEP has adopted an index of aridity, defined as: I = P/PET where PET is the potential evapotranspiration and P is the average annual precipitation [9] Hype-arid: <0.05, arid: 0.05 - 0.2, semi-arid: 0.2 - 0.5, dry sub-humid: 0.5 - 0.65. According to this definition the region has an I- value of 0.01 and is thus classifies as Hype-arid. The rather flat terrain is sloping gently towards the Euphrates River. Rainfall is not sufficient to maintain a continuous plant cover. Ground water is found in several horizons in different depths. The majority of the ground water is nonrenewable flowing in confined aquifers. Re- charge occurs locally by limited flood events only which happens immediately after rapid and intense rain events. The region of investigation is part of the western de- sert of Iraq (41.14˚E - 32.59˚N and 42.78˚E - 31.86˚N) covering an area of about 12,400 km² including several large wadis, such as Ubaiydh, Amij, Ghadaf, Tubal, and Hauran discharging to the Euphrates River [10]. The re- gion (Figure 1) was chosen for two reasons: on the one hand it was classified by Consortium-Yugoslavia, 1977 [11] as a promising groundwater abstraction zone and on the other hand offering a sufficient number of wells for carrying out a thorough ground water study. However, recent political events have made investigations in this area of Iraq rather difficult after 2008. An elevation contour map was created by using the 90 m SRTM data. With respect to the ROI the highest value (609 m) is in the west while the lowest one (233 m) is in the east. Figure 1. Western desert-Iraq. Copyright © 2012 SciRes. IJG 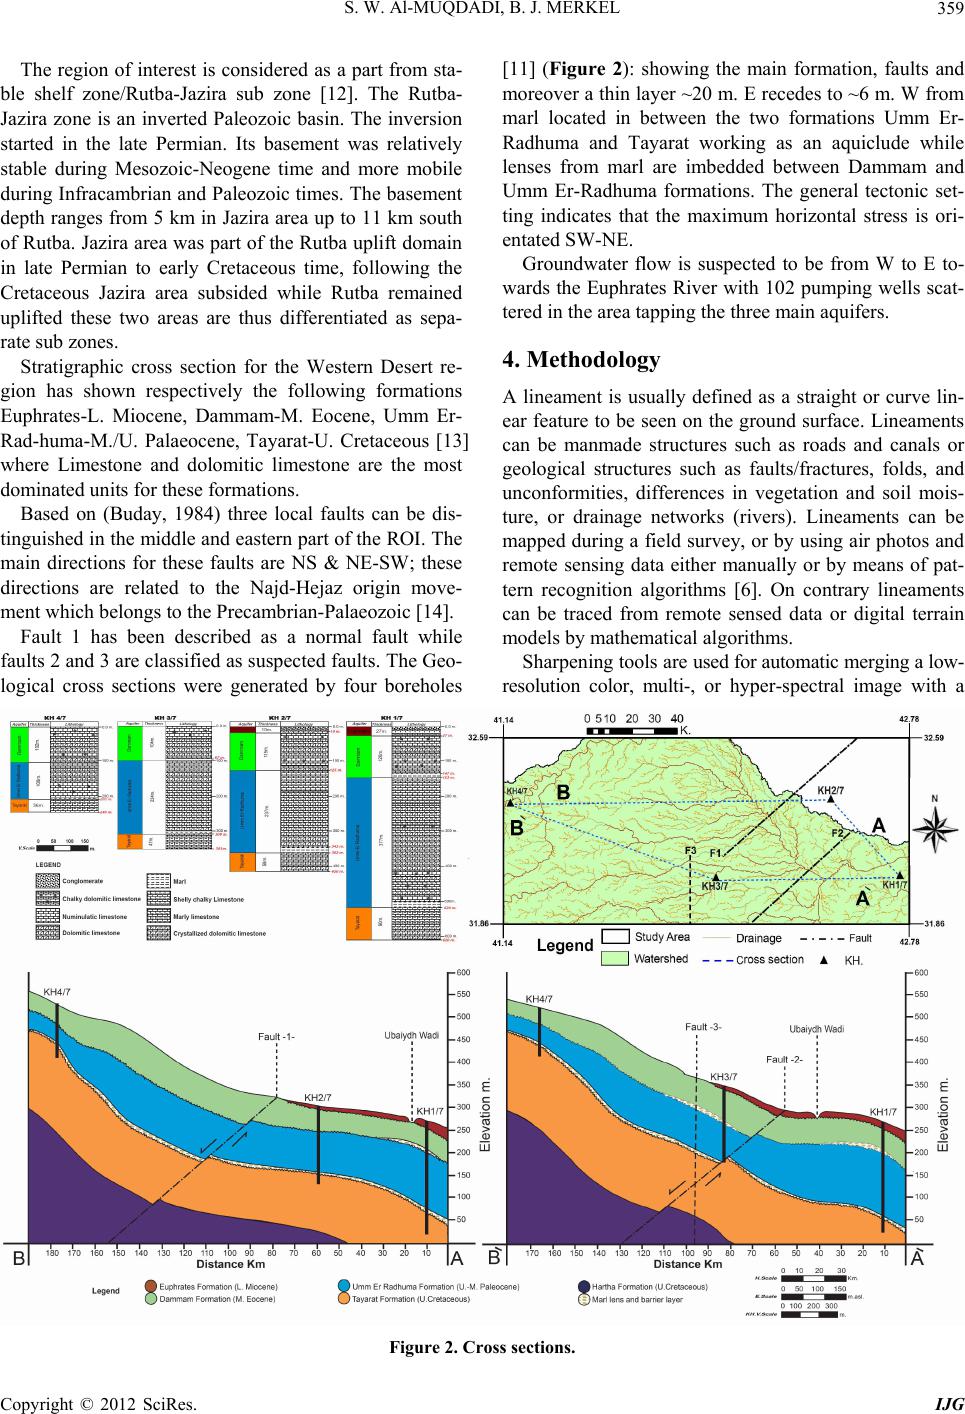 S. W. Al-MUQDADI, B. J. MERKEL 359 The region of interest is considered as a part from sta- ble shelf zone/Rutba-Jazira sub zone [12]. The Rutba- Jazira zone is an inverted Paleozoic basin. The inversion started in the late Permian. Its basement was relatively stable during Mesozoic-Neogene time and more mobile during Infracambrian and Paleozoic times. The basement depth ranges from 5 km in Jazira area up to 11 km south of Rutba. Jazira area was part of the Rutba uplift domain in late Permian to early Cretaceous time, following the Cretaceous Jazira area subsided while Rutba remained uplifted these two areas are thus differentiated as sepa- rate sub zones. Stratigraphic cross section for the Western Desert re- gion has shown respectively the following formations Euphrates-L. Miocene, Dammam-M. Eocene, Umm Er- Rad-huma-M./U. Palaeocene, Tayarat-U. Cretaceous [13] where Limestone and dolomitic limestone are the most dominated units for these formations. Based on (Buday, 1984) three local faults can be dis- tinguished in the middle and eastern part of the ROI. The main directions for these faults are NS & NE-SW; these directions are related to the Najd-Hejaz origin move- ment which belongs to the Precambrian-Palaeozoic [14]. Fault 1 has been described as a normal fault while faults 2 and 3 are classified as suspected faults. The Geo- logical cross sections were generated by four boreholes [11] (Figure 2): showing the main formation, faults and moreover a thin layer ~20 m. E recedes to ~6 m. W from marl located in between the two formations Umm Er- Radhuma and Tayarat working as an aquiclude while lenses from marl are imbedded between Dammam and Umm Er-Radhuma formations. The general tectonic set- ting indicates that the maximum horizontal stress is ori- entated SW-NE. Groundwater flow is suspected to be from W to E to- wards the Euphrates River with 102 pumping wells scat- tered in the area tapping the three main aquifers. 4. Methodology A lineament is usually defined as a straight or curve lin- ear feature to be seen on the ground surface. Lineaments can be manmade structures such as roads and canals or geological structures such as faults/fractures, folds, and unconformities, differences in vegetation and soil mois- ture, or drainage networks (rivers). Lineaments can be mapped during a field survey, or by using air photos and remote sensing data either manually or by means of pat- tern recognition algorithms [6]. On contrary lineaments can be traced from remote sensed data or digital terrain models by mathematical algorithms. Sharpening tools are used for automatic merging a low- resolution color, multi-, or hyper-spectral image with a Figure 2. Cross sections. Copyright © 2012 SciRes. IJG 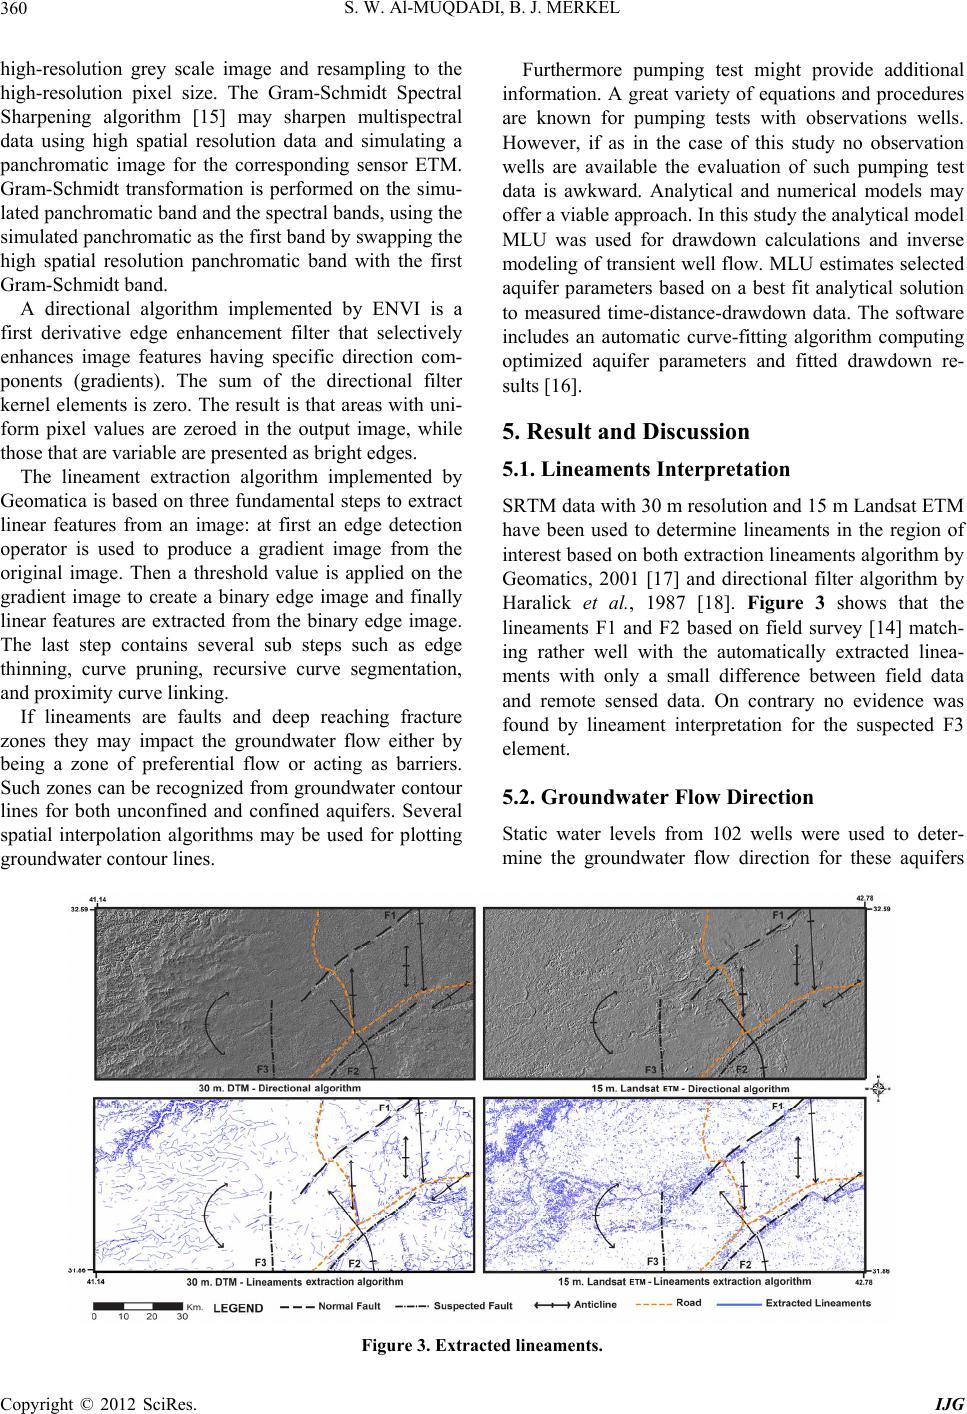 S. W. Al-MUQDADI, B. J. MERKEL 360 high-resolution grey scale image and resampling to the high-resolution pixel size. The Gram-Schmidt Spectral Sharpening algorithm [15] may sharpen multispectral data using high spatial resolution data and simulating a panchromatic image for the corresponding sensor ETM. Gram-Schmidt transformation is performed on the simu- lated panchromatic band and the spectral bands, using the simulated panchromatic as the first band by swapping the high spatial resolution panchromatic band with the first Gram-Schmidt band. A directional algorithm implemented by ENVI is a first derivative edge enhancement filter that selectively enhances image features having specific direction com- ponents (gradients). The sum of the directional filter kernel elements is zero. The result is that areas with uni- form pixel values are zeroed in the output image, while those that are variable are presented as bright edges. The lineament extraction algorithm implemented by Geomatica is based on three fundamental steps to extract linear features from an image: at first an edge detection operator is used to produce a gradient image from the original image. Then a threshold value is applied on the gradient image to create a binary edge image and finally linear features are extracted from the binary edge image. The last step contains several sub steps such as edge thinning, curve pruning, recursive curve segmentation, and proximity curve linking. If lineaments are faults and deep reaching fracture zones they may impact the groundwater flow either by being a zone of preferential flow or acting as barriers. Such zones can be recognized from groundwater contour lines for both unconfined and confined aquifers. Several spatial interpolation algorithms may be used for plotting groundwater contour lines. Furthermore pumping test might provide additional information. A great variety of equations and procedures are known for pumping tests with observations wells. However, if as in the case of this study no observation wells are available the evaluation of such pumping test data is awkward. Analytical and numerical models may offer a viable approach. In this study the analytical model MLU was used for drawdown calculations and inverse modeling of transient well flow. MLU estimates selected aquifer parameters based on a best fit analytical solution to measured time-distance-drawdown data. The software includes an automatic curve-fitting algorithm computing optimized aquifer parameters and fitted drawdown re- sults [16]. 5. Result and Discussion 5.1. Lineaments Interpretation SRTM data with 30 m resolution and 15 m Landsat ETM have been used to determine lineaments in the region of interest based on both extraction lineaments algorithm by Geomatics, 2001 [17] and directional filter algorithm by Haralick et al., 1987 [18]. Figure 3 shows that the lineaments F1 and F2 based on field survey [14] match- ing rather well with the automatically extracted linea- ments with only a small difference between field data and remote sensed data. On contrary no evidence was found by lineament interpretation for the suspected F3 element. 5.2. Groundwater Flow Direction Static water levels from 102 wells were used to deter- mine the groundwater flow direction for these aquifers Figure 3. Extracted lineaments. Copyright © 2012 SciRes. IJG  S. W. Al-MUQDADI, B. J. MERKEL 361 by using different spatial interpolation algorithms. (Fig- ure 4) shows the groundwater flow net for the three aq- uifers using minimum curvature algorithm [19]. Kriging [20] and radial basis function [21] did not result in sig- nificant different contour lines. The main flow direction is W-E with the highest value in the NW (~487.5 masl./ well 5) while the lowest was in the NE (~189.8 masl./ well 31). Between the fault lines F1 and F2 the groundwater gradient is less steep than in the total area and the flow direction is diverted slightly from the general W-E direc- tion to ESE. This can be explained by a better permeabi- lity in the area between F1 and F2. The main stress direc- tion is ~40˚ and thus almost parallel to F1 and F2; per- pendicular to this an anticline is assumed [14]. Thus it can be speculated that the entire area between F1 and F2 is showing a denser fracturing than the rest of the region of interest. Evidence for any impact on the groundwater hydraulics by the assumed F3 lineament was not found. Therefore the existence of this lineament F3 has to be negated. 5.3. Pumping Test by Means of MLU Model Two pumping test were performed close to the lineament F2 in the unconfined aquifer Dammam using the wells 9 and 17, the location for both wells is shown in the groundwater flow net (Figure 4). Table 1 shows that there is a slight difference in depth to the groundwater between databank and field records. No adjustment of the pumping rate was possible and observation wells were Figure 4. Groundwater flow net. Copyright © 2012 SciRes. IJG  S. W. Al-MUQDADI, B. J. MERKEL 362 not available. Pumping rate was determined by means of a stop watch filling a gradient container. Drawdown was monitored with a depth sounder in the pumping wells. Pumping test in well no 9 was performed for 420 min- utes to reach steady state, and then pump was switched off to monitor recovery reaching the former static level after 72 min (Table 2). Pumping test in well no 17 was performed for 360 min to reach steady state and then pump was switched off to monitor recovery which was reached after 300 minutes (Table 3). Results of pumping test and recovery evaluated with the analytical model MLU for Windows are presented in Figures 5 and 6, Results shown that well 17 has given a higher Transiti- vity value 0.1048 m2/min in compare with well 9 where T = 0.0832 m2/min, this results support the assumption of unique elevated permeability zone occurred in between of the F1 and F2 because of the tectonic stress and the anticline structure. 6. Conclusion The lineaments F1 and F2 recognized by field survey could be confirmed by automated lineament extraction from 30 m SRTM data and 15 m Landsat ETM Interpo- lated groundwater heads of the uppermost Dammam aq- uifer display a different flow pattern between F1 and F2 which correlates with the assumption of an elevated per- meability between these two lineaments due to tectonic stress and the anticline structure. Furthermore the results of the pumping tests support the hypothesis that the area between F1 and F2 is characterized by increased perme- ability. 7. Acknowledgements The authors wish to acknowledge to University of Frei- berg/Hydrogeology institute—Germany for providing the appropriate field instruments. A special thanks goes for Table 1. Pumping test comparison wells. Well no. Coordination Elevation Depth to the GW. Data Bank Depth to the GW. Field Difference % 9 42.28 / 31.95 296.7 61.3 59.1 2.2 2 17 42.32 / 32.09 297.9 49.7 46.3 3.4 3.5 Average 2.8 2.75 Table 2. Recovery test data well 9. MLU aquifer test analysis—for unsteady-state flow. ------------------ Drawdown (m) ---------------- Observation well Aquifer Time (day) Calculated Observed Cal-Obs Observation well 9 1 0.29167 14.581 14.170 0.411 Observation well 9 1 0.29236 4.165 4.530 −0.365 Observation well 9 1 0.29306 2.251 3.150 −0.899 Observation well 9 1 0.29375 1.767 2.350 −0.583 Observation well 9 1 0.29444 1.581 1.700 −0.119 Observation well 9 1 0.29514 1.477 1.550 −0.073 Observation well 9 1 0.29861 1.217 1.190 0.027 Observation well 9 1 0.30208 1.079 1.080 −0.001 Observation well 9 1 0.30556 0.985 1.070 −0.085 Observation well 9 1 0.31250 0.859 0.910 −0.051 Observation well 9 1 0.32292 0.738 0.800 −0.062 Observation well 9 1 0.33958 0.617 0.690 −0.073 Observation well 9 1 0.34375 0.595 0.580 0.015 Sum of squares: 1.4896E+00 m2; K = 0.00208 m/min; T = 0.0832 m2/min. Copyright © 2012 SciRes. IJG  S. W. Al-MUQDADI, B. J. MERKEL 363 Table 3. Recovery test data well 17. MLU aquifer test analysis—for unsteady-state flow. ------------------ Drawdown (m) ---------------- Observation well Aquifer Time (day) Calculated Observed Cal-Obs Observation well 17 1 0.25000 12.497 13.370 −0.873 Observation well 17 1 0.25069 12.498 11.000 1.498 Observation well 17 1 0.25139 12.499 9.920 2.579 Observation well 17 1 0.25208 12.500 8.840 3.660 Observation well 17 1 0.25278 12.501 7.960 4.541 Observation well 17 1 0.25347 12.502 7.070 5.432 Observation well 17 1 0.26042 12.511 5.450 7.061 Observation well 17 1 0.27083 12.524 3.660 8.864 Observation well 17 1 0.28472 12.541 2.680 9.861 Observation well 17 1 0.30556 1.059 1.790 −0.731 Observation well 17 1 0.33681 0.682 0.790 −0.108 Observation well 17 1 0.37847 0.498 0.600 −0.102 Observation well 17 1 0.43056 0.383 0.490 −0.107 Observation well 17 1 0.49306 0.303 0.380 −0.077 Observation well 17 1 0.57639 0.238 0.230 0.008 Observation well 17 1 0.70139 0.181 0.100 0.081 Observation well 17 1 0.86806 0.138 0.040 0.098 Observation well 17 1 1.07639 0.107 0.020 0.087 Sum of squares: 2.9944E+02 m2; K = 0.00262 m/min; T = 0.1048 m2/min. Figure 5. Recovery test well 9. Figure 6. Recovery test well 17. logistic support during the fieldwork to the following colleagues (Khalid Hoshi, Amar Falah, Yasser Kassim and the guide Abo Duraid). REFERENCES [1] A. Braathen, “Kinematics of Post-Caledonian Polyphase Brittle Faulting in the Sunnfjord Region, Western Nor- way,” Tectonophysics, Vol. 302, No. 1-2, 1999, pp. 99- 121. doi:10.1016/S0040-1951(98)00281-9 [2] A. L. Mayo and W. Koontz, “Fracture Flow and Ground- water Compartmentalization in the Rollins Sandstone, Lower Mesaverde Group, Colorado, USA,” Hydrogeol- ogy Journal, Vol. 8, No. 4, 2000, pp. 430-446. doi:10.1007/s100400000056 [3] S. P. Sharma and V. C. Baranwal, “Delineation of Ground- water-Bearing Fracture Zones in a Hard Rock Area Inte- grating Very Low Frequency Electromagnetic and Resis- tivity Data,” Journal of Applied Geophysics, Vol. 57, No. 2, 2005, pp. 155-166. doi:10.1016/j.jappgeo.2004.10.003 [4] J. Qian, H. Zhan, W. Zhao and F. Sun, “Experimental Study of Turbulent Unconfined Groundwater Flow in a Single Fracture,” Journal of Hydrology, Vol. 311, No. 1-4, 2005, pp. 134-142. doi:10.1016/j.jhydrol.2005.01.013 [5] V. Raghavan, S. Masumoto, K. Koike and S. Nagano, “Automatic Lineament Extraction from Digital Images Using a Segment Tracing and Rotation Transformation Approach,” Computers & Geosciences, Vol. 21, No. 4, 1995, pp. 555-591. doi:10.1016/0098-3004(94)00097-E [6] G. B. Kim, J. Y. Lee and K. K. Lee, “Construction of Lineament Maps Related to Groundwater Occurrence with ArcView and Avenue™ Scripts,” Computers and Geosciences, Vol. 30, No. 9-10, 2004, pp. 1117-1126. Copyright © 2012 SciRes. IJG  S. W. Al-MUQDADI, B. J. MERKEL 364 doi:10.1016/j.cageo.2004.09.002 [7] L. Q. Hung, O. Batelaan and F. De Smedt, “Lineament Extraction and Analysis, Comparison of LANDSAT ETM and ASTER Imagery,” Case Study: Suoimuoi Tropical Karst Catchment, 2005, p. 59830T-1. [8] NIC, “Republic of Iraq National Investment Commis- sion,” 2004. [9] V. Unep, “World Atlas of Desertification,” 1992. [10] N. I. Division, “Western Desert of Iraq,” University of Texas Libraries, Austin, 1944. [11] Consortium-Yugoslavia, “Hydrogeological Explorations and Hydrotechnical Work-Western Desert of IRAQ. Blook7,” Directorate of Western Desert Development Projects, Anbar Province, 1977. [12] S. Z. Jassim, J. C. Goff and M. Muzeum v Brn, “The Geology of Iraq,” Geological Society, 2008. [13] T. Buday and J. Hak, “The Geological Survey of the Western Part of the Western Desert. No.1000,” The State Company of Geological Survey and Mining, IRAQ, 1980. [14] T. Buday and S. Z. Jassim, “Tectonic Map of IRAQ,” Geosurv. Iraq., Baghdad, 1984. [15] C. A. Laben and B. V. Brower, “Process for Enhancing the Spatial Resolution of Multispectral Imagery Using Pan-Sharpening,” Google Patents, 2000. [16] C. J. Hemker, “Transient Well Flow in Layered Aquifer Systems: The Uniform Well-Face Drawdown Solution,” Journal of Hydrology, Vol. 225, No. 1-2, 1999, pp. 19-44. doi:10.1016/S0022-1694(99)00093-1 [17] P. C. I. Geomatics, “Geomatica Softwave Manual,” 2001. [18] R. M. Haralick, S. R. Sternberg and X. Zhuang, “Image Analysis Using Mathematical Morphology,” IEEE Trans- actions on Pattern Analysis and Machine Intelligence, Vol. 9, No. 4, 1987, pp. 532-550. doi:10.1109/TPAMI.1987.4767941 [19] W. H. F. Smith and P. Wessel, “Gridding with Continu- ous Curvature Splines in Tension,” Geophysics, Vol. 55, 1990, p. 293. doi:10.1190/1.1442837 [20] N. Cressie, “The Origins of Kriging,” Mathematical Ge- ology, Vol. 22, No. 3, 1990, pp. 239-252. doi:10.1007/BF00889887 [21] R. E. Carlson and T. A. Foley, “Interpolation of Track Data with Radial Basis Methods,” Computers & Mathe- matics with Applications, Vol. 24, No. 12, 1992, pp. 27- 34. doi:10.1016/0898-1221(92)90169-I Copyright © 2012 SciRes. IJG |