

Paper Menu >>
Journal Menu >>
 Vol.2, No.5, 519-525 (2010) Natural Science http://dx.doi.org/10.4236/ns.2010.25065 Copyright © 2010 SciRes. OPEN ACCESS Genomic data provides simple evidence for a single origin of life Kenji Sorimachi Educational Support Center, Dokkyo Medical University, Tochigi, Japan; [email protected] Received 12 January 2010; revised 25 February 2010; accepted 20 March 2010. ABSTRACT One hundred and fifty years ago, Charles Darwin’s on the Origin of Species explained the evolution of species through evolution by natural selection. To date, there is no simple piece of evidence demonstrating this concept across species. Chargaff’s first parity rule states that comple- mentary base pairs are in equal proportion across DNA strands. Chargaff’s second parity rule, in- consistently followed across species, states that the base pairs are in equal proportion within DNA strands [G ≈ C, T ≈ A and (G + A) ≈ (C + T)]. Using genomic libraries, we analyzed the extent to which DNA samples followed Chargaff’s second parity rule. In organelle DNA, nucleotide relationships were heteroskedastic. After classifying organelles into chloroplasts and mitochondria, and then into plant, vertebrate, and invertebrate I and II mito- chondria, nucleotide relationships were ex- pressed by linear regression lines. All regres- sion lines based on nuclear and organelle DNA crossed at the same point. This is a simple dem- onstration of a common ancestor across species. Keywords: Evolution; Origin of Species; Darwin; Genome; Chargaff’s Parity Rules; Organelle; DNA; Linear Formula 1. INTRODUCTION On the Origin of Species was published in 1859, stem- ming from observations Charles Darwin made during a voyage on HMS Beagle. According to his theory, all organisms have a common ancestor and a single origin. Since publication, evidence for this theory has accumu- lated. Although molecular clock research—using amino acid or nucleotide replacement rates [1]—has enabled scientists to draw a phylogenetic tree representing bio- logical evolution [2-7], the “Origin of Life” has not yet been drawn using these methods. During the past two decades, advances in genomics have enabled the se- quencing of entire genomes [8,9]; the first complete ge- nome to be sequenced was that of Haemophilus influen- zae [10]. The complete human genome was sequenced early this century by two groups [11,12] and to date, more than 2,000 species’ genomes have been completely sequenced. Based on complete genome data, codon evo- lution has been precisely analyzed [13], and organisms have been consequently classified [14]. The double-stranded DNA structure is the principle information-containing component of the genome [15]. Based on structural knowledge alone, Chargaff’s first parity rule [16] [G = C, A = T and (G + A) = (T + C)] makes intuitive sense. However, Chargaff’s second par- ity rule [17], in which the same nucleotide relationships are retained within single DNA strands, makes less intui- tive sense. The biological significance of Chargaff’s second parity rule has not been elucidated because of its unclear logical foundation. In the 40 years since its pub- lication, researchers have not known whether Chargaff’s second parity rule is relevant to biological evolution. However, a recent publication has solved this historic puzzle [18]. The solution is based on the facts that ge- nome structure is homogeneous regarding nucleotide composition over the genome [19], and that both for- ward and reverse strands are almost the same [20]. Using the complementary relationship between the two strands, both G and C contents are mathematically expressed by the same G + C formula in a single strand, and eventu- ally G ≈ C and T ≈ A [18]. Thus, the first parity rule comes from the inherent characteristics of nucleotides, and the second from the similarities of nucleotide com- position between forward and reverse strands. These two rules represent different phenomena. The former is mathematically definitive and independent of biological significance, and the latter is less definite, and may or may not have biological significance. Recently, Mitchell and Bridge examined a wide selec- tion of biological DNA samples to determine whether they fitted Chargaff’s second parity rule [21] (1,495 viral, 835 organelle, 231 bacterial and 20 archaeal genomes; and 164 sequences from 15 eukaryotes). Only single 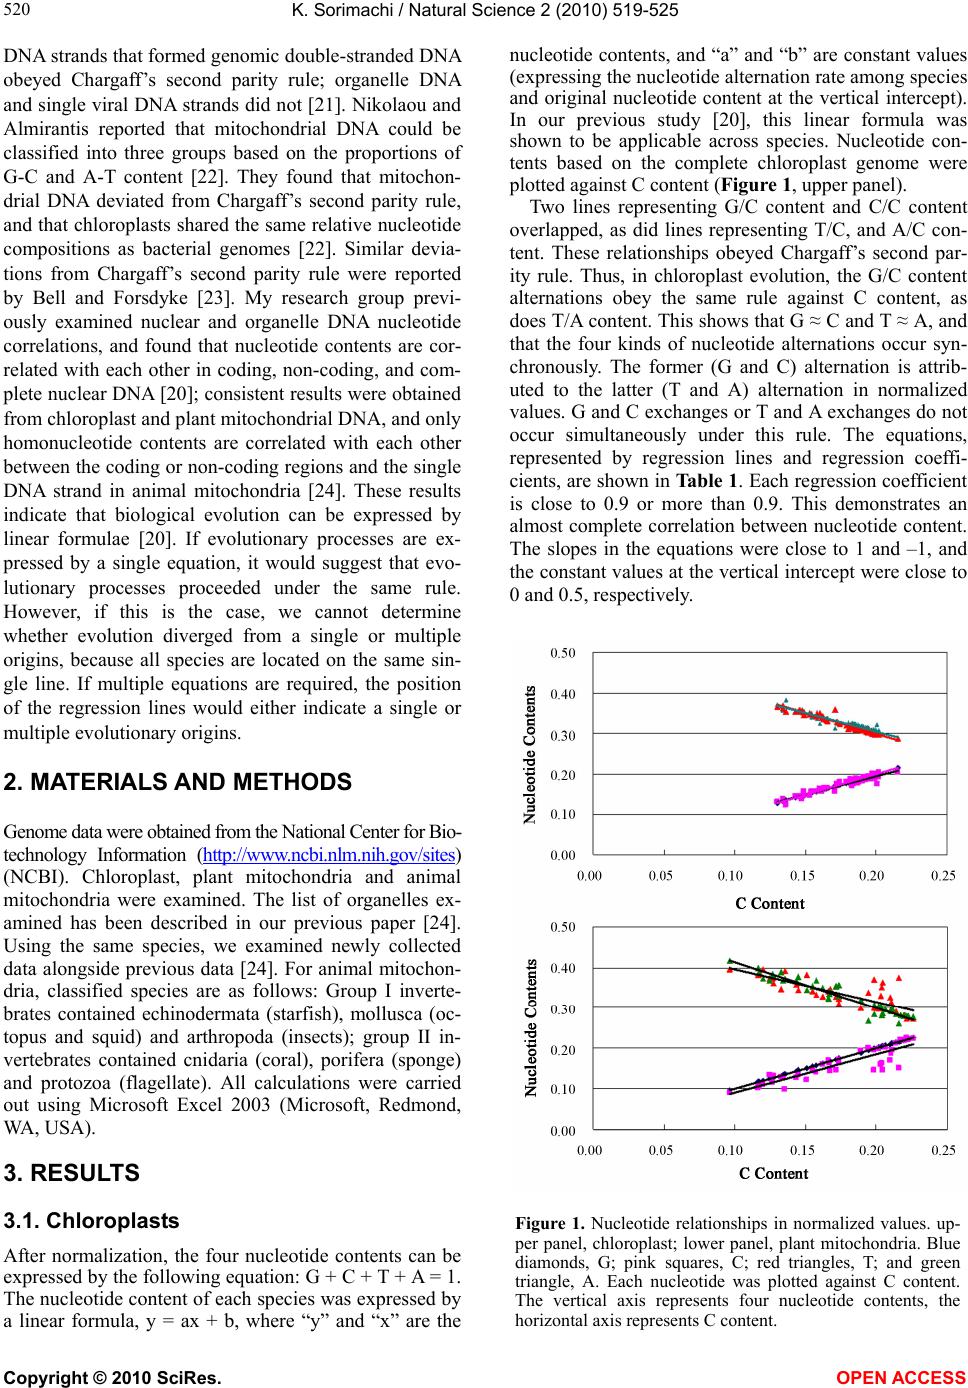 K. Sorimachi / Natural Science 2 (2010) 519-525 Copyright © 2010 SciRes. OPEN ACCESS 520 DNA strands that formed genomic double-stranded DNA obeyed Chargaff’s second parity rule; organelle DNA and single viral DNA strands did not [21]. Nikolaou and Almirantis reported that mitochondrial DNA could be classified into three groups based on the proportions of G-C and A-T content [22]. They found that mitochon- drial DNA deviated from Chargaff’s second parity rule, and that chloroplasts shared the same relative nucleotide compositions as bacterial genomes [22]. Similar devia- tions from Chargaff’s second parity rule were reported by Bell and Forsdyke [23]. My research group previ- ously examined nuclear and organelle DNA nucleotide correlations, and found that nucleotide contents are cor- related with each other in coding, non-coding, and com- plete nuclear DNA [20]; consistent results were obtained from chloroplast and plant mitochondrial DNA, and only homonucleotide contents are correlated with each other between the coding or non-coding regions and the single DNA strand in animal mitochondria [24]. These results indicate that biological evolution can be expressed by linear formulae [20]. If evolutionary processes are ex- pressed by a single equation, it would suggest that evo- lutionary processes proceeded under the same rule. However, if this is the case, we cannot determine whether evolution diverged from a single or multiple origins, because all species are located on the same sin- gle line. If multiple equations are required, the position of the regression lines would either indicate a single or multiple evolutionary origins. 2. MATERIALS AND METHODS Genome data were obtained from the National Center for Bio- technology Information (http://www.ncbi.nlm.nih.gov/sites) (NCBI). Chloroplast, plant mitochondria and animal mitochondria were examined. The list of organelles ex- amined has been described in our previous paper [24]. Using the same species, we examined newly collected data alongside previous data [24]. For animal mitochon- dria, classified species are as follows: Group I inverte- brates contained echinodermata (starfish), mollusca (oc- topus and squid) and arthropoda (insects); group II in- vertebrates contained cnidaria (coral), porifera (sponge) and protozoa (flagellate). All calculations were carried out using Microsoft Excel 2003 (Microsoft, Redmond, WA, USA). 3. RESULTS 3.1. Chloroplasts After normalization, the four nucleotide contents can be expressed by the following equation: G + C + T + A = 1. The nucleotide content of each species was expressed by a linear formula, y = ax + b, where “y” and “x” are the nucleotide contents, and “a” and “b” are constant values (expressing the nucleotide alternation rate among species and original nucleotide content at the vertical intercept). In our previous study [20], this linear formula was shown to be applicable across species. Nucleotide con- tents based on the complete chloroplast genome were plotted against C content (Figure 1, upper panel). Two lines representing G/C content and C/C content overlapped, as did lines representing T/C, and A/C con- tent. These relationships obeyed Chargaff’s second par- ity rule. Thus, in chloroplast evolution, the G/C content alternations obey the same rule against C content, as does T/A content. This shows that G ≈ C and T ≈ A, and that the four kinds of nucleotide alternations occur syn- chronously. The former (G and C) alternation is attrib- uted to the latter (T and A) alternation in normalized values. G and C exchanges or T and A exchanges do not occur simultaneously under this rule. The equations, represented by regression lines and regression coeffi- cients, are shown in Table 1. Each regression coefficient is close to 0.9 or more than 0.9. This demonstrates an almost complete correlation between nucleotide content. The slopes in the equations were close to 1 and –1, and the constant values at the vertical intercept were close to 0 and 0.5, respectively. Figure 1. Nucleotide relationships in normalized values. up- per panel, chloroplast; lower panel, plant mitochondria. Blue diamonds, G; pink squares, C; red triangles, T; and green triangle, A. Each nucleotide was plotted against C content. The vertical axis represents four nucleotide contents, the horizontal axis represents C content. 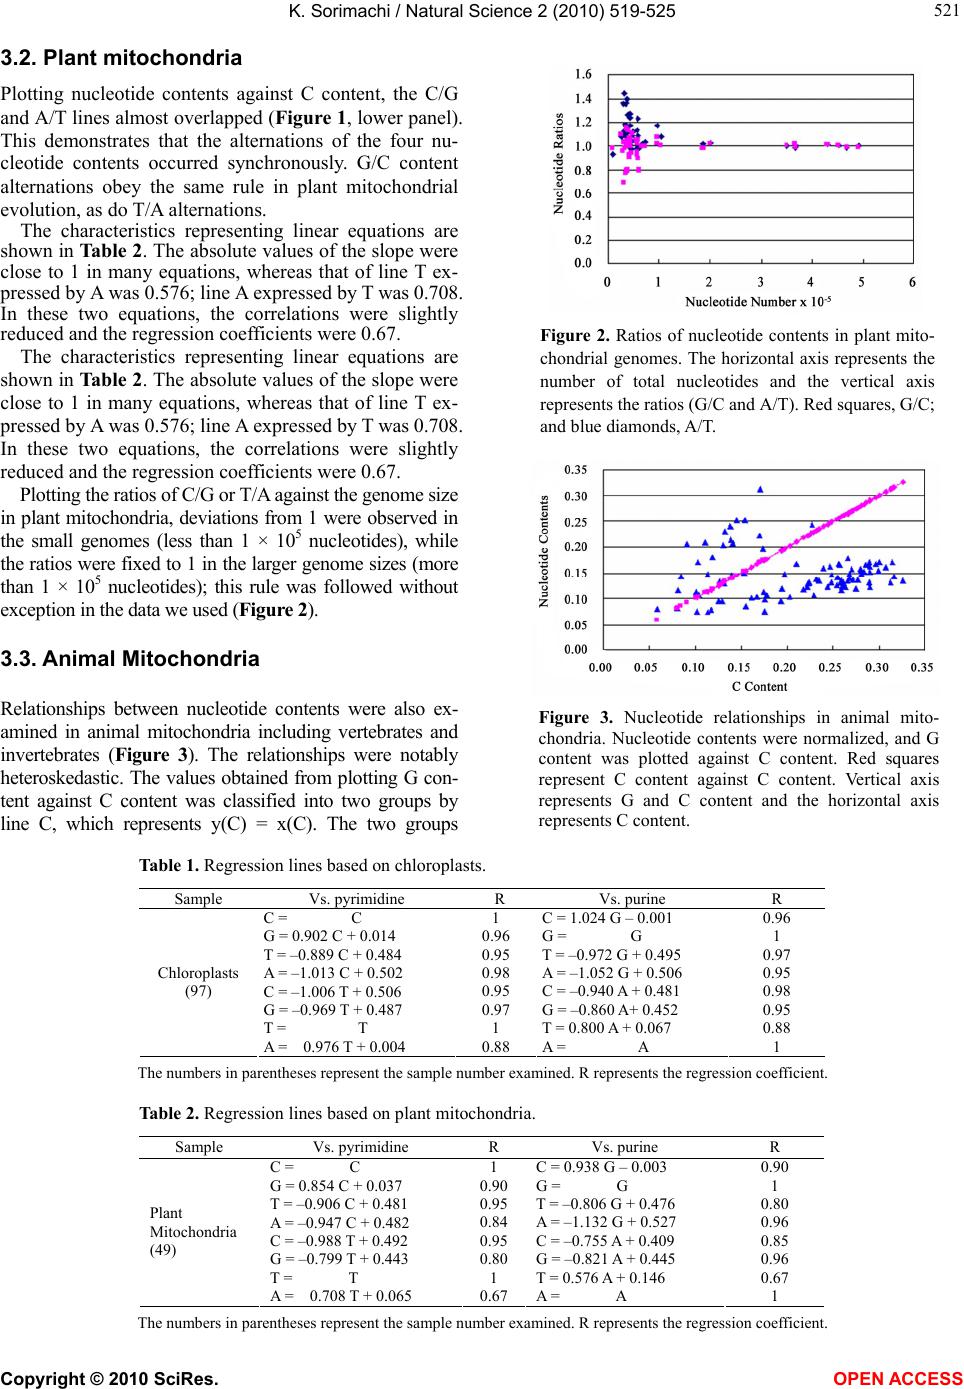 K. Sorimachi / Natural Science 2 (2010) 519-525 Copyright © 2010 SciRes. OPEN ACCESS 521 521 3.2. Plant mitochondria Plotting nucleotide contents against C content, the C/G and A/T lines almost overlapped (Figure 1, lower panel). This demonstrates that the alternations of the four nu- cleotide contents occurred synchronously. G/C content alternations obey the same rule in plant mitochondrial evolution, as do T/A alternations. The characteristics representing linear equations are shown in Table 2. The absolute values of the slope were close to 1 in many equations, whereas that of line T ex- pressed by A was 0.576; line A expressed by T was 0.708. In these two equations, the correlations were slightly reduced and the regression coefficients were 0.67. The characteristics representing linear equations are shown in Table 2. The absolute values of the slope were close to 1 in many equations, whereas that of line T ex- pressed by A was 0.576; line A expressed by T was 0.708. In these two equations, the correlations were slightly reduced and the regression coefficients were 0.67. Plotting the ratios of C/G or T/A against the genome size in plant mitochondria, deviations from 1 were observed in the small genomes (less than 1 × 10⁵ nucleotides), while the ratios were fixed to 1 in the larger genome sizes (more than 1 × 10⁵ nucleotides); this rule was followed without exception in the data we used (Figure 2). 3.3. Animal Mitochondria Relationships between nucleotide contents were also ex- amined in animal mitochondria including vertebrates and invertebrates (Figure 3). The relationships were notably heteroskedastic. The values obtained from plotting G con- tent against C content was classified into two groups by line C, which represents y(C) = x(C). The two groups Figure 2. Ratios of nucleotide contents in plant mito- chondrial genomes. The horizontal axis represents the number of total nucleotides and the vertical axis represents the ratios (G/C and A/T). Red squares, G/C; and blue diamonds, A/T. Figure 3. Nucleotide relationships in animal mito- chondria. Nucleotide contents were normalized, and G content was plotted against C content. Red squares represent C content against C content. Vertical axis represents G and C content and the horizontal axis represents C content. Table 1. Regression lines based on chloroplasts. Sample Vs. pyrimidine R Vs. purine R C = C G = 0.902 C + 0.014 T = –0.889 C + 0.484 A = –1.013 C + 0.502 1 0.96 0.95 0.98 C = 1.024 G – 0.001 G = G T = –0.972 G + 0.495 A = –1.052 G + 0.506 0.96 1 0.97 0.95 Chloroplasts (97) C = –1.006 T + 0.506 G = –0.969 T + 0.487 T = T A = 0.976 T + 0.004 0.95 0.97 1 0.88 C = –0.940 A + 0.481 G = –0.860 A+ 0.452 T = 0.800 A + 0.067 A = A 0.98 0.95 0.88 1 The numbers in parentheses represent the sample number examined. R represents the regression coefficient. Table 2. Regression lines based on plant mitochondria. Sample Vs. pyrimidine R Vs. purine R C = C G = 0.854 C + 0.037 T = –0.906 C + 0.481 A = –0.947 C + 0.482 1 0.90 0.95 0.84 C = 0.938 G – 0.003 G = G T = –0.806 G + 0.476 A = –1.132 G + 0.527 0.90 1 0.80 0.96 Plant Mitochondria (49) C = –0.988 T + 0.492 G = –0.799 T + 0.443 T = T A = 0.708 T + 0.065 0.95 0.80 1 0.67 C = –0.755 A + 0.409 G = –0.821 A + 0.445 T = 0.576 A + 0.146 A = A 0.85 0.96 0.67 1 The numbers in parentheses represent the sample number examined. R represents the regression coefficient. 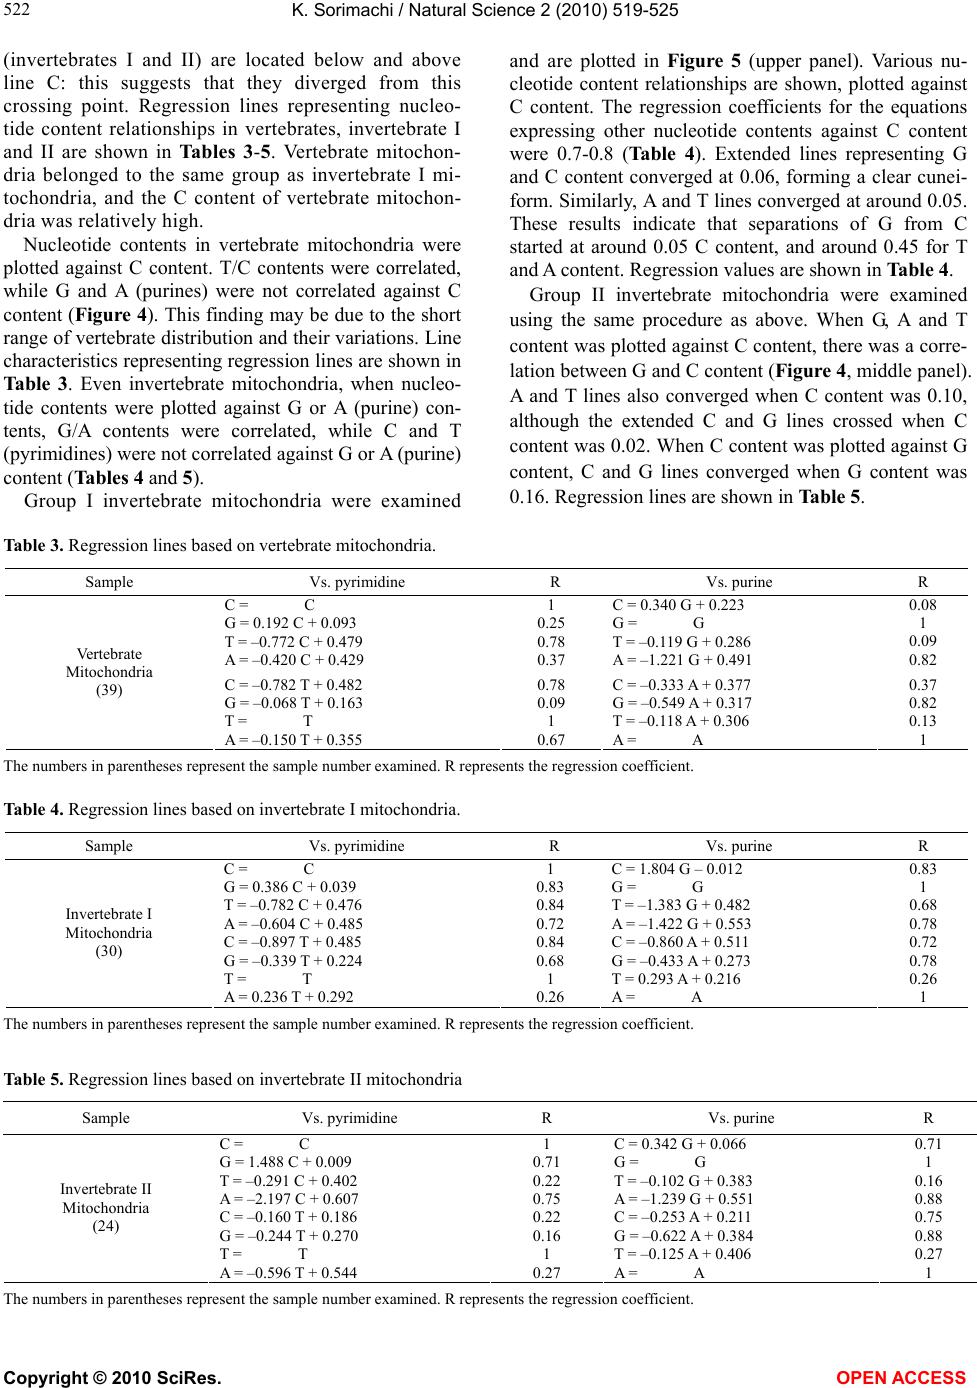 K. Sorimachi / Natural Science 2 (2010) 519-525 Copyright © 2010 SciRes. OPEN ACCESS 522 (invertebrates I and II) are located below and above line C: this suggests that they diverged from this crossing point. Regression lines representing nucleo- tide content relationships in vertebrates, invertebrate I and II are shown in Tables 3-5. Vertebrate mitochon- dria belonged to the same group as invertebrate I mi- tochondria, and the C content of vertebrate mitochon- dria was relatively high. Nucleotide contents in vertebrate mitochondria were plotted against C content. T/C contents were correlated, while G and A (purines) were not correlated against C content (Figure 4). This finding may be due to the short range of vertebrate distribution and their variations. Line characteristics representing regression lines are shown in Table 3. Even invertebrate mitochondria, when nucleo- tide contents were plotted against G or A (purine) con- tents, G/A contents were correlated, while C and T (pyrimidines) were not correlated against G or A (purine) content (Tables 4 and 5). Group I invertebrate mitochondria were examined and are plotted in Figure 5 (upper panel). Various nu- cleotide content relationships are shown, plotted against C content. The regression coefficients for the equations expressing other nucleotide contents against C content were 0.7-0.8 (Table 4). Extended lines representing G and C content converged at 0.06, forming a clear cunei- form. Similarly, A and T lines converged at around 0.05. These results indicate that separations of G from C started at around 0.05 C content, and around 0.45 for T and A content. Regression values are shown in Table 4. Group II invertebrate mitochondria were examined using the same procedure as above. When G, A and T content was plotted against C content, there was a corre- lation between G and C content (Figure 4, middle panel). A and T lines also converged when C content was 0.10, although the extended C and G lines crossed when C content was 0.02. When C content was plotted against G content, C and G lines converged when G content was 0.16. Regression lines are shown in Table 5. Table 3. Regression lines based on vertebrate mitochondria. Sample Vs. pyrimidine R Vs. purine R C = C G = 0.192 C + 0.093 T = –0.772 C + 0.479 A = –0.420 C + 0.429 1 0.25 0.78 0.37 C = 0.340 G + 0.223 G = G T = –0.119 G + 0.286 A = –1.221 G + 0.491 0.08 1 0.09 0.82 Ve rtebrate Mitochondria (39) C = –0.782 T + 0.482 G = –0.068 T + 0.163 T = T A = –0.150 T + 0.355 0.78 0.09 1 0.67 C = –0.333 A + 0.377 G = –0.549 A + 0.317 T = –0.118 A + 0.306 A = A 0.37 0.82 0.13 1 The numbers in parentheses represent the sample number examined. R represents the regression coefficient. Table 4. Regression lines based on invertebrate I mitochondria. Sample Vs. pyrimidine R Vs. purine R C = C G = 0.386 C + 0.039 T = –0.782 C + 0.476 A = –0.604 C + 0.485 1 0.83 0.84 0.72 C = 1.804 G – 0.012 G = G T = –1.383 G + 0.482 A = –1.422 G + 0.553 0.83 1 0.68 0.78 Invertebrate I Mitochondria (30) C = –0.897 T + 0.485 G = –0.339 T + 0.224 T = T A = 0.236 T + 0.292 0.84 0.68 1 0.26 C = –0.860 A + 0.511 G = –0.433 A + 0.273 T = 0.293 A + 0.216 A = A 0.72 0.78 0.26 1 The numbers in parentheses represent the sample number examined. R represents the regression coefficient. Table 5. Regression lines based on invertebrate II mitochondria Sample Vs. pyrimidine R Vs. purine R C = C G = 1.488 C + 0.009 T = –0.291 C + 0.402 A = –2.197 C + 0.607 1 0.71 0.22 0.75 C = 0.342 G + 0.066 G = G T = –0.102 G + 0.383 A = –1.239 G + 0.551 0.71 1 0.16 0.88 Invertebrate II Mitochondria (24) C = –0.160 T + 0.186 G = –0.244 T + 0.270 T = T A = –0.596 T + 0.544 0.22 0.16 1 0.27 C = –0.253 A + 0.211 G = –0.622 A + 0.384 T = –0.125 A + 0.406 A = A 0.75 0.88 0.27 1 The numbers in parentheses represent the sample number examined. R represents the regression coefficient. 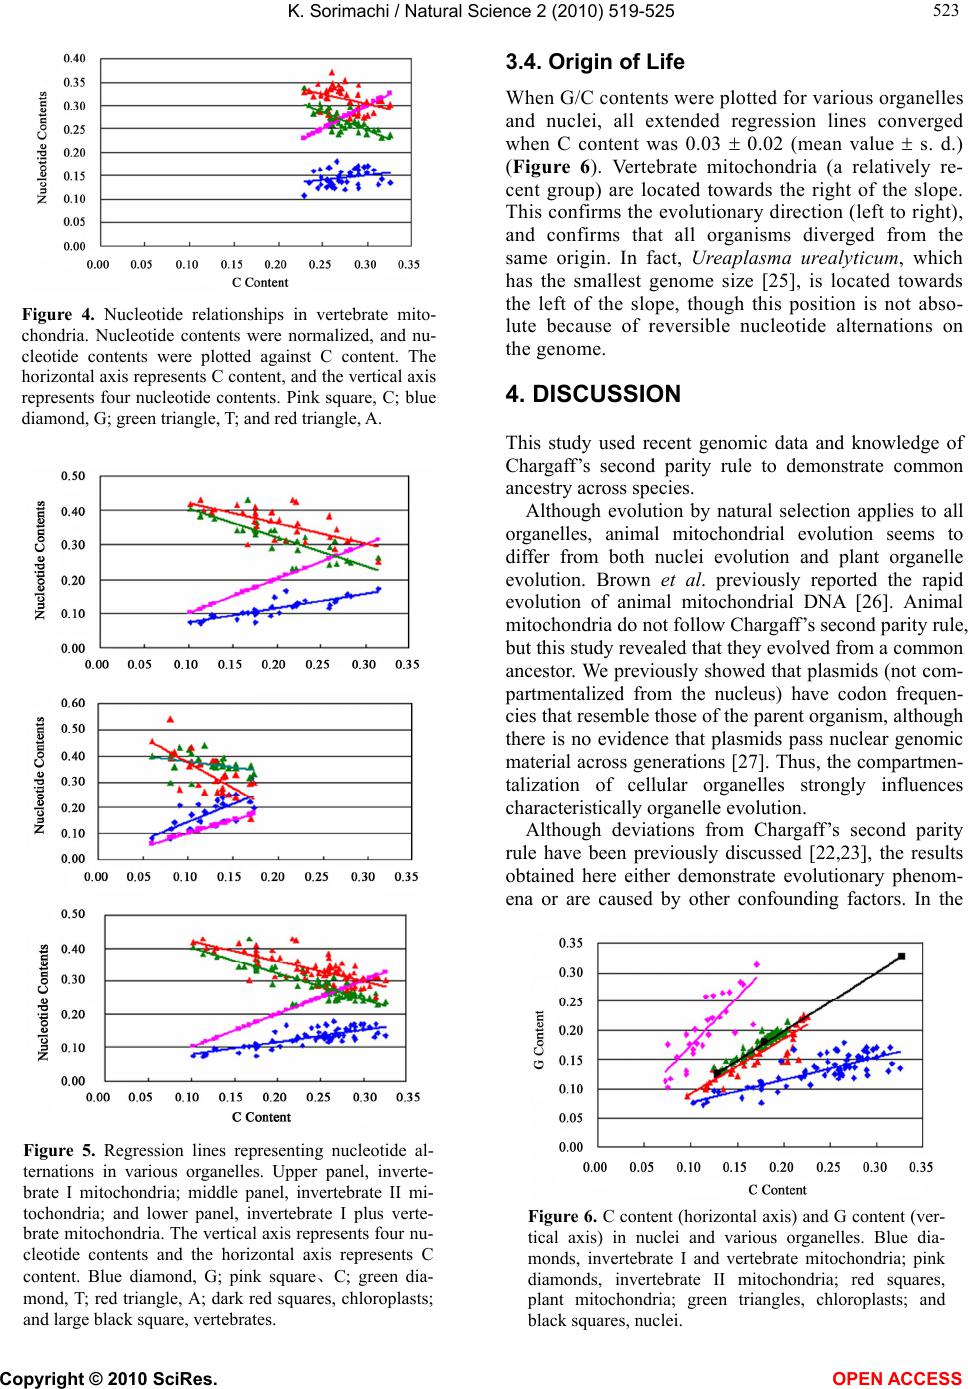 K. Sorimachi / Natural Science 2 (2010) 519-525 Copyright © 2010 SciRes. OPEN ACCESS 523 523 Figure 4. Nucleotide relationships in vertebrate mito- chondria. Nucleotide contents were normalized, and nu- cleotide contents were plotted against C content. The horizontal axis represents C content, and the vertical axis represents four nucleotide contents. Pink square, C; blue diamond, G; green triangle, T; and red triangle, A. Figure 5. Regression lines representing nucleotide al- ternations in various organelles. Upper panel, inverte- brate I mitochondria; middle panel, invertebrate II mi- tochondria; and lower panel, invertebrate I plus verte- brate mitochondria. The vertical axis represents four nu- cleotide contents and the horizontal axis represents C content. Blue diamond, G; pink square、C; green dia- mond, T; red triangle, A; dark red squares, chloroplasts; and large black square, vertebrates. 3.4. Origin of Life When G/C contents were plotted for various organelles and nuclei, all extended regression lines converged when C content was 0.03 0.02 (mean value s. d.) (Figure 6). Vertebrate mitochondria (a relatively re- cent group) are located towards the right of the slope. This confirms the evolutionary direction (left to right), and confirms that all organisms diverged from the same origin. In fact, Ureaplasma urealyticum, which has the smallest genome size [25], is located towards the left of the slope, though this position is not abso- lute because of reversible nucleotide alternations on the genome. 4. DISCUSSION This study used recent genomic data and knowledge of Chargaff’s second parity rule to demonstrate common ancestry across species. Although evolution by natural selection applies to all organelles, animal mitochondrial evolution seems to differ from both nuclei evolution and plant organelle evolution. Brown et al. previously reported the rapid evolution of animal mitochondrial DNA [26]. Animal mitochondria do not follow Chargaff’s second parity rule, but this study revealed that they evolved from a common ancestor. We previously showed that plasmids (not com- partmentalized from the nucleus) have codon frequen- cies that resemble those of the parent organism, although there is no evidence that plasmids pass nuclear genomic material across generations [27]. Thus, the compartmen- talization of cellular organelles strongly influences characteristically organelle evolution. Although deviations from Chargaff’s second parity rule have been previously discussed [22,23], the results obtained here either demonstrate evolutionary phenom- ena or are caused by other confounding factors. In the Figure 6. C content (horizontal axis) and G content (ver- tical axis) in nuclei and various organelles. Blue dia- monds, invertebrate I and vertebrate mitochondria; pink diamonds, invertebrate II mitochondria; red squares, plant mitochondria; green triangles, chloroplasts; and black squares, nuclei. 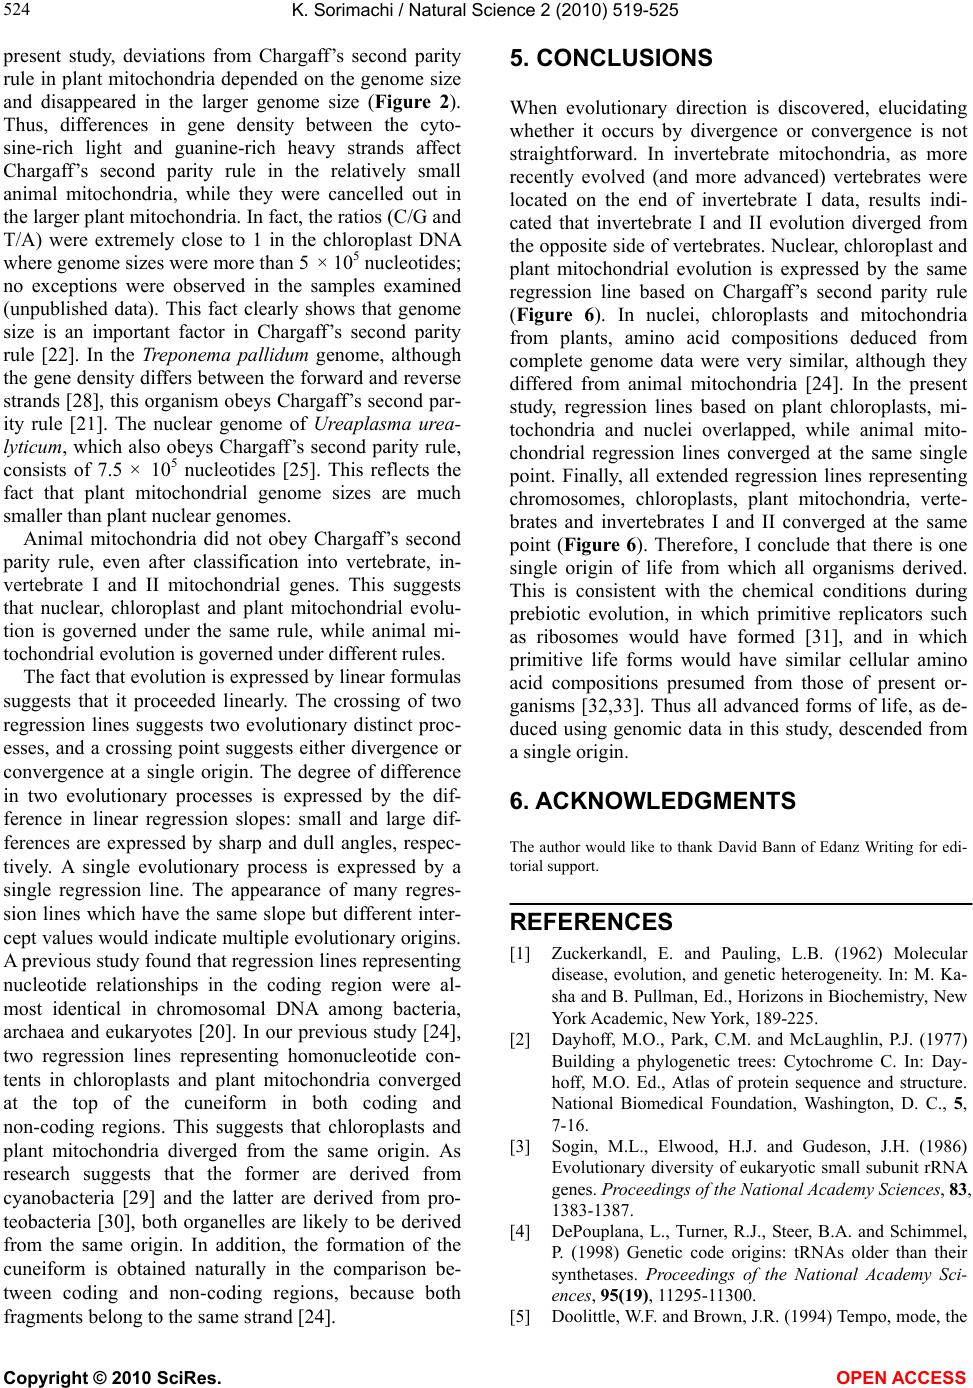 K. Sorimachi / Natural Science 2 (2010) 519-525 Copyright © 2010 SciRes. OPEN ACCESS 524 present study, deviations from Chargaff’s second parity rule in plant mitochondria depended on the genome size and disappeared in the larger genome size (Figure 2). Thus, differences in gene density between the cyto- sine-rich light and guanine-rich heavy strands affect Chargaff’s second parity rule in the relatively small animal mitochondria, while they were cancelled out in the larger plant mitochondria. In fact, the ratios (C/G and T/A) were extremely close to 1 in the chloroplast DNA where genome sizes were more than 5 × 10⁵ nucleotides; no exceptions were observed in the samples examined (unpublished data). This fact clearly shows that genome size is an important factor in Chargaff’s second parity rule [22]. In the Treponema pallidum genome, although the gene density differs between the forward and reverse strands [28], this organism obeys Chargaff’s second par- ity rule [21]. The nuclear genome of Ureaplasma urea- lyticum, which also obeys Chargaff’s second parity rule, consists of 7.5 × 10⁵ nucleotides [25]. This reflects the fact that plant mitochondrial genome sizes are much smaller than plant nuclear genomes. Animal mitochondria did not obey Chargaff’s second parity rule, even after classification into vertebrate, in- vertebrate I and II mitochondrial genes. This suggests that nuclear, chloroplast and plant mitochondrial evolu- tion is governed under the same rule, while animal mi- tochondrial evolution is governed under different rules. The fact that evolution is expressed by linear formulas suggests that it proceeded linearly. The crossing of two regression lines suggests two evolutionary distinct proc- esses, and a crossing point suggests either divergence or convergence at a single origin. The degree of difference in two evolutionary processes is expressed by the dif- ference in linear regression slopes: small and large dif- ferences are expressed by sharp and dull angles, respec- tively. A single evolutionary process is expressed by a single regression line. The appearance of many regres- sion lines which have the same slope but different inter- cept values would indicate multiple evolutionary origins. A previous study found that regression lines representing nucleotide relationships in the coding region were al- most identical in chromosomal DNA among bacteria, archaea and eukaryotes [20]. In our previous study [24], two regression lines representing homonucleotide con- tents in chloroplasts and plant mitochondria converged at the top of the cuneiform in both coding and non-coding regions. This suggests that chloroplasts and plant mitochondria diverged from the same origin. As research suggests that the former are derived from cyanobacteria [29] and the latter are derived from pro- teobacteria [30], both organelles are likely to be derived from the same origin. In addition, the formation of the cuneiform is obtained naturally in the comparison be- tween coding and non-coding regions, because both fragments belong to the same strand [24]. 5. CONCLUSIONS When evolutionary direction is discovered, elucidating whether it occurs by divergence or convergence is not straightforward. In invertebrate mitochondria, as more recently evolved (and more advanced) vertebrates were located on the end of invertebrate I data, results indi- cated that invertebrate I and II evolution diverged from the opposite side of vertebrates. Nuclear, chloroplast and plant mitochondrial evolution is expressed by the same regression line based on Chargaff’s second parity rule (Figure 6). In nuclei, chloroplasts and mitochondria from plants, amino acid compositions deduced from complete genome data were very similar, although they differed from animal mitochondria [24]. In the present study, regression lines based on plant chloroplasts, mi- tochondria and nuclei overlapped, while animal mito- chondrial regression lines converged at the same single point. Finally, all extended regression lines representing chromosomes, chloroplasts, plant mitochondria, verte- brates and invertebrates I and II converged at the same point (Figure 6). Therefore, I conclude that there is one single origin of life from which all organisms derived. This is consistent with the chemical conditions during prebiotic evolution, in which primitive replicators such as ribosomes would have formed [31], and in which primitive life forms would have similar cellular amino acid compositions presumed from those of present or- ganisms [32,33]. Thus all advanced forms of life, as de- duced using genomic data in this study, descended from a single origin. 6. ACKNOWLEDGMENTS The author would like to thank David Bann of Edanz Writing for edi- torial support. REFERENCES [1] Zuckerkandl, E. and Pauling, L.B. (1962) Molecular disease, evolution, and genetic heterogeneity. In: M. Ka- sha and B. Pullman, Ed., Horizons in Biochemistry, New York Academic, New York, 189-225. [2] Dayhoff, M.O., Park, C.M. and McLaughlin, P.J. (1977) Building a phylogenetic trees: Cytochrome C. In: Day- hoff, M.O. Ed., Atlas of protein sequence and structure. National Biomedical Foundation, Washington, D. C., 5, 7-16. [3] Sogin, M.L., Elwood, H.J. and Gudeson, J.H. (1986) Evolutionary diversity of eukaryotic small subunit rRNA genes. Proceedings of the National Academy Sciences, 83, 1383-1387. [4] DePouplana, L., Turner, R.J., Steer, B.A. and Schimmel, P. (1998) Genetic code origins: tRNAs older than their synthetases. Proceedings of the National Academy Sci- ences, 95(19), 11295-11300. [5] Doolittle, W.F. and Brown, J.R. (1994) Tempo, mode, the 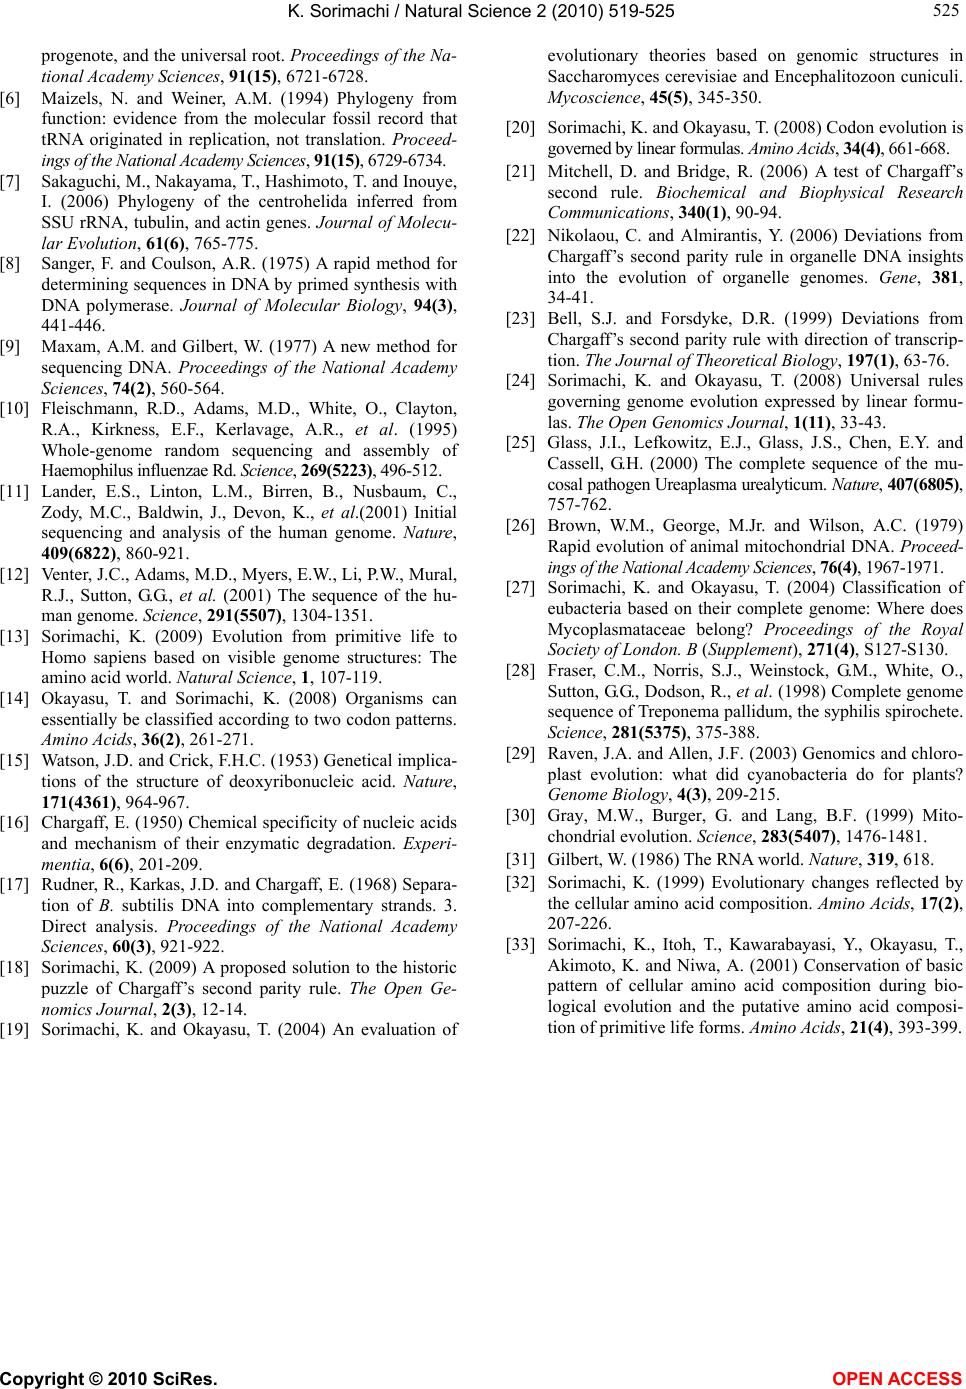 K. Sorimachi / Natural Science 2 (2010) 519-525 Copyright © 2010 SciRes. OPEN ACCESS 525 525 progenote, and the universal root. Proceedings of the Na- tional Academy Sciences, 91(15), 6721-6728. [6] Maizels, N. and Weiner, A.M. (1994) Phylogeny from function: evidence from the molecular fossil record that tRNA originated in replication, not translation. Proceed- ings of the National Academy Sciences, 91(15), 6729-6734. [7] Sakaguchi, M., Nakayama, T., Hashimoto, T. and Inouye, I. (2006) Phylogeny of the centrohelida inferred from SSU rRNA, tubulin, and actin genes. Journal of Molecu- lar Evolution, 61(6), 765-775. [8] Sanger, F. and Coulson, A.R. (1975) A rapid method for determining sequences in DNA by primed synthesis with DNA polymerase. Journal of Molecular Biology, 94(3), 441-446. [9] Maxam, A.M. and Gilbert, W. (1977) A new method for sequencing DNA. Proceedings of the National Academy Sciences, 74(2), 560-564. [10] Fleischmann, R.D., Adams, M.D., White, O., Clayton, R.A., Kirkness, E.F., Kerlavage, A.R., et al. (1995) Whole-genome random sequencing and assembly of Haemophilus influenzae Rd. Science, 269(5223), 496-512. [11] Lander, E.S., Linton, L.M., Birren, B., Nusbaum, C., Zody, M.C., Baldwin, J., Devon, K., et al.(2001) Initial sequencing and analysis of the human genome. Nature, 409(6822), 860-921. [12] Venter, J.C., Adams, M.D., Myers, E.W., Li, P.W., Mural, R.J., Sutton, G.G., et al. (2001) The sequence of the hu- man genome. Science, 291(5507), 1304-1351. [13] Sorimachi, K. (2009) Evolution from primitive life to Homo sapiens based on visible genome structures: The amino acid world. Natural Science, 1, 107-119. [14] Okayasu, T. and Sorimachi, K. (2008) Organisms can essentially be classified according to two codon patterns. Amino Acids, 36(2), 261-271. [15] Watson, J.D. and Crick, F.H.C. (1953) Genetical implica- tions of the structure of deoxyribonucleic acid. Nature, 171(4361), 964-967. [16] Chargaff, E. (1950) Chemical specificity of nucleic acids and mechanism of their enzymatic degradation. Experi- mentia, 6(6), 201-209. [17] Rudner, R., Karkas, J.D. and Chargaff, E. (1968) Separa- tion of B. subtilis DNA into complementary strands. 3. Direct analysis. Proceedings of the National Academy Sciences, 60(3), 921-922. [18] Sorimachi, K. (2009) A proposed solution to the historic puzzle of Chargaff’s second parity rule. The Open Ge- nomics Journal, 2(3), 12-14. [19] Sorimachi, K. and Okayasu, T. (2004) An evaluation of evolutionary theories based on genomic structures in Saccharomyces cerevisiae and Encephalitozoon cuniculi. Mycoscience, 45(5), 345-350. [20] Sorimachi, K. and Okayasu, T. (2008) Codon evolution is governed by linear formulas. Amino Acids, 34(4), 661-668. [21] Mitchell, D. and Bridge, R. (2006) A test of Chargaff’s second rule. Biochemical and Biophysical Research Communications, 340(1), 90-94. [22] Nikolaou, C. and Almirantis, Y. (2006) Deviations from Chargaff’s second parity rule in organelle DNA insights into the evolution of organelle genomes. Gene, 381, 34-41. [23] Bell, S.J. and Forsdyke, D.R. (1999) Deviations from Chargaff’s second parity rule with direction of transcrip- tion. The Journal of Theoretical Biology, 197(1), 63-76. [24] Sorimachi, K. and Okayasu, T. (2008) Universal rules governing genome evolution expressed by linear formu- las. The Open Genomics Journal, 1(11), 33-43. [25] Glass, J.I., Lefkowitz, E.J., Glass, J.S., Chen, E.Y. and Cassell, G .H. (2000) The complete sequence of the mu- cosal pathogen Ureaplasma urealyticum. Nature, 407(6805), 757-762. [26] Brown, W.M., George, M.Jr. and Wilson, A.C. (1979) Rapid evolution of animal mitochondrial DNA. Proceed- ings of the National Academy Sciences, 76(4), 1967-1971. [27] Sorimachi, K. and Okayasu, T. (2004) Classification of eubacteria based on their complete genome: Where does Mycoplasmataceae belong? Proceedings of the Royal Society of London. B (Supplement), 271(4), S127-S130. [28] Fraser, C.M., Norris, S.J., Weinstock, G.M., White, O., Sutton, G.G., Dodson, R., et al. (1998) Complete genome sequence of Treponema pallidum, the syphilis spirochete. Science, 281(5375), 375-388. [29] Raven, J.A. and Allen, J.F. (2003) Genomics and chloro- plast evolution: what did cyanobacteria do for plants? Genome Biology, 4(3), 209-215. [30] Gray, M.W., Burger, G. and Lang, B.F. (1999) Mito- chondrial evolution. Science, 283(5407), 1476-1481. [31] Gilbert, W. (1986) The RNA world. Nature, 319, 618. [32] Sorimachi, K. (1999) Evolutionary changes reflected by the cellular amino acid composition. Amino Acids, 17(2), 207-226. [33] Sorimachi, K., Itoh, T., Kawarabayasi, Y., Okayasu, T., Akimoto, K. and Niwa, A. (2001) Conservation of basic pattern of cellular amino acid composition during bio- logical evolution and the putative amino acid composi- tion of primitive life forms. Amino Acids, 21(4), 393-399. |