Paper Menu >>
Journal Menu >>
 Vol.2, No.5, 506-514(2010) Natural Science http://dx.doi.org/10.4236/ns.2010.25063 Copyright © 2010 SciRes. OPEN ACCESS Investigation of airborne fungi at different altitudes in Shenzhen University Li Li, Chao Lei, Zhi-Gang Liu* College of Life Science, Shenzhen University, Shenzhen, China; *Corresponding Author: [email protected] Received 15 December 2009; revised 24 February 2010; accepted 18 March 2010. ABSTRACT Aim: To investigate the richness of species or genera of airborne fungi, the amount of airborne fungi, and its seasonal variation at different al- titudes in Shenzhen University. The effect of meteorological factors on airborne fungi was also analyzed. Methods: Slide-exposure me- thod and open-plate method were used. Re- sults: There were 27 genera or species of fun- gus spores identified. Among the identified fungal genus, Cladosporium, Ustilago, Alter- naria, Helminthsporium and Uredinales were more prevalent. There were 18 genera of fungi colonies identified. Among which Penicillium, non-sporulating fungi, Aspergillus, Saccharo- myces and Cladosporium were more common. The airborne fungal spores were present in the atmosphere of Shenzhen University all year round. The peaks of airborne spores appeared during April and October, while the lowest numbers were observed during January, July and December from March 2005-Febrary 2006. The highest volumes of fungi colonies were observed during April, October and September, while the lowest numbers were detected during in January, July and December or May from March 2005-Febrary 2006. The meteorological factors had no relationship between the total monthly spore count at 10 and 30 meter height. At 70 meter, the total spores count was nega- tively correlated with solar radiation. Conclu- sions: Most of the fungi spores decreased along with the increase of altitudes. Keywords: Airborne Fungi; Open-Plate Method; Slide-Exposure Method 1. INTRODUCTION Airborne fungi are one of the common allergens that induce respiratory hypersensitivity reaction [1-3]. The major allergic symptoms include asthma, rhinitis, bron- chopulmonary mycoses and hypersensitive pneumonitis [4]. Airborne fungi also act as an indicator for the at- mospheric bio-pollution. The presence of fungal pro- pagules, volatiles and mycotoxins in the air can pose a health hazard in all segments of the population [5]. Fungi variety and concentration depends on various fac- tors, including topography, time of day, meteorological parameters, seasonal climatic variation and type of vegetation [6-7]. Extensive investigations of airborne fungi had been done in many parts of the world [8-15]. In China, such studies had been done in different prov- inces [16-25]. But to our knowledge there are no published data on the airborne fungi at different altitudes in one place. Shenzhen city is located at 22°27'-22°52' N and 113°46'- 114°37' E. The weather in Shenzhen is associated with high temperature and humidity throughout the year, which suits for the reproduction of airborne fungi. As a well developed city, Shenzen has a large number of tall buildings and mansions providing both working and living spaces. The aim of this work was to determine the concentration of airborne fungi present at different alti- tudes and the effect of seasonal variations, which will provide useful information on the air quality of residen- tial areas. 2. METHODS 2.1. Slide-Exposure Method The slide-exposure method based on the protocol adap- ted from Ye (1992) was used to determine the fungal spores [26]. Briefly, the slides with vaseline for spore sampling were set on the second floor (10 meter above ground level), the seventh floor (30 meter above ground level) and the sixtieth floor (70 meter above ground level) of the technological building in Shenzhen University (22°54′37'' N and 113°93′77'' E), respectively. Two slides were collected daily from March, 2005 to Febru- ary, 2006. The slides were stained by basic fuchsin solu- 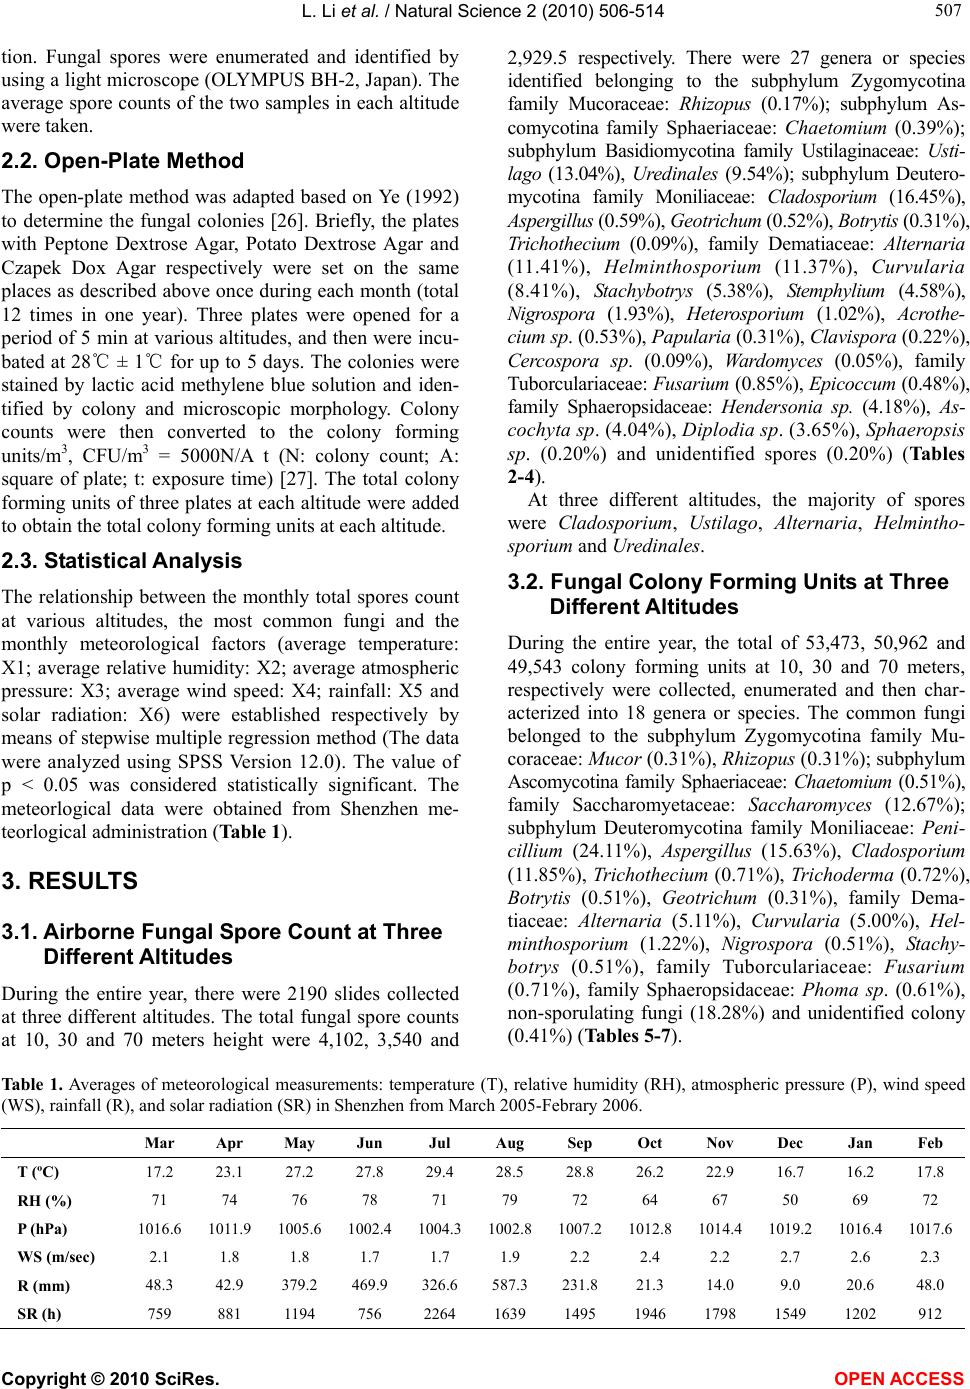 L. Li et al. / Natural Science 2 (2010) 506-514 Copyright © 2010 SciRes. OPEN ACCESS 507 507 tion. Fungal spores were enumerated and identified by using a light microscope (OLYMPUS BH-2, Japan). The average spore counts of the two samples in each altitude were taken. 2.2. Open-Plate Method The open-plate method was adapted based on Ye (1992) to determine the fungal colonies [26]. Briefly, the plates with Peptone Dextrose Agar, Potato Dextrose Agar and Czapek Dox Agar respectively were set on the same places as described above once during each month (total 12 times in one year). Three plates were opened for a period of 5 min at various altitudes, and then were incu- bated at 28℃ ± 1 for up to 5 days. The colonies were ℃ stained by lactic acid methylene blue solution and iden- tified by colony and microscopic morphology. Colony counts were then converted to the colony forming units/m3, CFU/m3 = 5000N/A t (N: colony count; A: square of plate; t: exposure time) [27]. The total colony forming units of three plates at each altitude were added to obtain the total colony forming units at each altitude. 2.3. Statistical Analysis The relationship between the monthly total spores count at various altitudes, the most common fungi and the monthly meteorological factors (average temperature: X1; average relative humidity: X2; average atmospheric pressure: X3; average wind speed: X4; rainfall: X5 and solar radiation: X6) were established respectively by means of stepwise multiple regression method (The data were analyzed using SPSS Version 12.0). The value of p < 0.05 was considered statistically significant. The meteorlogical data were obtained from Shenzhen me- teorlogical administration (Table 1). 3. RESULTS 3.1. Airborne Fungal Spore Count at Three Different Altitudes During the entire year, there were 2190 slides collected at three different altitudes. The total fungal spore counts at 10, 30 and 70 meters height were 4,102, 3,540 and 2,929.5 respectively. There were 27 genera or species identified belonging to the subphylum Zygomycotina family Mucoraceae: Rhizopus (0.17%); subphylum As- comycotina family Sphaeriaceae: Chaetomium (0.39%); subphylum Basidiomycotina family Ustilaginaceae: Usti- lago (13.04%), Uredinales (9.54%); subphylum Deutero- mycotina family Moniliaceae: Cladosporium (16.45%), Aspergillus (0.59%), Geotrichum (0.52%), Botrytis (0.31%), Trichothecium (0.09%), family Dematiaceae: Alternaria (11.41%), Helminthosporium (11.37%), Curvularia (8.41%), Stachybotrys (5.38%), Stemphylium (4.58%), Nigrospora (1.93%), Heterosporium (1.02%), Acrothe- cium sp. (0.53%), Papularia (0.31%), Clavispora (0.22%), Cercospora sp. (0.09%), Wardomyces (0.05%), family Tuborculariaceae: Fusarium (0.85%), Epicoccum (0.48%), family Sphaeropsidaceae: Hendersonia sp. (4.18%), As- cochyta sp. (4.04%), Diplodia sp. (3.65%), Sphaeropsis sp. (0.20%) and unidentified spores (0.20%) (Tables 2-4). At three different altitudes, the majority of spores were Cladosporium, Ustilago, Alternaria, Helmintho- sporium and Uredinales. 3.2. Fungal Colony Forming Units at Three Different Altitudes During the entire year, the total of 53,473, 50,962 and 49,543 colony forming units at 10, 30 and 70 meters, respectively were collected, enumerated and then char- acterized into 18 genera or species. The common fungi belonged to the subphylum Zygomycotina family Mu- coraceae: Muco r (0.31%), Rhizopus (0.31%); subphylum Ascomycotina family Sphaeriaceae: Chaetomiu m (0.51%), family Saccharomyetaceae: Saccharomyces (12.67%); subphylum Deuteromycotina family Moniliaceae: Peni- cillium (24.11%), Aspergillus (15.63%), Cladosporium (11.85%), Trichothecium (0.71%), Trichoderma (0.72%), Botrytis (0.51%), Geotrichum (0.31%), family Dema- tiaceae: Alternaria (5.11%), Curvularia (5.00%), Hel- minthosporium (1.22%), Nigrospora (0.51%), Stachy- botrys (0.51%), family Tuborculariaceae: Fusarium (0.71%), family Sphaeropsidaceae: Phoma sp. (0.61%), non-sporulating fungi (18.28%) and unidentified colony (0.41%) (Tables 5-7). Table 1. Averages of meteorological measurements: temperature (T), relative humidity (RH), atmospheric pressure (P), wind speed (WS), rainfall (R), and solar radiation (SR) in Shenzhen from March 2005-Febrary 2006. Mar Apr May Jun Jul Aug Sep Oct Nov Dec Jan Feb T (ºC) 17.2 23.1 27.2 27.8 29.4 28.5 28.8 26.2 22.9 16.7 16.2 17.8 RH (%) 71 74 76 78 71 79 72 64 67 50 69 72 P (hPa) 1016.6 1011.9 1005.6 1002.41004.31002.81007.21012.81014.4 1019.2 1016.41017.6 WS (m/sec) 2.1 1.8 1.8 1.7 1.7 1.9 2.2 2.4 2.2 2.7 2.6 2.3 R (mm) 48.3 42.9 379.2 469.9 326.6 587.3 231.8 21.3 14.0 9.0 20.6 48.0 SR (h) 759 881 1194 756 2264 1639 1495 1946 1798 1549 1202 912 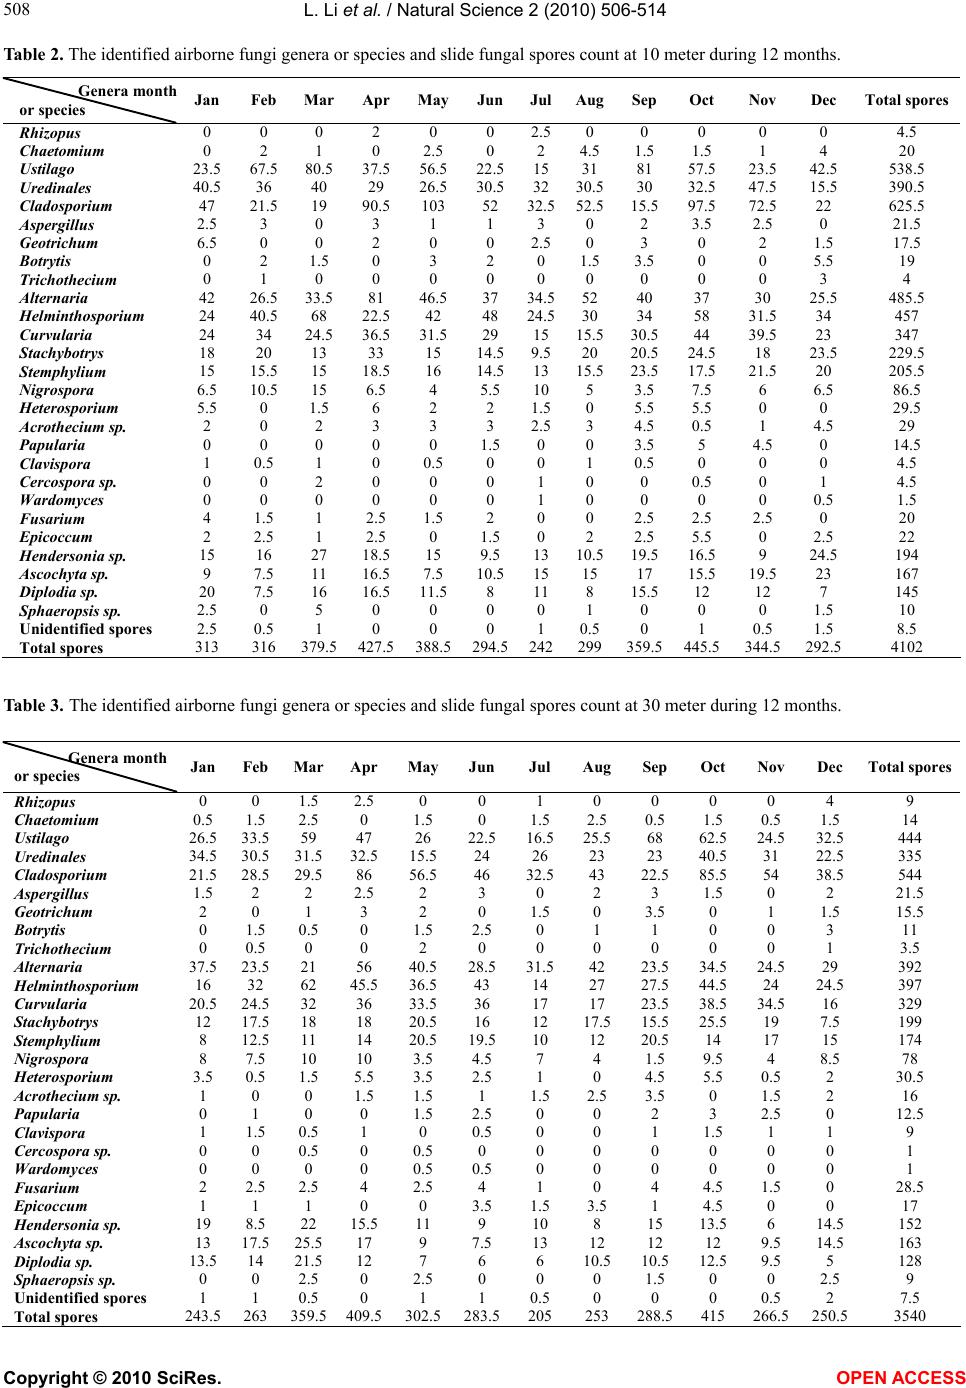 L. Li et al. / Natural Science 2 (2010) 506-514 Copyright © 2010 SciRes. OPEN ACCESS 508 Table 2. The identified airborne fungi genera or species and slide fungal spores count at 10 meter during 12 months. Genera month or species Jan Feb Mar AprMayJunJulAugSepOct Nov Dec Total spores Rhizopus 0 0 0 2 0 0 2.50 0 0 0 0 4.5 Chaetomium 0 2 1 0 2.5 0 2 4.5 1.5 1.5 1 4 20 Ustilago 23.5 67.5 80.5 37.5 56.5 22.51531 81 57.523.5 42.5 538.5 Uredinales 40.5 36 40 29 26.530.53230.530 32.547.5 15.5 390.5 Cladosporium 47 21.5 19 90.5103 52 32.552.515.597.572.5 22 625.5 Aspergillus 2.5 3 0 3 1 1 3 0 2 3.5 2.5 0 21.5 Geotrichum 6.5 0 0 2 0 0 2.50 3 0 2 1.5 17.5 Botrytis 0 2 1.5 0 3 2 0 1.5 3.5 0 0 5.5 19 Trichothecium 0 1 0 0 0 0 0 0 0 0 0 3 4 Alternaria 42 26.5 33.5 81 46.537 34.552 40 37 30 25.5 485.5 Helminthosporium 24 40.5 68 22.5 42 48 24.530 34 58 31.5 34 457 Curvularia 24 34 24.5 36.531.529 1515.530.544 39.5 23 347 Stachybotrys 18 20 13 33 15 14.59.520 20.524.518 23.5 229.5 Stemphylium 15 15.5 15 18.516 14.51315.523.517.521.5 20 205.5 Nigrospora 6.5 10.5 15 6.5 4 5.5 105 3.5 7.5 6 6.5 86.5 Heterosporium 5.5 0 1.5 6 2 2 1.50 5.5 5.5 0 0 29.5 Acrothecium sp. 2 0 2 3 3 3 2.53 4.5 0.5 1 4.5 29 Papularia 0 0 0 0 0 1.5 0 0 3.5 5 4.5 0 14.5 Clavispora 1 0.5 1 0 0.5 0 0 1 0.5 0 0 0 4.5 Cercospora sp. 0 0 2 0 0 0 1 0 0 0.5 0 1 4.5 Wardomyces 0 0 0 0 0 0 1 0 0 0 0 0.5 1.5 Fusarium 4 1.5 1 2.5 1.5 2 0 0 2.5 2.5 2.5 0 20 Epicoccum 2 2.5 1 2.5 0 1.5 0 2 2.5 5.5 0 2.5 22 Hendersonia sp. 15 16 27 18.515 9.5 1310.519.516.59 24.5 194 Ascochyta sp. 9 7.5 11 16.57.5 10.51515 17 15.519.5 23 167 Diplodia sp. 20 7.5 16 16.511.5 8 118 15.512 12 7 145 Sphaeropsis sp. 2.5 0 5 0 0 0 0 1 0 0 0 1.5 10 Unidentified spores 2.5 0.5 1 0 0 0 1 0.5 0 1 0.5 1.5 8.5 Total spores 313 316 379.5 427.5388.5294.5242299359.5445.5344.5 292.5 4102 Table 3. The identified airborne fungi genera or species and slide fungal spores count at 30 meter during 12 months. Genera month or species Jan Feb Mar Apr MayJun Jul AugSep Oct Nov Dec Total spores Rhizopus 0 0 1.5 2.5 0 0 1 0 0 0 0 4 9 Chaetomium 0.5 1.5 2.5 0 1.5 0 1.5 2.5 0.5 1.5 0.5 1.5 14 Ustilago 26.5 33.5 59 47 26 22.516.525.568 62.524.5 32.5 444 Uredinales 34.5 30.5 31.5 32.5 15.524 26 23 23 40.531 22.5 335 Cladosporium 21.5 28.5 29.5 86 56.546 32.543 22.585.554 38.5 544 Aspergillus 1.5 2 2 2.5 2 3 0 2 3 1.5 0 2 21.5 Geotrichum 2 0 1 3 2 0 1.5 0 3.5 0 1 1.5 15.5 Botrytis 0 1.5 0.5 0 1.5 2.5 0 1 1 0 0 3 11 Trichothecium 0 0.5 0 0 2 0 0 0 0 0 0 1 3.5 Alternaria 37.5 23.5 21 56 40.528.531.542 23.534.524.5 29 392 Helminthosporium 16 32 62 45.5 36.5 43 14 27 27.544.524 24.5 397 Curvularia 20.5 24.5 32 36 33.536 17 17 23.538.534.5 16 329 Stachybotrys 12 17.5 18 18 20.516 12 17.515.525.519 7.5 199 Stemphylium 8 12.5 11 14 20.519.510 12 20.514 17 15 174 Nigrospora 8 7.5 10 10 3.5 4.5 7 4 1.5 9.5 4 8.5 78 Heterosporium 3.5 0.5 1.5 5.5 3.5 2.5 1 0 4.5 5.5 0.5 2 30.5 Acrothecium sp. 1 0 0 1.5 1.5 1 1.5 2.5 3.5 0 1.5 2 16 Papularia 0 1 0 0 1.5 2.5 0 0 2 3 2.5 0 12.5 Clavispora 1 1.5 0.5 1 0 0.5 0 0 1 1.5 1 1 9 Cercospora sp. 0 0 0.5 0 0.5 0 0 0 0 0 0 0 1 Wardomyces 0 0 0 0 0.5 0.5 0 0 0 0 0 0 1 Fusarium 2 2.5 2.5 4 2.5 4 1 0 4 4.5 1.5 0 28.5 Epicoccum 1 1 1 0 0 3.5 1.5 3.5 1 4.5 0 0 17 Hendersonia sp. 19 8.5 22 15.5 11 9 10 8 15 13.56 14.5 152 Ascochyta sp. 13 17.5 25.5 17 9 7.5 13 12 12 12 9.5 14.5 163 Diplodia sp. 13.5 14 21.5 12 7 6 6 10.510.512.59.5 5 128 Sphaeropsis sp. 0 0 2.5 0 2.5 0 0 0 1.5 0 0 2.5 9 Unidentified spores 1 1 0.5 0 1 1 0.5 0 0 0 0.5 2 7.5 Total spores 243.5 263 359.5 409.5302.5283.5205 253 288.5 415 266.5 250.5 3540 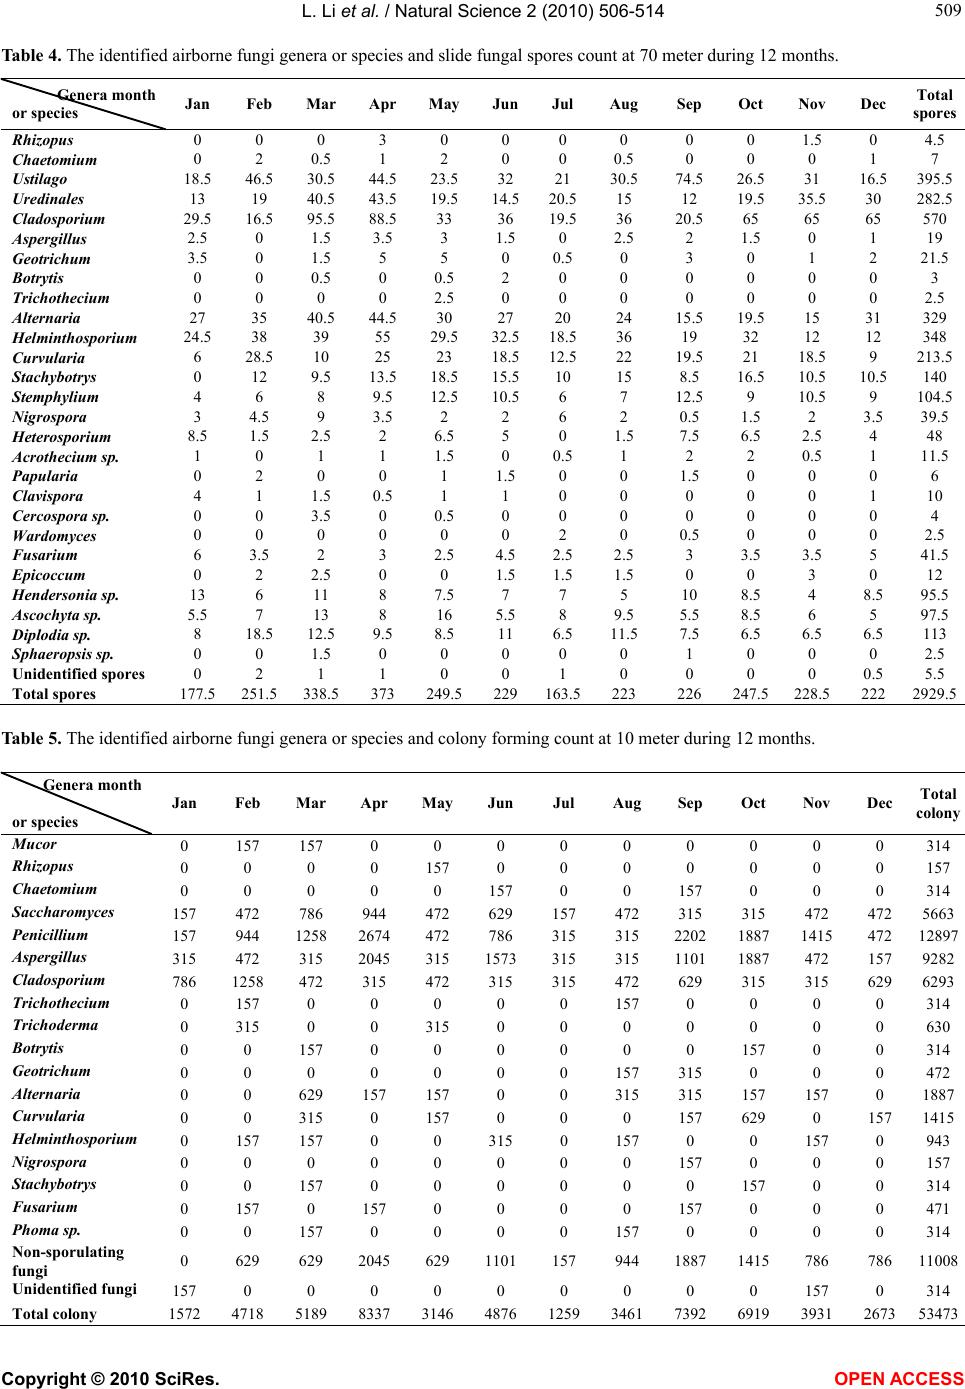 L. Li et al. / Natural Science 2 (2010) 506-514 Copyright © 2010 SciRes. OPEN ACCESS 509 509 Table 4. The identified airborne fungi genera or species and slide fungal spores count at 70 meter during 12 months. Genera month or species Jan Feb Mar Apr MayJun Jul Aug Sep Oct Nov Dec Total spores Rhizopus 0 0 0 3 0 0 0 0 0 0 1.5 0 4.5 Chaetomium 0 2 0.5 1 2 0 0 0.5 0 0 0 1 7 Ustilago 18.5 46.5 30.5 44.5 23.5 32 21 30.5 74.5 26.5 31 16.5 395.5 Uredinales 13 19 40.5 43.5 19.5 14.5 20.515 12 19.5 35.5 30 282.5 Cladosporium 29.5 16.5 95.5 88.5 33 36 19.536 20.5 65 65 65 570 Aspergillus 2.5 0 1.5 3.5 3 1.5 0 2.5 2 1.5 0 1 19 Geotrichum 3.5 0 1.5 5 5 0 0.5 0 3 0 1 2 21.5 Botrytis 0 0 0.5 0 0.5 2 0 0 0 0 0 0 3 Trichothecium 0 0 0 0 2.5 0 0 0 0 0 0 0 2.5 Alternaria 27 35 40.5 44.5 30 27 20 24 15.5 19.5 15 31 329 Helminthosporium 24.5 38 39 55 29.5 32.5 18.536 19 32 12 12 348 Curvularia 6 28.5 10 25 23 18.5 12.522 19.5 21 18.5 9 213.5 Stachybotrys 0 12 9.5 13.5 18.5 15.5 10 15 8.5 16.5 10.5 10.5 140 Stemphylium 4 6 8 9.5 12.5 10.5 6 7 12.5 9 10.5 9 104.5 Nigrospora 3 4.5 9 3.5 2 2 6 2 0.5 1.5 2 3.5 39.5 Heterosporium 8.5 1.5 2.5 2 6.5 5 0 1.5 7.5 6.5 2.5 4 48 Acrothecium sp. 1 0 1 1 1.5 0 0.5 1 2 2 0.5 1 11.5 Papularia 0 2 0 0 1 1.5 0 0 1.5 0 0 0 6 Clavispora 4 1 1.5 0.5 1 1 0 0 0 0 0 1 10 Cercospora sp. 0 0 3.5 0 0.5 0 0 0 0 0 0 0 4 Wardomyces 0 0 0 0 0 0 2 0 0.5 0 0 0 2.5 Fusarium 6 3.5 2 3 2.5 4.5 2.5 2.5 3 3.5 3.5 5 41.5 Epicoccum 0 2 2.5 0 0 1.5 1.5 1.5 0 0 3 0 12 Hendersonia sp. 13 6 11 8 7.5 7 7 5 10 8.5 4 8.5 95.5 Ascochyta sp. 5.5 7 13 8 16 5.5 8 9.5 5.5 8.5 6 5 97.5 Diplodia sp. 8 18.5 12.5 9.5 8.5 11 6.5 11.5 7.5 6.5 6.5 6.5 113 Sphaeropsis sp. 0 0 1.5 0 0 0 0 0 1 0 0 0 2.5 Unidentified spores 0 2 1 1 0 0 1 0 0 0 0 0.5 5.5 Total spores 177.5 251.5 338.5 373 249.5 229 163.5223 226 247.5 228.5 222 2929.5 Table 5. The identified airborne fungi genera or species and colony forming count at 10 meter during 12 months. Genera month or species Jan Feb Mar Apr May Jun Jul Aug Sep Oct Nov Dec Total colony Mucor 0 157 157 0 0 0 0 0 0 0 0 0 314 Rhizopus 0 0 0 0 157 0 0 0 0 0 0 0 157 Chaetomium 0 0 0 0 0 157 0 0 157 0 0 0 314 Saccharomyces 157 472 786 944 472 629 157 472 315 315 472 472 5663 Penicillium 157 944 1258 2674472 786 315 315 22021887 1415 472 12897 Aspergillus 315 472 315 2045315 1573315 315 11011887 472 157 9282 Cladosporium 786 1258 472 315 472 315 315 472 629 315 315 629 6293 Trichothecium 0 157 0 0 0 0 0 157 0 0 0 0 314 Trichoderma 0 315 0 0 315 0 0 0 0 0 0 0 630 Botrytis 0 0 157 0 0 0 0 0 0 157 0 0 314 Geotrichum 0 0 0 0 0 0 0 157 315 0 0 0 472 Alternaria 0 0 629 157 157 0 0 315 315 157 157 0 1887 Curvularia 0 0 315 0 157 0 0 0 157 629 0 157 1415 Helminthosporium 0 157 157 0 0 315 0 157 0 0 157 0 943 Nigrospora 0 0 0 0 0 0 0 0 157 0 0 0 157 Stachybotrys 0 0 157 0 0 0 0 0 0 157 0 0 314 Fusarium 0 157 0 157 0 0 0 0 157 0 0 0 471 Phoma sp. 0 0 157 0 0 0 0 157 0 0 0 0 314 Non-sporulating fungi 0 629 629 2045 629 1101157 944 18871415 786 786 11008 Unidentified fungi 157 0 0 0 0 0 0 0 0 0 157 0 314 Total colony 1572 4718 5189 833731464876125934617392 6919 3931 267353473 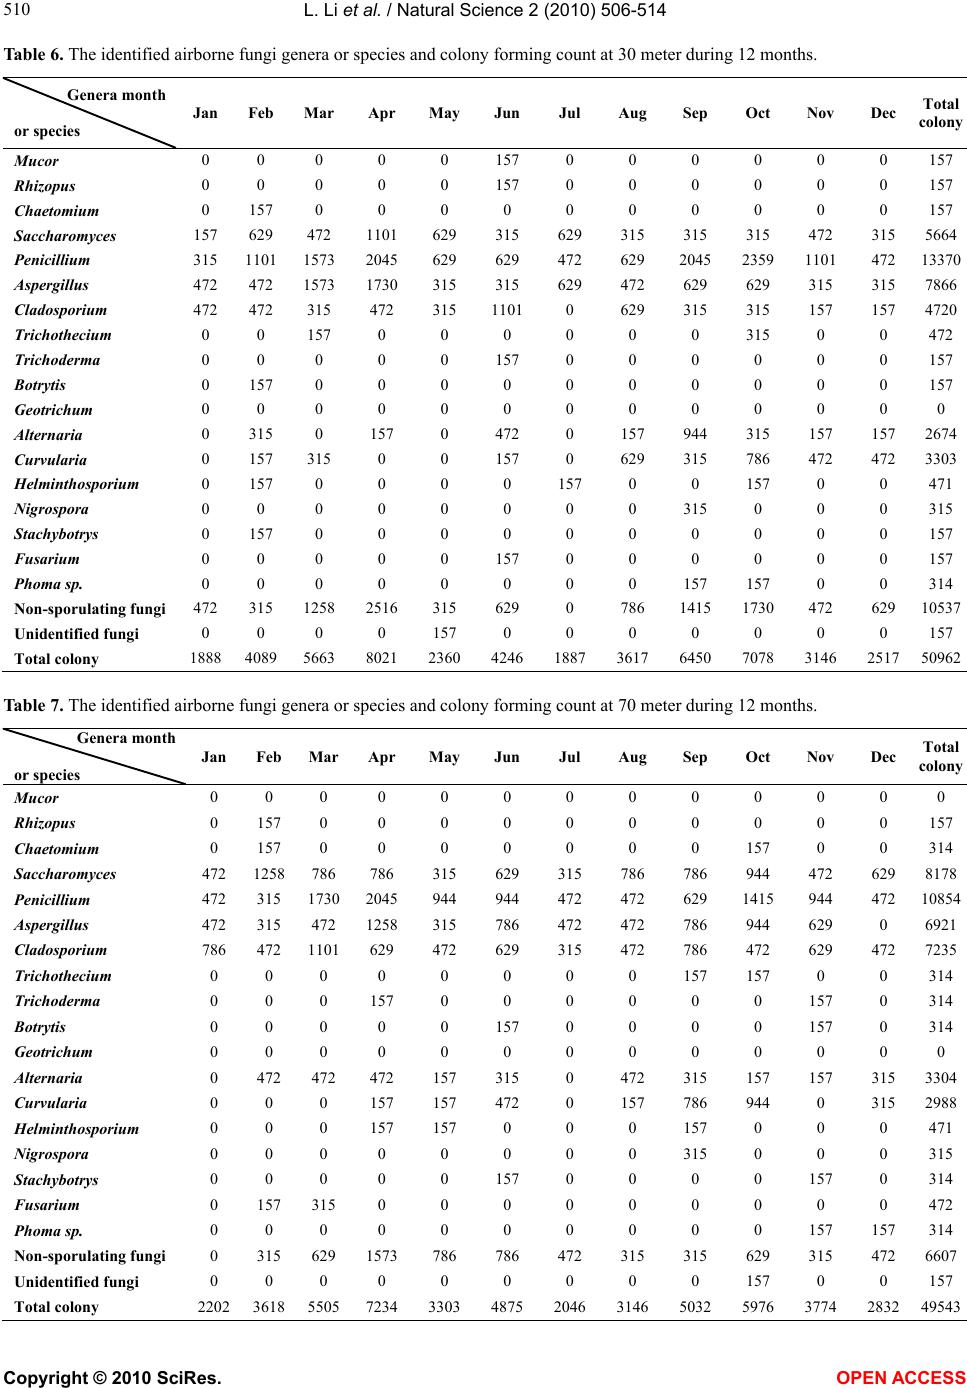 L. Li et al. / Natural Science 2 (2010) 506-514 Copyright © 2010 SciRes. OPEN ACCESS 510 Table 6. The identified airborne fungi genera or species and colony forming count at 30 meter during 12 months. Genera month or species Jan Feb Mar Apr May Jun Jul Aug Sep Oct Nov Dec Total colony Mucor 0 0 0 0 0 157 0 0 0 0 0 0 157 Rhizopus 0 0 0 0 0 157 0 0 0 0 0 0 157 Chaetomium 0 157 0 0 0 0 0 0 0 0 0 0 157 Saccharomyces 157 629 472 1101629 315 629 315 315 315 472 315 5664 Penicillium 315 1101 1573 2045629 629 472 629 20452359 1101 472 13370 Aspergillus 472 472 1573 1730315 315 629 472 629 629 315 315 7866 Cladosporium 472 472 315 472 315 11010 629 315 315 157 157 4720 Trichothecium 0 0 157 0 0 0 0 0 0 315 0 0 472 Trichoderma 0 0 0 0 0 157 0 0 0 0 0 0 157 Botrytis 0 157 0 0 0 0 0 0 0 0 0 0 157 Geotrichum 0 0 0 0 0 0 0 0 0 0 0 0 0 Alternaria 0 315 0 157 0 472 0 157 944 315 157 157 2674 Curvularia 0 157 315 0 0 157 0 629 315 786 472 472 3303 Helminthosporium 0 157 0 0 0 0 157 0 0 157 0 0 471 Nigrospora 0 0 0 0 0 0 0 0 315 0 0 0 315 Stachybotrys 0 157 0 0 0 0 0 0 0 0 0 0 157 Fusarium 0 0 0 0 0 157 0 0 0 0 0 0 157 Phoma sp. 0 0 0 0 0 0 0 0 157 157 0 0 314 Non-sporulating fungi 472 315 1258 2516315 629 0 786 14151730 472 629 10537 Unidentified fungi 0 0 0 0 157 0 0 0 0 0 0 0 157 Total colony 1888 4089 5663 802123604246188736176450 7078 3146 251750962 Table 7. The identified airborne fungi genera or species and colony forming count at 70 meter during 12 months. Genera month or species Jan Feb Mar Apr May Jun Jul Aug Sep Oct Nov Dec Total colony Mucor 0 0 0 0 0 0 0 0 0 0 0 0 0 Rhizopus 0 157 0 0 0 0 0 0 0 0 0 0 157 Chaetomium 0 157 0 0 0 0 0 0 0 157 0 0 314 Saccharomyces 472 1258 786 786 315 629 315 786 786 944 472 629 8178 Penicillium 472 315 1730 2045944 944 472 472 629 1415 944 472 10854 Aspergillus 472 315 472 1258315 786 472 472 786 944 629 0 6921 Cladosporium 786 472 1101 629 472 629 315 472 786 472 629 472 7235 Trichothecium 0 0 0 0 0 0 0 0 157 157 0 0 314 Trichoderma 0 0 0 157 0 0 0 0 0 0 157 0 314 Botrytis 0 0 0 0 0 157 0 0 0 0 157 0 314 Geotrichum 0 0 0 0 0 0 0 0 0 0 0 0 0 Alternaria 0 472 472 472 157 315 0 472 315 157 157 315 3304 Curvularia 0 0 0 157 157 472 0 157 786 944 0 315 2988 Helminthosporium 0 0 0 157 157 0 0 0 157 0 0 0 471 Nigrospora 0 0 0 0 0 0 0 0 315 0 0 0 315 Stachybotrys 0 0 0 0 0 157 0 0 0 0 157 0 314 Fusarium 0 157 315 0 0 0 0 0 0 0 0 0 472 Phoma sp. 0 0 0 0 0 0 0 0 0 0 157 157 314 Non-sporulating fungi 0 315 629 1573786 786 472 315 315 629 315 472 6607 Unidentified fungi 0 0 0 0 0 0 0 0 0 157 0 0 157 Total colony 2202 3618 5505 7234330348752046314650325976 3774 283249543 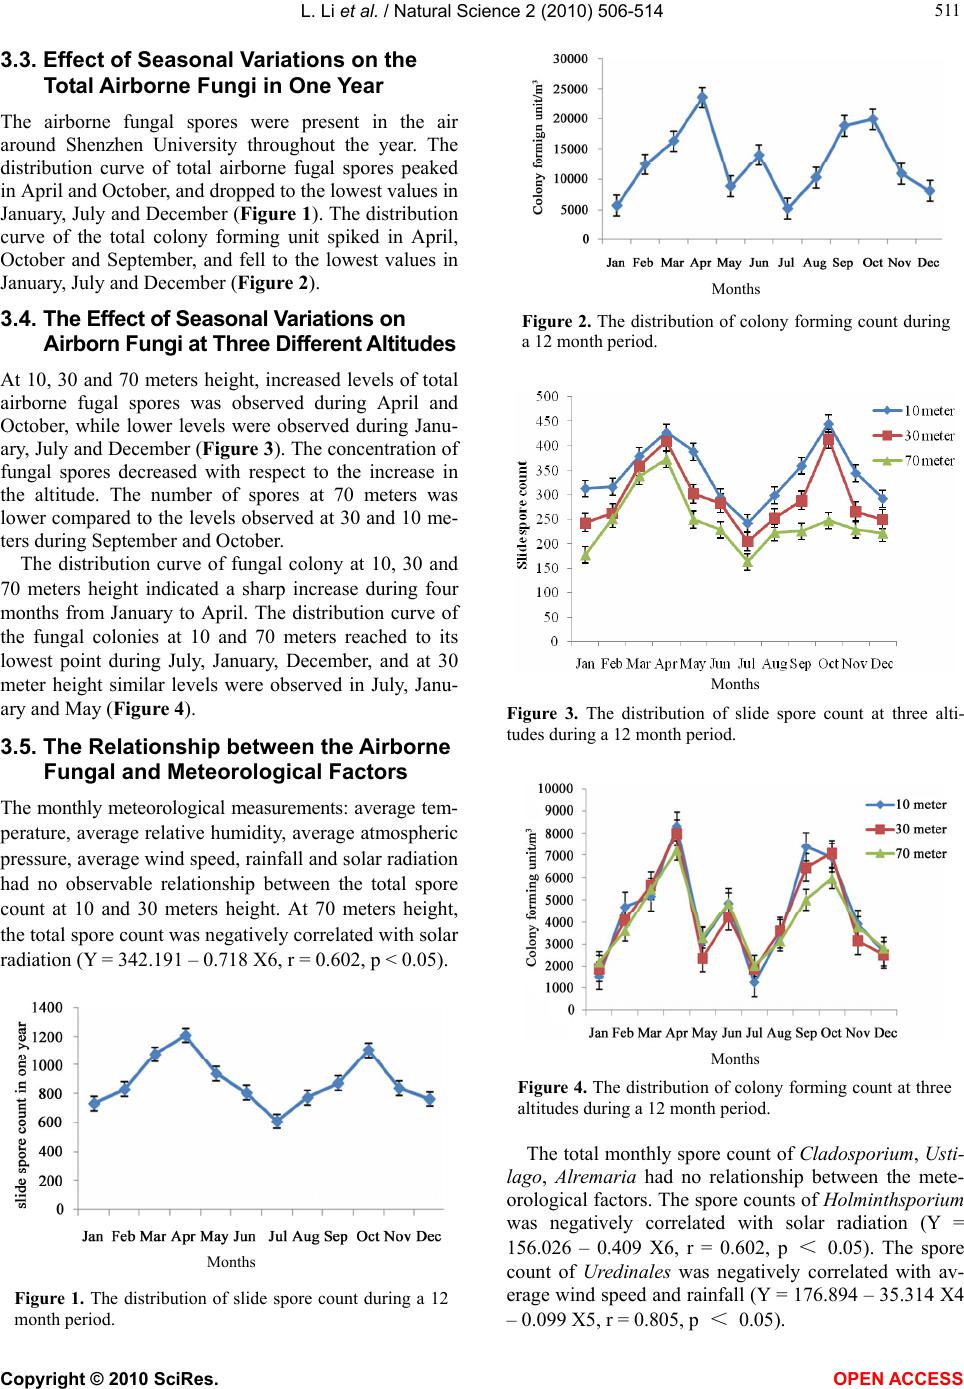 L. Li et al. / Natural Science 2 (2010) 506-514 Copyright © 2010 SciRes. OPEN ACCESS 511 511 3.3. Effect of Seasonal Variations on the Total Airborne Fungi in One Year The airborne fungal spores were present in the air around Shenzhen University throughout the year. The distribution curve of total airborne fugal spores peaked in April and October, and dropped to the lowest values in January, July and December (Figure 1). The distribution curve of the total colony forming unit spiked in April, October and September, and fell to the lowest values in January, July and December (Figure 2). 3.4. The Effect of Seasonal Variations on Airborn Fungi at Three Different Altitudes At 10, 30 and 70 meters height, increased levels of total airborne fugal spores was observed during April and October, while lower levels were observed during Janu- ary, July and December (Figure 3). The concentration of fungal spores decreased with respect to the increase in the altitude. The number of spores at 70 meters was lower compared to the levels observed at 30 and 10 me- ters during September and October. The distribution curve of fungal colony at 10, 30 and 70 meters height indicated a sharp increase during four months from January to April. The distribution curve of the fungal colonies at 10 and 70 meters reached to its lowest point during July, January, December, and at 30 meter height similar levels were observed in July, Janu- ary and May (Figure 4). 3.5. The Relationship between the Airborne Fungal and Meteorological Factors The monthly meteorological measurements: average tem- perature, average relative humidity, average atmospheric pressure, average wind speed, rainfall and solar radiation had no observable relationship between the total spore count at 10 and 30 meters height. At 70 meters height, the total spore count was negatively correlated with solar radiation (Y = 342.191 – 0.718 X6, r = 0.602, p < 0.05). Months Figure 1. The distribution of slide spore count during a 12 month period. Months Figure 2. The distribution of colony forming count during a 12 month period. Months Figure 3. The distribution of slide spore count at three alti- tudes during a 12 month period. Months Figure 4. The distribution of colony forming count at three altitudes during a 12 month period. The total monthly spore count of Cladospo rium, Usti- lago, Alremaria had no relationship between the mete- orological factors. The spore counts of Holminthsporium was negatively correlated with solar radiation (Y = 156.026 – 0.409 X6, r = 0.602, p < 0.05). The spore count of Uredinales was negatively correlated with av- erage wind speed and rainfall (Y = 176.894 – 35.314 X4 – 0.099 X5, r = 0.805, p < 0.05). 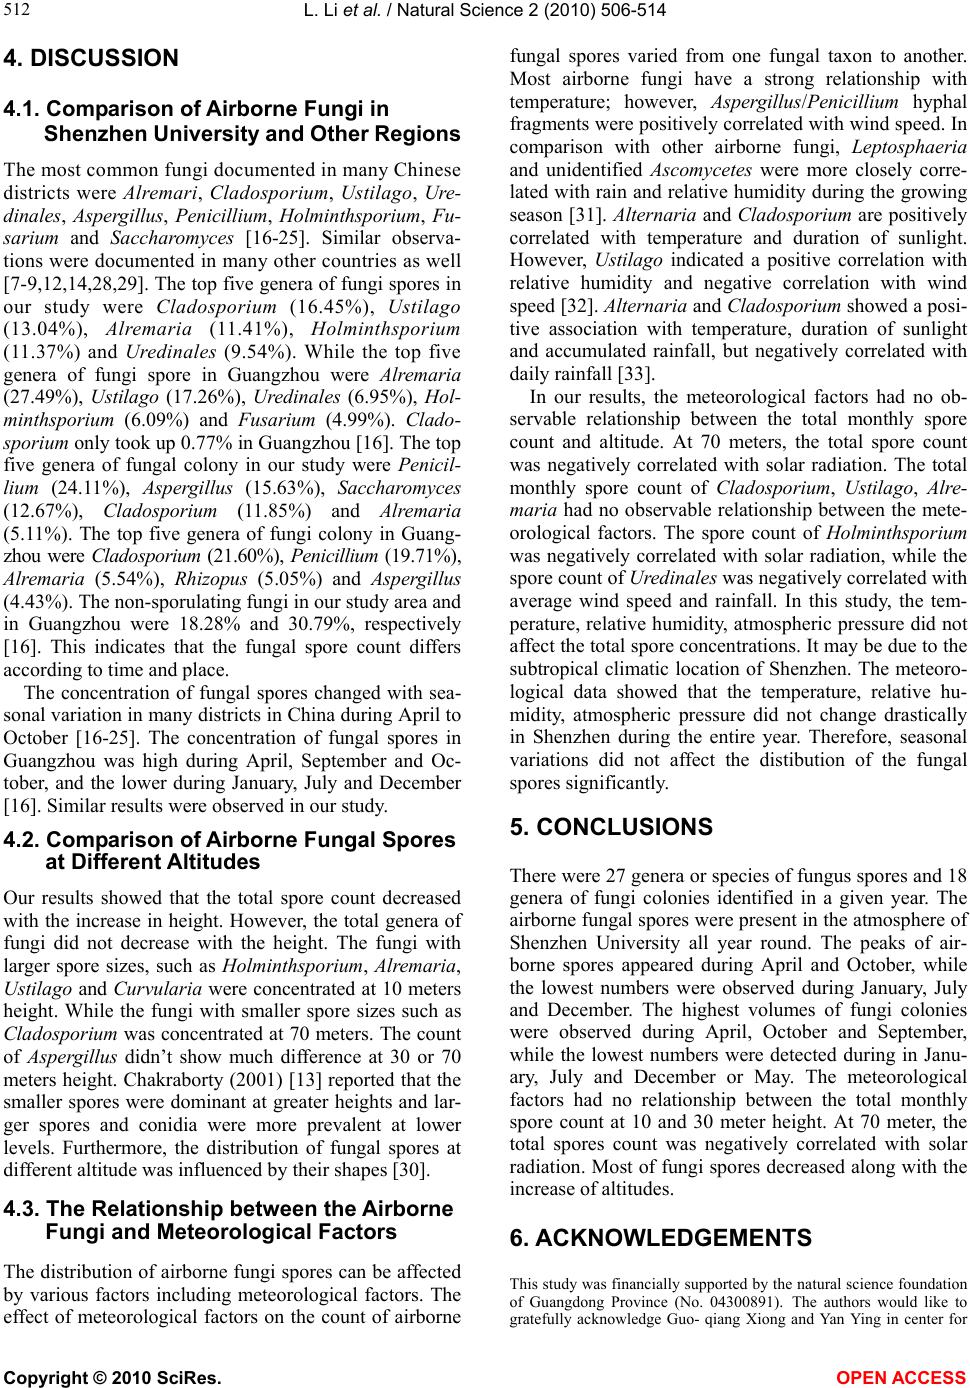 L. Li et al. / Natural Science 2 (2010) 506-514 Copyright © 2010 SciRes. OPEN ACCESS 512 4. DISCUSSION 4.1. Comparison of Airborne Fungi in Shenzhen University and Other Regions The most common fungi documented in many Chinese districts were Alremari, Cladosporium, Usti lago , Ure- dinales, Asperg illus, Penicill ium, Ho lm in ths p or iu m, Fu- sarium an d Saccharomyces [16-25]. Similar observa- tions were documented in many other countries as well [7-9,12,14,28,29]. The top five genera of fungi spores in our study were Cladosporium (16.45%), Ustilago (13.04%), Alremaria (11.41%), Holminthsporium (11.37%) and Uredinales (9.54%). While the top five genera of fungi spore in Guangzhou were Alremaria (27.49%), Ustilago (17.26%), Uredinales (6.95%), Hol- minthsporium (6.09%) and Fusarium (4.99%). Clado- sporium only took up 0.77% in Guangzhou [16]. The top five genera of fungal colony in our study were Penicil- lium (24.11%), Aspergillus (15.63%), Saccharomyces (12.67%), Cladosporium (11.85%) and Alremaria (5.11%). The top five genera of fungi colony in Guang- zhou were Cladosporium (21.60%), Penicillium (19.71%), Alremaria (5.54%), Rhizopus (5.05%) and Aspergillus (4.43%). The non-sporulating fungi in our study area and in Guangzhou were 18.28% and 30.79%, respectively [16]. This indicates that the fungal spore count differs according to time and place. The concentration of fungal spores changed with sea- sonal variation in many districts in China during April to October [16-25]. The concentration of fungal spores in Guangzhou was high during April, September and Oc- tober, and the lower during January, July and December [16]. Similar results were observed in our study. 4.2. Comparison of Airborne Fungal Spores at Different Altitudes Our results showed that the total spore count decreased with the increase in height. However, the total genera of fungi did not decrease with the height. The fungi with larger spore sizes, such as Holmin thsporium, Alremaria, Ustilago and Curvularia were concentrated at 10 meters height. While the fungi with smaller spore sizes such as Cladosporium was concentrated at 70 meters. The count of Aspergillus didn’t show much difference at 30 or 70 meters height. Chakraborty (2001) [13] reported that the smaller spores were dominant at greater heights and lar- ger spores and conidia were more prevalent at lower levels. Furthermore, the distribution of fungal spores at different altitude was influenced by their shapes [30]. 4.3. The Relationship between the Airborne Fungi and Meteorological Factors The distribution of airborne fungi spores can be affected by various factors including meteorological factors. The effect of meteorological factors on the count of airborne fungal spores varied from one fungal taxon to another. Most airborne fungi have a strong relationship with temperature; however, Aspergillus/Penicillium hyphal fragments were positively correlated with wind speed. In comparison with other airborne fungi, Leptosphaeria and unidentified Ascomycetes were more closely corre- lated with rain and relative humidity during the growing season [31]. Alternaria and Cladosporium are positively correlated with temperature and duration of sunlight. However, Ustilago indicated a positive correlation with relative humidity and negative correlation with wind speed [32]. Alternaria and Cladosporium showed a posi- tive association with temperature, duration of sunlight and accumulated rainfall, but negatively correlated with daily rainfall [33]. In our results, the meteorological factors had no ob- servable relationship between the total monthly spore count and altitude. At 70 meters, the total spore count was negatively correlated with solar radiation. The total monthly spore count of Cladosporium, Ustilag o, Alre- maria had no observable relationship between the mete- orological factors. The spore count of Holminthsporium was negatively correlated with solar radiation, while the spore count of Uredinales was negatively correlated with average wind speed and rainfall. In this study, the tem- perature, relative humidity, atmospheric pressure did not affect the total spore concentrations. It may be due to the subtropical climatic location of Shenzhen. The meteoro- logical data showed that the temperature, relative hu- midity, atmospheric pressure did not change drastically in Shenzhen during the entire year. Therefore, seasonal variations did not affect the distibution of the fungal spores significantly. 5. CONCLUSIONS There were 27 genera or species of fungus spores and 18 genera of fungi colonies identified in a given year. The airborne fungal spores were present in the atmosphere of Shenzhen University all year round. The peaks of air- borne spores appeared during April and October, while the lowest numbers were observed during January, July and December. The highest volumes of fungi colonies were observed during April, October and September, while the lowest numbers were detected during in Janu- ary, July and December or May. The meteorological factors had no relationship between the total monthly spore count at 10 and 30 meter height. At 70 meter, the total spores count was negatively correlated with solar radiation. Most of fungi spores decreased along with the increase of altitudes. 6. ACKNOWLEDGEMENTS This study was financially supported by the natural science foundation of Guangdong Province (No. 04300891). The authors would like to gratefully acknowledge Guo- qiang Xiong and Yan Ying in center for  L. Li et al. / Natural Science 2 (2010) 506-514 Copyright © 2010 SciRes. OPEN ACCESS 513 513 disease control of Nanchang who helped with the indentification of the fungi. The authors would also thank Shenzhen meteorlogical admini- stration for providing the meteorlogical data. REFERENCES [1] Horner, W.E., Helbling, A., Salvaggio, J.E. and Lehrer, S.B. (1995) Fungal allergens. Clinical Microbiology Re- views, 8(2), 161-179. [2] Niedoszytko, M., Chełmińska, M. and Chełmiński, K. (2002) Fungal allergy--part II. Polski Merkuriusz Lekar- ski, 12(70), 314-317. [3] Semik-Orzech, A., Barczyk, A. and Pierzchała, W. (2008) The influence of sensitivity to fungal allergens on the development and course of allergic diseases of the respi- ratory tract. Pneumonologia I Alergologia Polska, 76(1), 29-36. [4] Kurup, V.P., Shen, H.D. and Banerjee, B. (2000) Respi- ratory fungal allergy. Microbes and Infection, 2(9), 1101-1110. [5] Kakde, U.B., Kakde, H.U. and Saoji, A.A. (2001) Sea- sonal variation of fungal propagules in a fruit market en- vironment, Nagpur (India). Aerobiologia, 17, 177-182. [6] Katial, R.K., Zhang, Y., Jones, R.H. and Dyer, P.D. (1997) Atmospheric mold spore counts in relation to meteoro- logical parameters. International Journal of Biometeo- rology, 41(1), 17-22. [7] Oliveira, M., Ribeiro, H. and Abreu, I. (2005) Annual variation of fungal spores in atmosphere of Porto: 2003. Annals of Agricultural and Environmental Medicine, 12(2), 309-315. [8] Ogunlana, E.O. (1975) Fungal air spora at Ibadan, Nige- ria. Journal of Applied Microbiology, 29(4), 458-463. [9] Moustafa, A.F. and Kamel, S.M. (1976) A study of fungal spore poupulations in the atmosphere of Kuwait. Mycopathologia, 59(1), 29-35. [10] Takahashi, T. (1997) Airborne fungal colony-forming units in outdoor and indoor environments in Yokohama, Japan. Mycopathologia, 139, 23-33. [11] Marshall, W.A. (1997) Seasonality in antarctic airborne fungal spores. Applied and Environmental Microbiology, 63(6), 2240-2245. [12] Al-Suwaine, A.S., Bahkali, A.H. and Hasnain, S.M. (1999) Seasonal incidence of airborne fungal allergens in Riyadh, Saudi Arabia. Mycopathologia, 145(1), 15-22. [13] Chakraborty, P., Gupta-Bhattacharya, S., Chowdhury, I., Majumdar, M.R. and Chanda, S. (2001) Differences in concentrations of allergenic pollens and spores at differ- ent heights on an agricultural farm in West Bengal, India. Annals of Agricultural and Environmental Medicine, 8(2), 123-130. [14] Mezzari, A., Perin, C., Santos Júnior, S.A., Bernd, L.A. and Gesu, G .D. (2003) Airborne fungi and sensitization in atopic individuals in Porto Alegre, RS, Brazil. Revista da Associação Médica Brasileira, 49(3), 270-273. [15] Segvić Klarić, M. and Pepeljnjak, S. (2006) A year-round aeromycological study in Zagreb area, Croatia. Annals of Agricultural and Environmental Medicine, 13(1), 55-64. [16] Zhan, Q.S., Wang, S.H., Li, M.L. and Zhang, W.Y. (1994) Study on quantity and types of allergic fungi in air. Mod- ern Preventive Medicine, 21(2), 67-68. (in Chinese) [17] Jiang, X.W., Wu, W.J., Yang, C.Y. and Jiang, X.C. (1994) A primanry investigation on airborne allergenic fungi in the eastern district of Changsha. Bulletin of Hunan Medical University, 19(4), 326-328. (in Chinese) [18] Li, Y.F. and Sun, X.Z. (1994) Investigation of airborne fungi in Xian distict. Journal of Xian Medical University, 15(4), 371-382. (in Chinese) [19] Fang, R.Q., Xie, S.Q. and Zhan, H.M. (1997) Investiga- tion report of airborne fungus across Kunming city proper. Academic Journal of Kunming Medical College, 18(3), 30-33. (in Chinese) [20] Wang, M.M. and Liu, T.M. (1997) Prodominant fungi present in the air of a hospital in Nanjing and their sea- sonal variation. Journal of Nanjing Railway Medical College, 16(4), 256-258. (in Chinese) [21] Zhang, Z.Z., Li, Y., Long, F.Q. and Mo, X. (1999) Inves- tigation of airborne fungi in Nanning Guangxi Province. Guangxi Medical Journal, 21(6), 1121-1124. (in Chinese) [22] Ning, Y.L., Chang, H.Z. and Zhang, N. (2001) Investiga- tion report of airborne fungus in Baoding City. Journal of Hebei Medical College Continuting Education, 18(3), 40-41. (in Chinese) [23] Su, H., Lu, X., Chen, W.Y., Zhang, B.B. and Li, Y.J. (2001) Investigation on the atmosphere propagating sen- sitzing Fungi in Wuhan. Chinese Journal of Microbiol- ogy and Immunology, 21(Supplement), 42-43. (in Chi- nese) [24] Jin, Z.C., Yin, K.H. and Chen, X.X. (2001) Study of the relationship between airborne fung and asthma in Zhen- jiang city. Practical Preventive Medicine, 8(3), 170-172. (in Chinese) [25] Huang, J.J., Hong, S.L., Zhou, W. and Yang, Y.C. (2002) Air-borne molds in Chongqing city. Chongqing Medicine, 31(8), 701-703. (in Chinese) [26] Ye, S.T., Qiao, B.S. and Lu, Y.J. (1992) China allergic aeromycology. People’s Medical Publishing House, Bei- jing. (in Chinese) [27] Zhou, S.N., Chen, W.T., Burnett, J. and Deng, B.L. (1997) A study of microorganisms in air-conditioned indoor en- vironment. Acta Scientiae Circumstantiae, 17(4), 498-501. (in Chinese) [28] Hedayati, M.T., Mayahi, S., Aghili, R. and Gohari- moghadam, K. (2005) Airborne fungi in indoor and out- door of asthmatic patients’ home, living in the city of sari. Iranian Journal of Allergy, Asthma and Immunology, 4(4), 189-91. [29] Ana, S.G., Torres-Rodríguez, J.M., Ramírez, E.A., García, S.M. and Belmonte-Soler, J. (2006) Seasonal distribution of Alternaria, Aspergillus, Cladosporium and Penicillium species isolated in homes of fungal allergic patients. Journal Investigational Allergology and Clinical Immu- nology, 16(6), 357-363. [30] Lacey, J. (1997). Fungi and actinomycemycetes as aller- gens. In: Kay, A.B. Ed., Allergy and Allergic Diseases, Black Science, London K, 858-883. [31] Li, D.W. and Kendrick, B. (1995) A year-round study on functional relationships of airborne fungi with meteoro- logical factors. International Journal of Biometeorology, 39(2), 74-80. [32] Sabariego, S., Guardia, C.D. and Alba, F. (2000) The effect of meteorological factors on the daily variation of airborne fungal spores in Granada (southern Spain). International Journal of Biometeorology, 44(1), 1-5. |