

Paper Menu >>
Journal Menu >>
 Advances in Physical Education 2012. Vol.2, No.2, 44-48 Published Online May 2012 in SciRes (http://www.SciRP.org/journal/ape) http://dx.doi.org/10.4236/ape.2012.22008 Copyright © 2012 SciRes. 44 Reliability and Sex Differences in the Foot Pressure Load Balance Test and Its Relationship to Physical Characteristics in Preschool Children Shigeki Matsuda1, Shinichi Demura2, Kosho Kasuga3, Hiroki Sugiura2 1Gifu Shotoku Gakuen Un i versity, Gifu, Japan 2Graduate School of Natural Science & Technology, Kanazawa Uni ver sity, Kanazawa, Japan 3Gifu University, Gifu, Japan Email: [email protected], demura@ed.kanazawa-u.ac.jp, kasug [email protected], Received April 1st, 2012; revised May 4th, 2012; accepted May 15th, 2012 This study aimed to examine the trial-to-trial reliability and sex differences in a foot pressure load balance test and its relationship to physical characteristics in 396 preschool children (201 boys and 195 girls). The subjects were asked to maintain an upright standing posture for 10 seconds three times on the Footview Clinic, an instrument designed to calculate the right-left and anterior-posterior ratios of foot pressure load. The ratios of the left and anterior foot pressure loads in right and left feet were selected as variables. In- tra-class correlation coefficients between the second and third trials in all variables were high (intra-class correlation coefficients = 0.70 - 0.90). The above variables showed insignificant sex differences and little relationships with physique. When measuring foot pressure load balance, it is desirable to use a mean of the second and third trials as a representative. Keywords: Foot Pressure Load Balance; Preschool Children; Sex Difference; Reliability Introduction Toes play an important role in propelling the body forward when walking and running and in maintaining posture while standing (Hughes et al., 1990; Kulthanan et al., 2004; Chou et al., 2009; Tanaka et al., 1996; Hutton & Dhanendran, 1979). In the case of children’s toes, problems related to toe deformities such as curly and overlapping toes are sometimes found (Asir- vatham, 2001; Wenger & Leach, 1986). It was recently reported that many young children in Japan have an “untouched-toe”, referring to the case in which a toe does not touch the floor while standing (Matsuda et al., 2009, 2011; Harada, 2001). Harada (2001) reported that the rate of occurrence of untouched toes in children was about 5% - 10 % in 1980, but the ratio increased rapidly to about 50% in 2000. Although a child with untouched-toes does not require surgery as with the case of curly toes and other foot disorders (Asirvatham, 2001; Wenger & Leach, 1986), a great deal of attention has been paid to this condition because the rate of occurrence has increased so markedly (Matsuda et al., 2009, 2011; Harada, 2001). A decrease in toe use frequency along with decreases in movement mass, type of shoes worn, and heel load etc. have been noted as factors re- lated to the occurrence of untouched-toes (Harada, 2001), the relationships between the above factors and the occurrence of untouched-toes have not been examined.Above all else, because heel load is considered to play a role in posture deterioration, it is necessary to clarify the relationship between the occurrence of untouched-toes and heel load. When evaluating heel load, it is necessary to evaluate the anterior-posterior balance of foot pressure load after dividing the foot pressure load into the ante- ri or and posterior parts. However, because a method to adequa t e l y evaluate the anterior-posterior balance of foot pressure load has not been established, the relationship between the untouched- toes and heel load has not been examined. On the other hand, human’s body has functional asymmetries such as a dominant hand, a dominant leg, and a dominant eye. Previc (1991) stated that many people depend on the left side of their bodies for posture maintenance because the left otolith function, which is an organization related to balance sense in inner ear, is superior to the right one. Because there is a large possibility that there is also some asymmetry in foot pressure load balance, the examination of the asymmetry is needed. Recently , a device (The Foot view Clinic, Nitta, Japa n) designed to measure the right-left and anterior-posterior balances of foot pressure load was developed, thereby allowing foot pressure load balance to be determined easily. We can examine the rela- tionship between untouched-toes, anterior-posterior balance of the foot pressure load and the asymmetry of the foot pressure load through the use of this device. However, the human body always sways while standing, measured values will also vary. In addition, because young children are not always able to fully understand the measurement procedure, many trials are needed to get stable measured values. It is necessary to examine the reliability of the measured values calculated by the above device. Because the contact area of the soles of the feet is the area supporting the body weight, foot pressure and sole shape are affected by the body weight. The amount of pressure exerted on the feet is greater for obese people than for people of a normal body weight (Hills et al., 2001) and, accordingly, sole shape (e.g. the prevalence of flat-footedness) differs between these two groups. Hence, variables related to foot pressure load balance may be affected by physique. If this is true, it will be nec essary 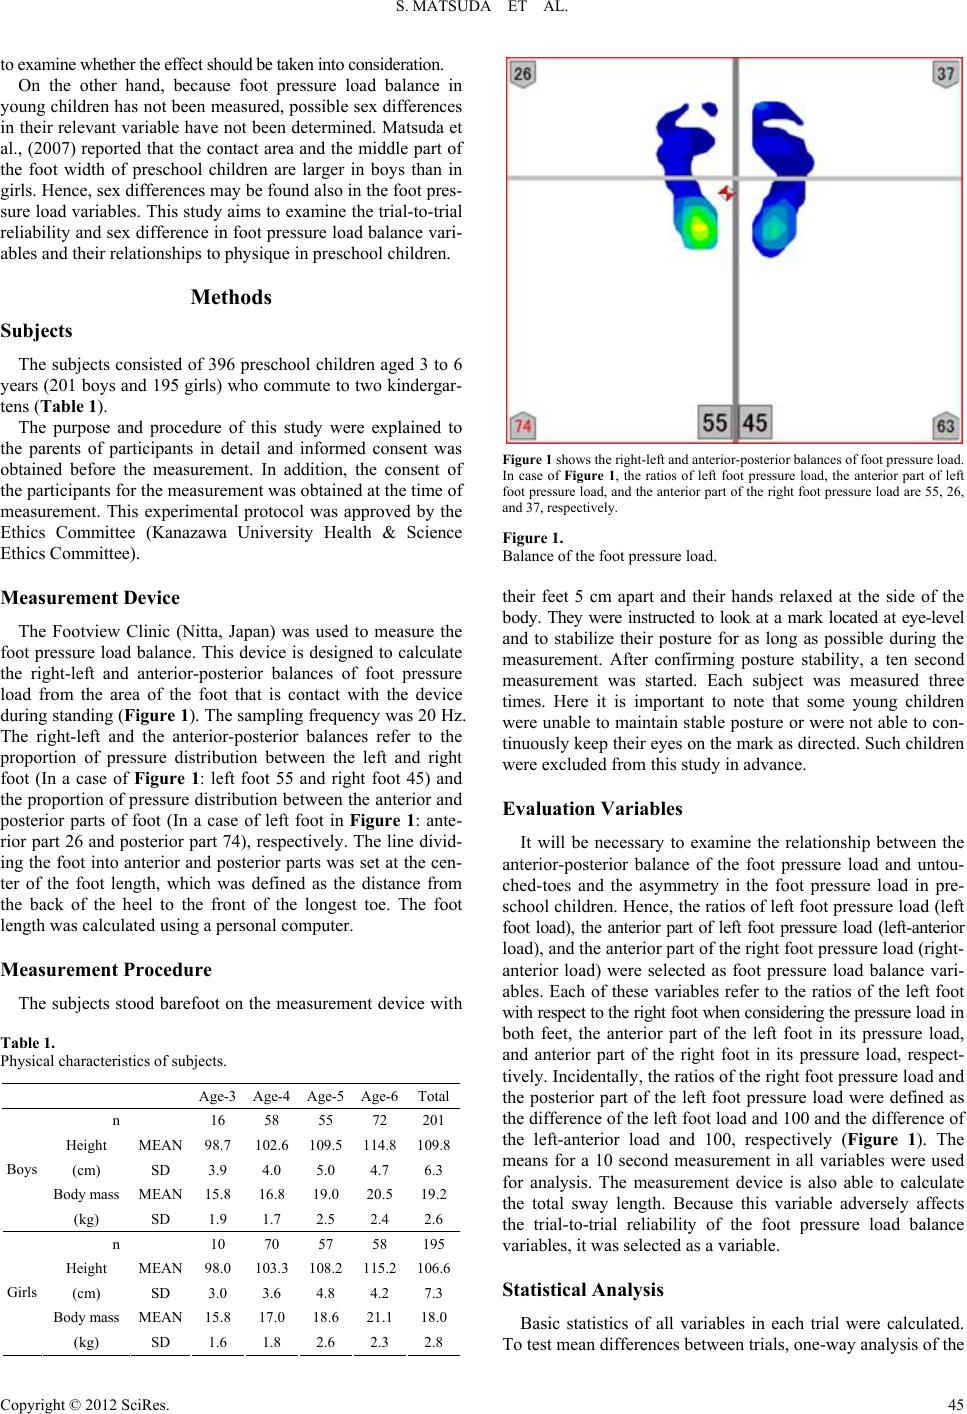 S. MATSUDA ET AL. to examine whether the effect should be taken into consideration. On the other hand, because foot pressure load balance in young children has not been measured, possible sex differences in their relevant variable have not been determined. Matsuda et al., (2007) reported that the contact area and the middle part of the foot width of preschool children are larger in boys than in girls. Hence, sex differences may be found also in the foot pres- sure load variables. This study aims to examine the trial-to-trial reliability and sex difference in foot pressure load balance vari- ables and their relationships to physique in preschool children. Methods Subjects The subjects consisted of 396 preschool children aged 3 to 6 years (201 boys and 195 girls) who commute to two kindergar- tens (Table 1). The purpose and procedure of this study were explained to the parents of participants in detail and informed consent was obtained before the measurement. In addition, the consent of the participants for the measurement was obtained at the time of measurement. This experimental protocol was approved by the Ethics Committee (Kanazawa University Health & Science Ethics Committee). Measurement Device The Footview Clinic (Nitta, Japan) was used to measure the foot pressure load balance. This device is designed to calculate the right-left and anterior-posterior balances of foot pressure load from the area of the foot that is contact with the device during standing (Figure 1). The sampling frequency was 20 Hz. The right-left and the anterior-posterior balances refer to the proportion of pressure distribution between the left and right foot (In a case of Figure 1: left foot 55 and right foot 45) and the proportion of pressure distribution between the anterior and posterior parts of foot (In a case of left foot in Figure 1: ante- rior part 26 and posterior part 74), respectively. The line divid- ing the foot into anterior and posterior parts was set at the cen- ter of the foot length, which was defined as the distance from the back of the heel to the front of the longest toe. The foot length was calculated using a personal computer. Measurement Procedure The subjects stood barefoot on the measurement device with Table 1. Physical characteristics of subjects. Age-3Age-4 Age-5 Age-6Total n 16 58 55 72 201 Height MEAN 98.7 102.6 109.5 114.8109.8 (cm) SD 3.9 4.0 5.0 4.7 6.3 Body mass MEAN 15.8 16.8 19.0 20.519.2 Boys (kg) SD 1.9 1.7 2.5 2.4 2.6 n 10 70 57 58 195 Height MEAN 98.0 103.3 108.2 115.2106.6 (cm) SD 3.0 3.6 4.8 4.2 7.3 Body mass MEAN 15.8 17.0 18.6 21.118.0 Girls (kg) SD 1.6 1.8 2.6 2.3 2.8 Figure 1 shows the right- left and anterior-posterior balances of foot press ure load. In case of Figure 1, the ratios of left foot pressure load, the anterior part of left foot pressure load , and the anterior p art of the right foot pressure load are 55, 26, and 37, respectively. Figure 1. Balance of the foot pressure load. their feet 5 cm apart and their hands relaxed at the side of the body. They were instructed to look at a mark located at eye-level and to stabilize their posture for as long as possible during the measurement. After confirming posture stability, a ten second measurement was started. Each subject was measured three times. Here it is important to note that some young children were unable to maintain stable posture or were not able to con- tinuously keep their eyes on the mark as directed. Such children were excluded from this study in advance. Evaluation Vari ables It will be necessary to examine the relationship between the anterior-posterior balance of the foot pressure load and untou- ched-toes and the asymmetry in the foot pressure load in pre- school children. Hence, the ratios of left foot pressure load (left foot load), the anterior part of left foot pressure load (left-anterior load), and the anterior part of the right foot pressure load (right- anterior load) were selected as foot pressure load balance vari- ables. Each of these variables refer to the ratios of the left foot with respect to the right foot when consi dering the pressure loa d i n both feet, the anterior part of the left foot in its pressure load, and anterior part of the right foot in its pressure load, respect- tively. Incidentally, the ratios of the right foot pressure load and the posterior part of the left foot pressure load were defined as the difference of the left foot load and 100 and the difference of the left-anterior load and 100, respectively (Figure 1). The means for a 10 second measurement in all variables were used for analysis. The measurement device is also able to calculate the total sway length. Because this variable adversely affects the trial-to-trial reliability of the foot pressure load balance variables, it was selected as a variable. Statistical Analysis Basic statistics of all variables in each trial were calculated. To test mean differences between trials, one-way analysis of the Copyright © 2012 SciRes. 45 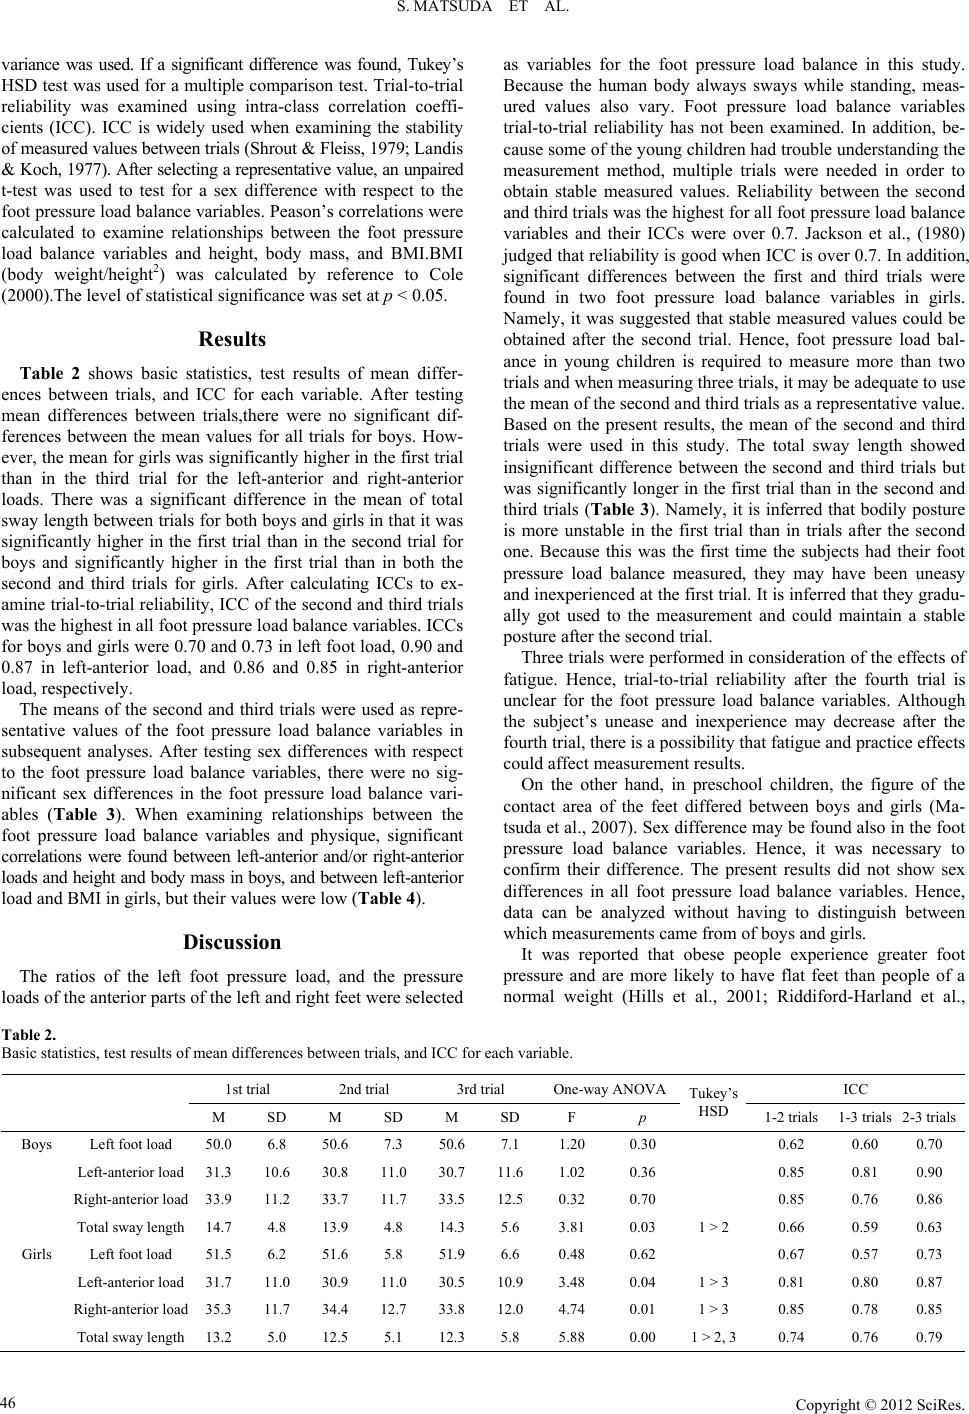 S. MATSUDA ET AL. Copyright © 2012 SciRes. 46 variance was used. If a significant difference was found, Tukey’s HSD test was used for a multiple comparison test. Trial-to-trial reliability was examined using intra-class correlation coeffi- cients (ICC). ICC is widely used when examining the stability of measured values between trials (Shrout & Fleiss, 1979; Landis & Koch, 197 7). After selectin g a representat ive value, an un paired t-test was used to test for a sex difference with respect to the foot pressure load balance variables. Peason’s correlations were calculated to examine relationships between the foot pressure load balance variables and height, body mass, and BMI.BMI (body weight/height2) was calculated by reference to Cole (2000).The level of statistical significance was set at p < 0.05. Results Table 2 shows basic statistics, test results of mean differ- ences between trials, and ICC for each variable. After testing mean differences between trials,there were no significant dif- ferences between the mean values for all trials for boys. How- ever, the mean for girls was significantly higher in the first trial than in the third trial for the left-anterior and right-anterior loads. There was a significant difference in the mean of total sway length between trials for both boys and girls in that it was significantly higher in the first trial than in the second trial for boys and significantly higher in the first trial than in both the second and third trials for girls. After calculating ICCs to ex- amine trial-to-trial reliability, ICC of the second and third trials was the highest in all foot pressure load balance variables. ICCs for boys and girls were 0.70 and 0.73 in left foot load, 0.90 and 0.87 in left-anterior load, and 0.86 and 0.85 in right-anterior load, respectively. The means of the second and third trials were used as repre- sentative values of the foot pressure load balance variables in subsequent analyses. After testing sex differences with respect to the foot pressure load balance variables, there were no sig- nificant sex differences in the foot pressure load balance vari- ables (Table 3). When examining relationships between the foot pressure load balance variables and physique, significant correlations were found between left-anterior and/or right-anterior loads a nd height and b ody mass in boy s, and between le ft-anterio r load and BMI in girls, but their values were low (Table 4). Discussion The ratios of the left foot pressure load, and the pressure loads of the anterior parts of the left and right feet were selected as variables for the foot pressure load balance in this study. Because the human body always sways while standing, meas- ured values also vary. Foot pressure load balance variables trial-to-trial reliability has not been examined. In addition, be- cause some of the young children had trouble understanding the measurement method, multiple trials were needed in order to obtain stable measured values. Reliability between the second and third trials was the highest for all foot pressure load balance variables and their ICCs were over 0.7. Jackson et al., (1980) judged that reliability is good when ICC is over 0.7. In addition, significant differences between the first and third trials were found in two foot pressure load balance variables in girls. Namely, it was suggested that stable measured values could be obtained after the second trial. Hence, foot pressure load bal- ance in young children is required to measure more than two trials and when measuring three trials, it may be adequate to use the mean of the second and third trials as a representative value. Based on the present results, the mean of the second and third trials were used in this study. The total sway length showed insignificant difference between the second and third trials but was significantly longer in the first trial than in the second and third trials (Table 3). Namely, it is inferred that bodily posture is more unstable in the first trial than in trials after the second one. Because this was the first time the subjects had their foot pressure load balance measured, they may have been uneasy and inexperienced at the first trial. It is inferred that they gradu- ally got used to the measurement and could maintain a stable posture after the second trial. Three trials were performed in consideration of the effects of fatigue. Hence, trial-to-trial reliability after the fourth trial is unclear for the foot pressure load balance variables. Although the subject’s unease and inexperience may decrease after the fourth trial, there is a possibility that fatigue and practice effects could affect measurement results. On the other hand, in preschool children, the figure of the contact area of the feet differed between boys and girls (Ma- tsuda et al., 2007). Sex difference may be found also in the foot pressure load balance variables. Hence, it was necessary to confirm their difference. The present results did not show sex differences in all foot pressure load balance variables. Hence, data can be analyzed without having to distinguish between which measurements came from of boys and girls. It was reported that obese people experience greater foot pressure and are more likely to have flat feet than people of a normal weight (Hills et al., 2001; Riddiford-Harland et al., Table 2. Basic statistics, test results of mean differences between trials, and ICC for each variable. 1st trial 2nd trial 3rd trial One-way ANOVAICC M SD M SD M SD F p Tukey’s HSD 1-2 trials 1-3 trials2-3 trials Boys Left foot load 50.0 6.8 50.6 7.3 50.6 7.1 1.20 0.30 0.62 0.60 0.70 Left-anterior load 31.3 10.6 30.8 11.0 30.7 11.6 1.02 0.36 0.85 0.81 0.90 Right-anterior load 33.9 11.2 33.7 11.7 33.5 12.5 0.32 0.70 0.85 0.76 0.86 Total sway length 14.7 4.8 13.9 4.8 14.3 5.6 3.81 0.03 1 > 2 0.66 0.59 0. 63 Girls Left foot load 51.5 6.2 51.6 5.8 51.9 6.6 0.48 0.62 0.67 0.57 0.73 Left-anterior load 31.7 11.0 30.9 11.0 30.5 10.9 3.48 0.04 1 > 3 0.81 0.80 0.87 Right-anterior load 35.3 11.7 34.4 12.7 33.8 12.0 4.74 0.01 1 > 3 0.85 0.78 0.85 Total sway length 13.2 5.0 12.5 5.1 12.3 5.8 5.88 0.00 1 > 2, 3 0.74 0.76 0.79 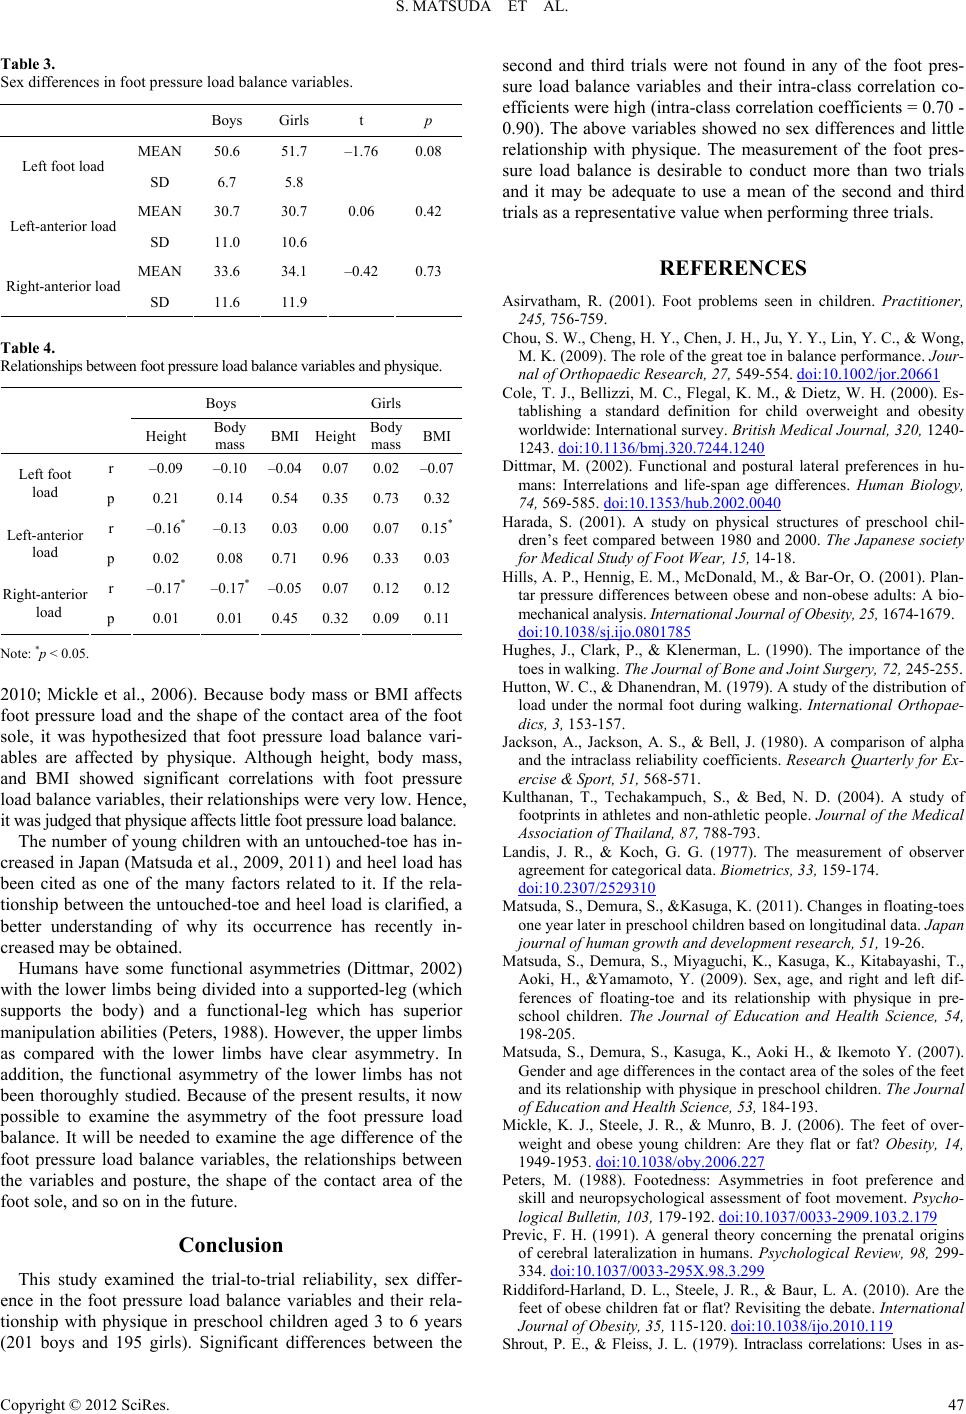 S. MATSUDA ET AL. Table 3. Sex differences in foot pressure load balance va riables. Boys Girls t p MEAN 50.6 51.7 –1.76 0.08 Left foot load SD 6.7 5.8 MEAN 30.7 30.7 0.06 0.42 Left-anterior load SD 11.0 10.6 MEAN 33.6 34.1 –0.42 0.73 Right-anterior load SD 11.6 11.9 Table 4. Relationships be tween foot pre ssure load bala nce variables and p hysique. Boys Girls Height Body mass BMI Height Body mass BMI r –0.09 –0.10–0.04 0.07 0.02–0.07 Left foot load p 0.21 0.14 0.54 0.35 0.730.32 r –0.16* –0.130.03 0.00 0.070.15* Left-anterior load p 0.02 0.08 0.71 0.96 0.330.03 r –0.17* –0.17*–0.05 0.07 0.120.12 Right-anterior load p 0.01 0.01 0.45 0.32 0.090.11 Note: *p < 0.05. 2010; Mickle et al., 2006). Because body mass or BMI affects foot pressure load and the shape of the contact area of the foot sole, it was hypothesized that foot pressure load balance vari- ables are affected by physique. Although height, body mass, and BMI showed significant correlations with foot pressure load balance variables, their relationships were very low. Hence, it was judged that physique affects little foot pressure load balance. The number of young children with an untouched-toe has in- creased in Japan (Matsuda et al., 2009, 2011) and heel load has been cited as one of the many factors related to it. If the rela- tionship between the untouched-toe and heel load is clarified, a better understanding of why its occurrence has recently in- creased may be obtained. Humans have some functional asymmetries (Dittmar, 2002) with the lower limbs being divided into a supported-leg (which supports the body) and a functional-leg which has superior manipulation abilities (Peters, 1988). However, the upper limbs as compared with the lower limbs have clear asymmetry. In addition, the functional asymmetry of the lower limbs has not been thoroughly studied. Because of the present results, it now possible to examine the asymmetry of the foot pressure load balance. It will be needed to examine the age difference of the foot pressure load balance variables, the relationships between the variables and posture, the shape of the contact area of the foot sole, and so on in the future. Conclusion This study examined the trial-to-trial reliability, sex differ- ence in the foot pressure load balance variables and their rela- tionship with physique in preschool children aged 3 to 6 years (201 boys and 195 girls). Significant differences between the second and third trials were not found in any of the foot pres- sure load balance variables and their intra-class correlation co- efficients were high (intra-class correlation coefficients = 0.70 - 0.90). The above variables showed no sex differences and little relationship with physique. The measurement of the foot pres- sure load balance is desirable to conduct more than two trials and it may be adequate to use a mean of the second and third trials as a representative value when performing three trials. REFERENCES Asirvatham, R. (2001). Foot problems seen in children. Practitioner, 245, 756-759. Chou, S. W., Cheng, H. Y., Chen, J. H., Ju, Y. Y., Lin, Y. C., & Wong, M. K. (2009). The role of the great toe in balance performance. Jour- nal of Orthopaedic Re se a rc h, 27, 549-554. doi:10.1002/jor.20661 Cole, T. J., Bellizzi, M. C., Flegal, K. M., & Dietz, W. H. (2000). Es- tablishing a standard definition for child overweight and obesity worldwide: International survey. British Medical Journal, 320, 1240- 1243. doi:10.1136/bmj.320.7244.1240 Dittmar, M. (2002). Functional and postural lateral preferences in hu- mans: Interrelations and life-span age differences. Human Biology, 74, 569-585. doi:10.1353/hub.2002.0040 Harada, S. (2001). A study on physical structures of preschool chil- dren’s feet compared between 1980 and 2000. The Japanese society for Medical Study of Foot We ar , 15 , 14-18. Hills, A. P., Hennig, E. M., McDonald , M., & Bar-Or, O. (2001). Plan- tar pressure differences between obese and non-obese adults: A bio- mechanical analysis. International Journal of Obesity, 25, 1674-1679. doi:10.1038/sj.ijo.0801785 Hughes, J., Clark, P., & Klenerman, L. (1990). The importance of the toes in walking. The Journal of Bone and Join t S urgery, 72, 245-255. Hutton, W. C., & Dhanendran, M. (1979). A study of the distribution of load under the normal foot during walking. International Orthopae- dics, 3, 153-157. Jackson, A., Jackson, A. S., & Bell, J. (1980). A comparison of alpha and the intraclass reliability coefficients. Research Quarterly for Ex- ercise & Sport, 51, 568-571. Kulthanan, T., Techakampuch, S., & Bed, N. D. (2004). A study of footprints in athletes and non-athletic people. Journal of the Medical Association of Thailand, 87, 788-793. Landis, J. R., & Koch, G. G. (1977). The measurement of observer agreement for categorical data. Biometrics, 33 , 159-174. doi:10.2307/2529310 Matsuda, S., Demura, S., &Kasuga, K. (2011). Changes in floating-toes one year later in preschool c hild ren based on longitudina l d at a . Japan journal of human growth and development research, 51, 19-26. Matsuda, S., Demura, S., Miyaguchi, K., Kasuga, K., Kitabayashi, T., Aoki, H., &Yamamoto, Y. (2009). Sex, age, and right and left dif- ferences of floating-toe and its relationship with physique in pre- school children. The Journal of Education and Health Science, 54, 198-205. Matsuda, S., Demura, S., Kasuga, K., Aoki H., & Ikemoto Y. (2007). Gender and age differences in the contact area of the soles of the feet and its relationship with physique in preschool children. The Journal of Education and Health Sci en c e , 53, 184-193. Mickle, K. J., Steele, J. R., & Munro, B. J. (2006). The feet of over- weight and obese young children: Are they flat or fat? Obesity, 14, 1949-1953. doi:10.1038/oby.2006.227 Peters, M. (1988). Footedness: Asymmetries in foot preference and skill and neuropsychological assessment of foot movement. Psycho- logical Bulletin, 103, 179-192. doi:10.1037/0033-2909.103.2.179 Previc, F. H. (1991). A general theory concerning the prenatal origins of cerebral lateralization in humans. Psychological Review, 98, 299- 334. doi:10.1037/0033-295X.98.3.299 Riddiford-Harland, D. L., Steele, J. R., & Baur, L. A. (2010). Are the feet of obese children fat or flat? Revisiting the debate. International Journal of Obesity, 3 5 , 115-120. doi:10.1038/ijo.2010.119 Shrout, P. E., & Fleiss, J. L. (1979). Intraclass correlations: Uses in as- Copyright © 2012 SciRes. 47  S. MATSUDA ET AL. sessing rater reliability. Psychologi cal Bulletin, 86, 420-428. doi:10.1037/0033-2909.86.2.420 Tanaka, T., Hashimoto, N., Nakata, M., Ito, T., Ino, S., & Ifukube, T. (1996). Analysis of toe pressures under the foot while dynamic standing on one foot in healthy subjects. Journal of Orthopaedic & Sports Physical Therapy, 23, 188-193. Wenger, D. R., & Leach, J. (1986). Foot deformities in infants and children. Pediatric Clinics of No rt h America, 33, 1411-1427. Copyright © 2012 SciRes. 48 |