

Paper Menu >>
Journal Menu >>
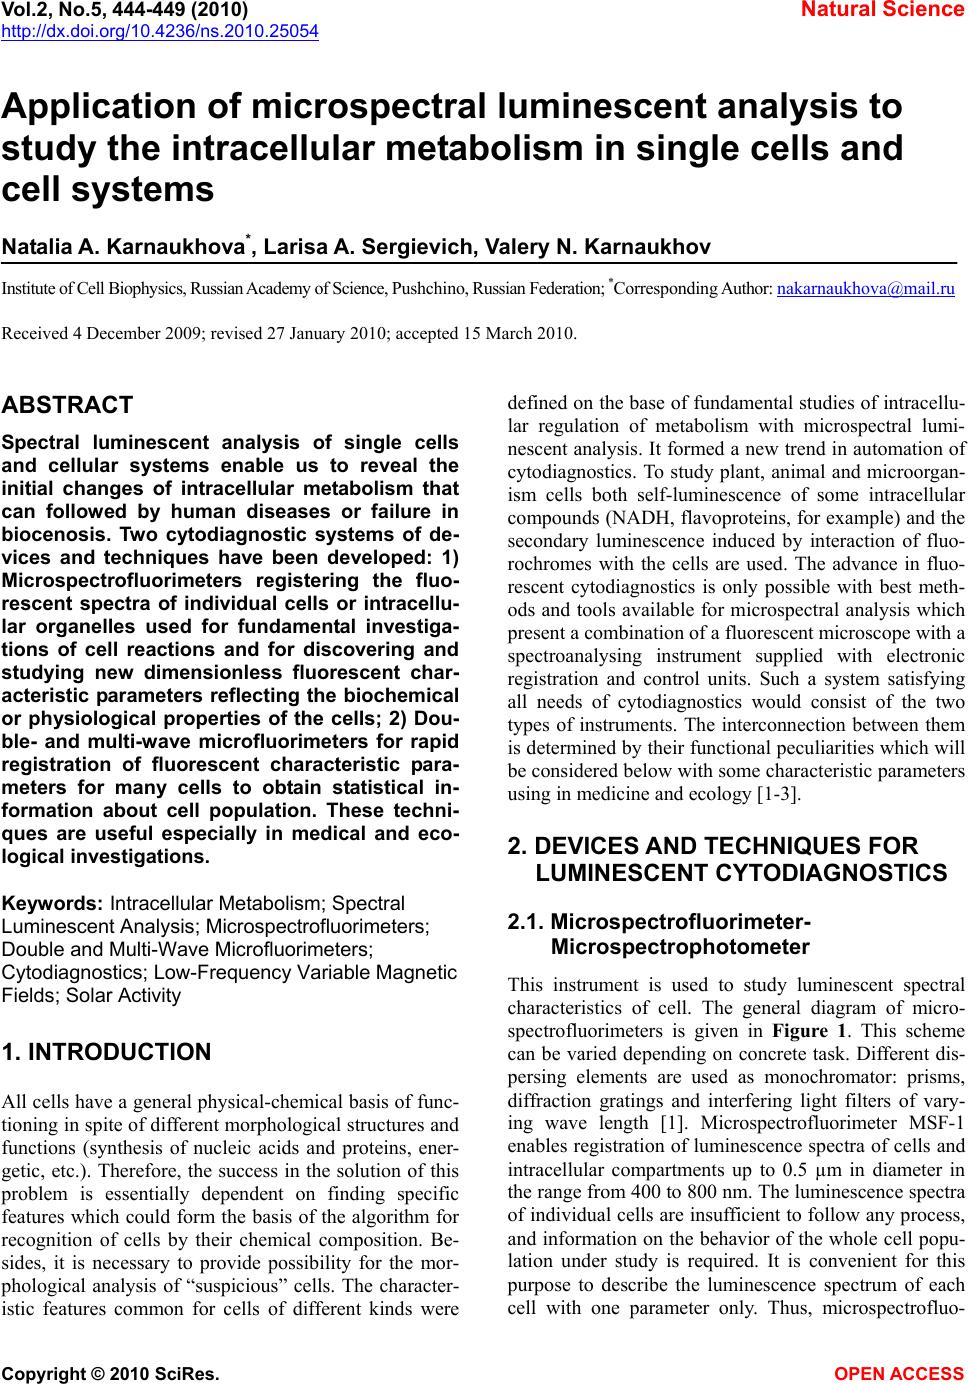 Vol.2, No.5, 444-449 (2010) Natural Science http://dx.doi.org/10.4236/ns.2010.25054 Copyright © 2010 SciRes. OPEN ACCESS Application of microspectral luminescent analysis to study the intracellular metabolism in single cells and cell systems Natalia A. Karnaukhova*, Larisa A. Sergievich, Valery N. Karnaukhov Institute of Cell Biophysics, Russian Academy of Science, Pushchino, Russian Federation; *Corresponding Author: [email protected] Received 4 December 2009; revised 27 January 2010; accepted 15 March 2010. ABSTRACT Spectral luminescent analysis of single cells and cellular systems enable us to reveal the initial changes of intracellular metabolism that can followed by human diseases or failure in biocenosis. Two cytodiagnostic systems of de- vices and techniques have been developed: 1) Microspectrofluorimeters registering the fluo- rescent spectra of individual cells or intracellu- lar organelles used for fundamental investiga- tions of cell reactions and for discovering and studying new dimensionless fluorescent char- acteristic parameters reflecting the biochemical or physiological properties of the cells; 2) Dou- ble- and multi-wave microfluorimeters for rapid registration of fluorescent characteristic para- meters for many cells to obtain statistical in- formation about cell population. These techni- ques are useful especially in medical and eco- logical investigations. Keywords: Intracellular Metabolism; Spectral Luminescent Analysis; Microspectrofluorimeters; Double and Multi-Wave Microfluorimeters; Cytodiagnostics; Low-Frequency Variable Magnetic Fields; Solar Activity 1. INTRODUCTION All cells have a general physical-chemical basis of func- tioning in spite of different morphological structures and functions (synthesis of nucleic acids and proteins, ener- getic, etc.). Therefore, the success in the solution of this problem is essentially dependent on finding specific features which could form the basis of the algorithm for recognition of cells by their chemical composition. Be- sides, it is necessary to provide possibility for the mor- phological analysis of “suspicious” cells. The character- istic features common for cells of different kinds were defined on the base of fundamental studies of intracellu- lar regulation of metabolism with microspectral lumi- nescent analysis. It formed a new trend in automation of cytodiagnostics. To study plant, animal and microorgan- ism cells both self-luminescence of some intracellular compounds (NADH, flavoproteins, for example) and the secondary luminescence induced by interaction of fluo- rochromes with the cells are used. The advance in fluo- rescent cytodiagnostics is only possible with best meth- ods and tools available for microspectral analysis which present a combination of a fluorescent microscope with a spectroanalysing instrument supplied with electronic registration and control units. Such a system satisfying all needs of cytodiagnostics would consist of the two types of instruments. The interconnection between them is determined by their functional peculiarities which will be considered below with some characteristic parameters using in medicine and ecology [1-3]. 2. DEVICES AND TECHNIQUES FOR LUMINESCENT CYTODIAGNOSTICS 2.1. Microspectrofluorimeter- Microspectrophotometer This instrument is used to study luminescent spectral characteristics of cell. The general diagram of micro- spectrofluorimeters is given in Figure 1. This scheme can be varied depending on concrete task. Different dis- persing elements are used as monochromator: prisms, diffraction gratings and interfering light filters of vary- ing wave length [1]. Microspectrofluorimeter MSF-1 enables registration of luminescence spectra of cells and intracellular compartments up to 0.5 µm in diameter in the range from 400 to 800 nm. The luminescence spectra of individual cells are insufficient to follow any process, and information on the behavior of the whole cell popu- lation under study is required. It is convenient for this purpose to describe the luminescence spectrum of each cell with one parameter only. Thus, microspectrofluo- 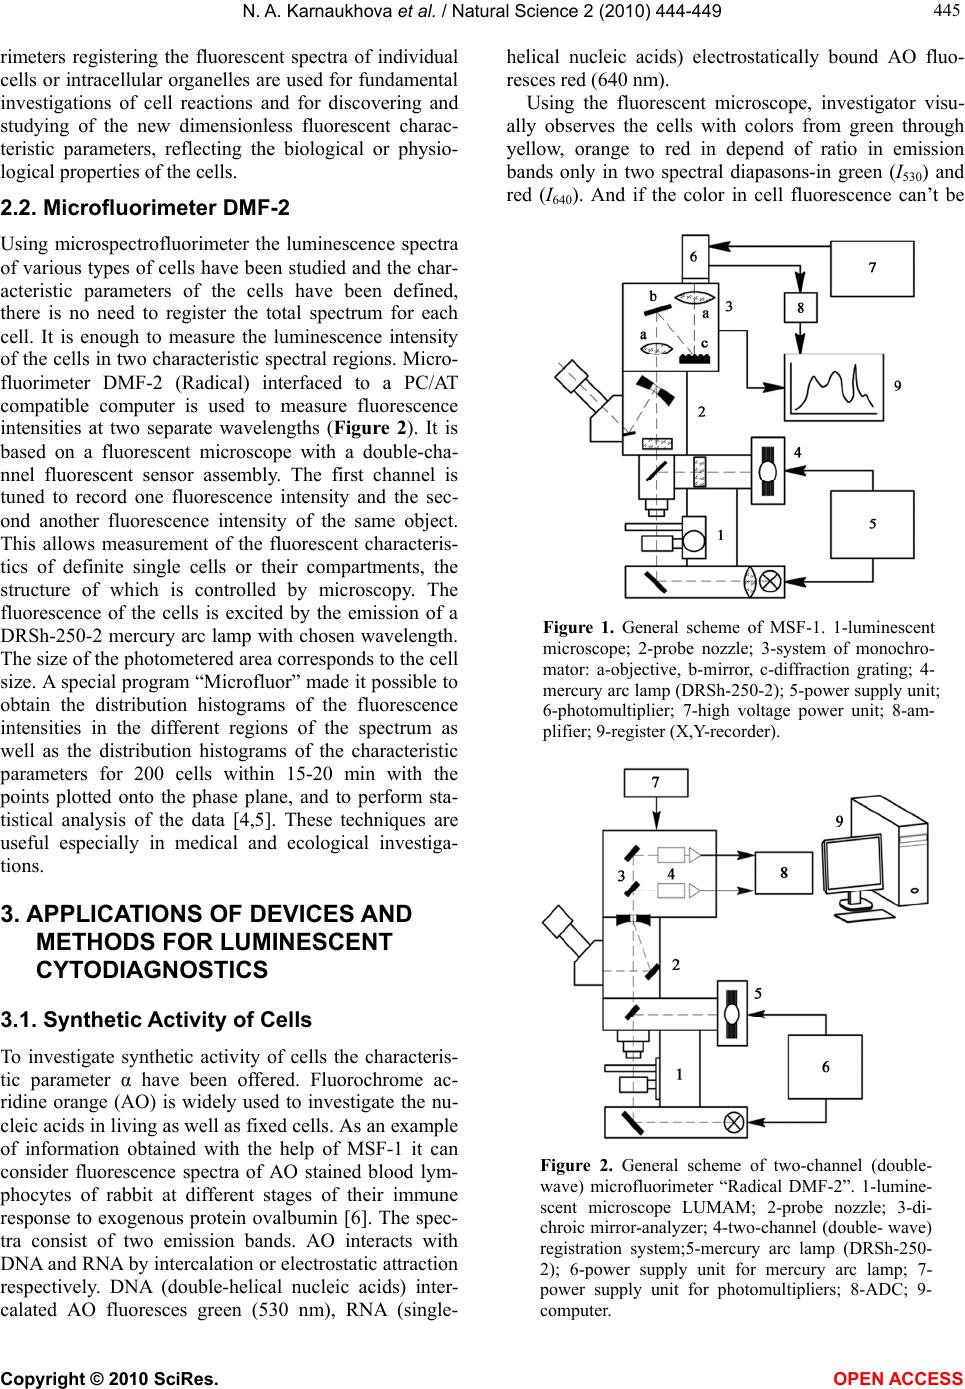 N. A. Karnaukhova et al. / Natural Science 2 (2010) 444-449 Copyright © 2010 SciRes. OPEN ACCESS 445 445 rimeters registering the fluorescent spectra of individual cells or intracellular organelles are used for fundamental investigations of cell reactions and for discovering and studying of the new dimensionless fluorescent charac- teristic parameters, reflecting the biological or physio- logical properties of the cells. 2.2. Microfluorimeter DMF-2 Using microspectrofluorimeter the luminescence spectra of various types of cells have been studied and the char- acteristic parameters of the cells have been defined, there is no need to register the total spectrum for each cell. It is enough to measure the luminescence intensity of the cells in two characteristic spectral regions. Micro- fluorimeter DMF-2 (Radical) interfaced to a PC/AT compatible computer is used to measure fluorescence intensities at two separate wavelengths (Figure 2). It is based on a fluorescent microscope with a double-cha- nnel fluorescent sensor assembly. The first channel is tuned to record one fluorescence intensity and the sec- ond another fluorescence intensity of the same object. This allows measurement of the fluorescent characteris- tics of definite single cells or their compartments, the structure of which is controlled by microscopy. The fluorescence of the cells is excited by the emission of a DRSh-250-2 mercury arc lamp with chosen wavelength. The size of the photometered area corresponds to the cell size. A special program “Microfluor” made it possible to obtain the distribution histograms of the fluorescence intensities in the different regions of the spectrum as well as the distribution histograms of the characteristic parameters for 200 cells within 15-20 min with the points plotted onto the phase plane, and to perform sta- tistical analysis of the data [4,5]. These techniques are useful especially in medical and ecological investiga- tions. 3. APPLICATIONS OF DEVICES AND METHODS FOR LUMINESCENT CYTODIAGNOSTICS 3.1. Synthetic Activity of Cells To investigate synthetic activity of cells the characteris- tic parameter α have been offered. Fluorochrome ac- ridine orange (AO) is widely used to investigate the nu- cleic acids in living as well as fixed cells. As an example of information obtained with the help of MSF-1 it can consider fluorescence spectra of AO stained blood lym- phocytes of rabbit at different stages of their immune response to exogenous protein ovalbumin [6]. The spec- tra consist of two emission bands. AO interacts with DNA and RNA by intercalation or electrostatic attraction respectively. DNA (double-helical nucleic acids) inter- calated AO fluoresces green (530 nm), RNA (single- helical nucleic acids) electrostatically bound AO fluo- resces red (640 nm). Using the fluorescent microscope, investigator visu- ally observes the cells with colors from green through yellow, orange to red in depend of ratio in emission bands only in two spectral diapasons-in green (I530) and red (I640). And if the color in cell fluorescence can’t be Figure 1. General scheme of MSF-1. 1-luminescent microscope; 2-probe nozzle; 3-system of monochro- mator: a-objective, b-mirror, c-diffraction grating; 4- mercury arc lamp (DRSh-250-2); 5-power supply unit; 6-photomultiplier; 7-high voltage power unit; 8-am- plifier; 9-register (X,Y-recorder). Figure 2. General scheme of two-channel (double- wave) microfluorimeter “Radical DMF-2”. 1-lumine- scent microscope LUMAM; 2-probe nozzle; 3-di- chroic mirror-analyzer; 4-two-channel (double- wave) registration system;5-mercury arc lamp (DRSh-250- 2); 6-power supply unit for mercury arc lamp; 7- power supply unit for photomultipliers; 8-ADC; 9- computer. 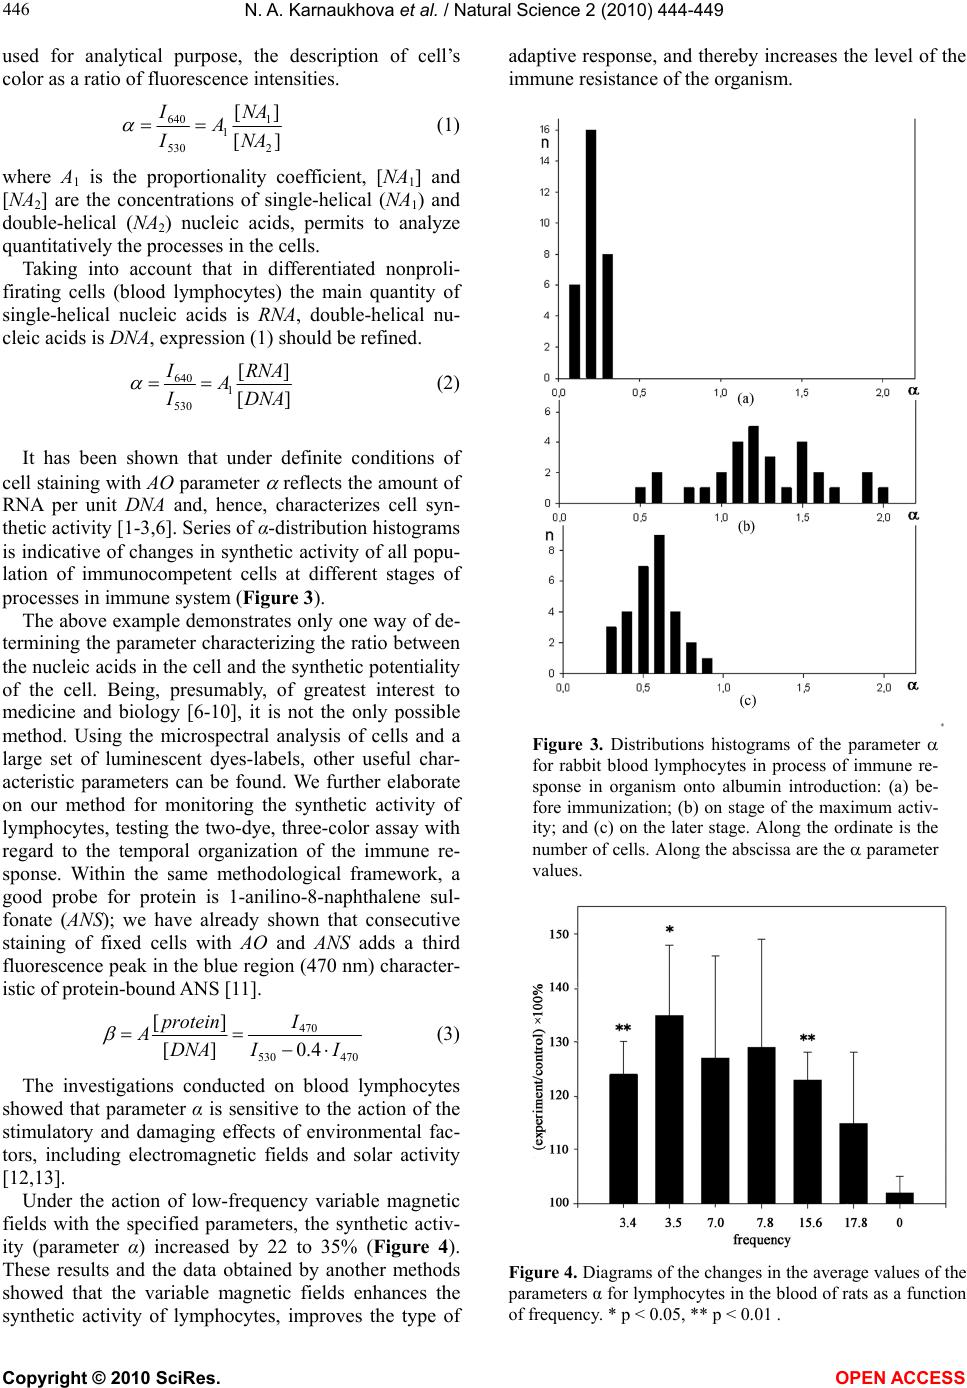 N. A. Karnaukhova et al. / Natural Science 2 (2010) 444-449 Copyright © 2010 SciRes. OPEN ACCESS 446 used for analytical purpose, the description of cell’s color as a ratio of fluorescence intensities. ][ ][ 2 1 1 530 640 NA NA A I I (1) where А1 is the proportionality coefficient, [NA1] and [NA2] are the concentrations of single-helical (NA1) and double-helical (NA2) nucleic acids, permits to analyze quantitatively the processes in the cells. Taking into account that in differentiated nonproli- firating cells (blood lymphocytes) the main quantity of single-helical nucleic acids is RNA, double-helical nu- cleic acids is DNA, expression (1) should be refined. ][ ][ 1 530 640 DNA RNA A I I (2) It has been shown that under definite conditions of cell staining with AO parameter reflects the amount of RNA per unit DNA and, hence, characterizes cell syn- thetic activity [1-3,6]. Series of α-distribution histograms is indicative of changes in synthetic activity of all popu- lation of immunocompetent cells at different stages of processes in immune system (Figure 3). The above example demonstrates only one way of de- termining the parameter characterizing the ratio between the nucleic acids in the cell and the synthetic potentiality of the cell. Being, presumably, of greatest interest to medicine and biology [6-10], it is not the only possible method. Using the microspectral analysis of cells and a large set of luminescent dyes-labels, other useful char- acteristic parameters can be found. We further elaborate on our method for monitoring the synthetic activity of lymphocytes, testing the two-dye, three-color assay with regard to the temporal organization of the immune re- sponse. Within the same methodological framework, a good probe for protein is 1-anilino-8-naphthalene sul- fonate (ANS); we have already shown that consecutive staining of fixed cells with AO and ANS adds a third fluorescence peak in the blue region (470 nm) character- istic of protein-bound ANS [11]. 470530 470 4.0][ ][ II I DNA protein A (3) The investigations conducted on blood lymphocytes showed that parameter α is sensitive to the action of the stimulatory and damaging effects of environmental fac- tors, including electromagnetic fields and solar activity [12,13]. Under the action of low-frequency variable magnetic fields with the specified parameters, the synthetic activ- ity (parameter α) increased by 22 to 35% (Figure 4). These results and the data obtained by another methods showed that the variable magnetic fields enhances the synthetic activity of lymphocytes, improves the type of adaptive response, and thereby increases the level of the immune resistance of the organism. Figure 3. Distributions histograms of the parameter for rabbit blood lymphocytes in process of immune re- sponse in organism onto albumin introduction: (а) be- fore immunization; (b) on stage of the maximum activ- ity; and (c) on the later stage. Along the ordinate is the number of cells. Along the abscissa are the parameter values. Figure 4. Diagrams of the changes in the average values of the parameters α for lymphocytes in the blood of rats as a function of frequency. * p < 0.05, ** p < 0.01 . 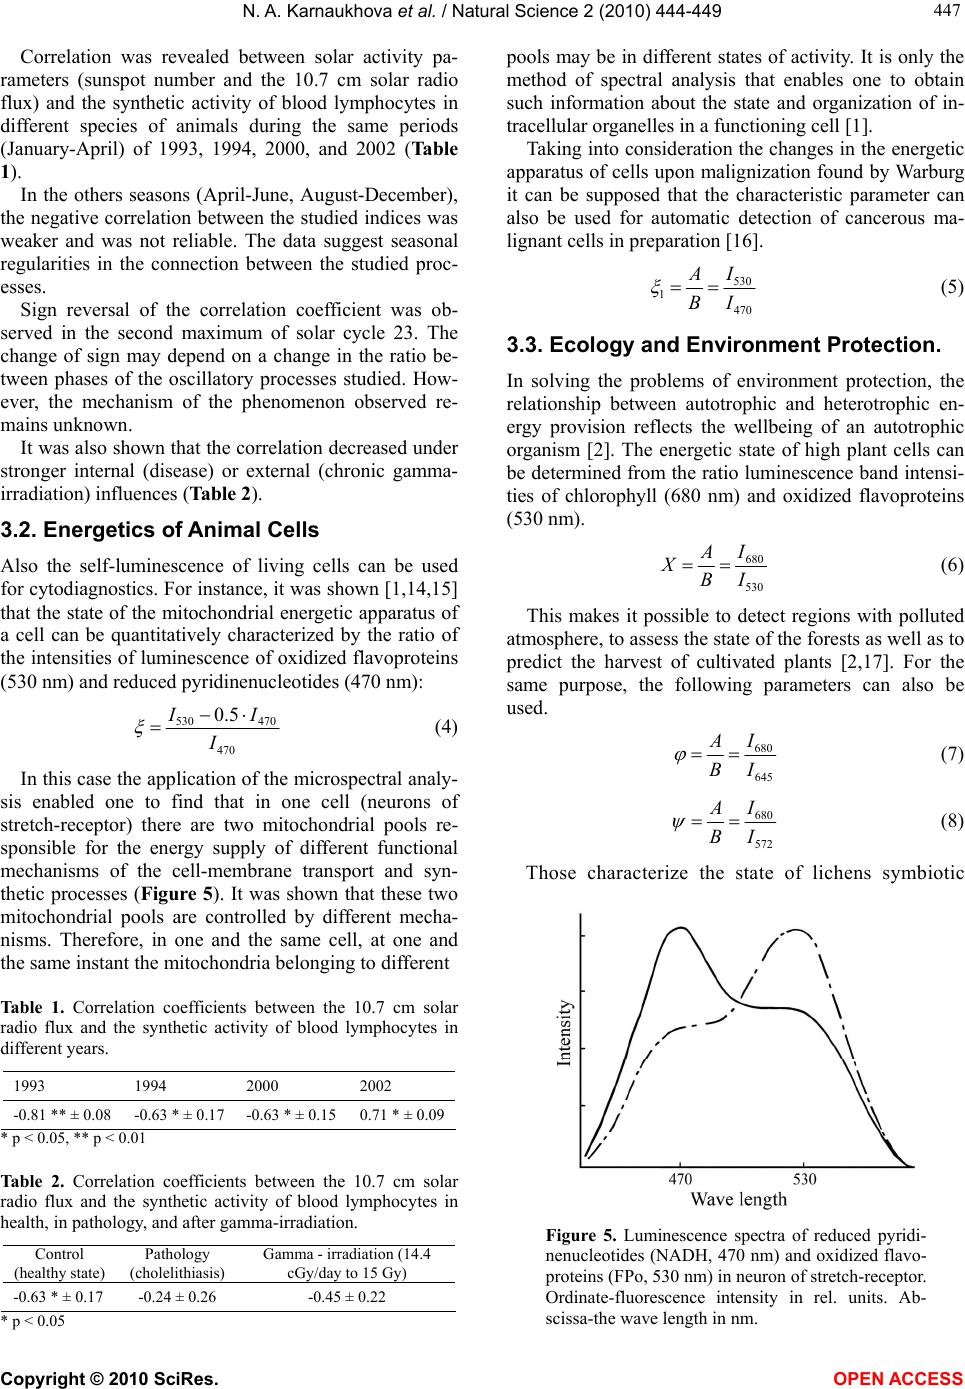 N. A. Karnaukhova et al. / Natural Science 2 (2010) 444-449 Copyright © 2010 SciRes. OPEN ACCESS 447 447 Correlation was revealed between solar activity pa- rameters (sunspot number and the 10.7 cm solar radio flux) and the synthetic activity of blood lymphocytes in different species of animals during the same periods (January-April) of 1993, 1994, 2000, and 2002 (Table 1). In the others seasons (April-June, August-December), the negative correlation between the studied indices was weaker and was not reliable. The data suggest seasonal regularities in the connection between the studied proc- esses. Sign reversal of the correlation coefficient was ob- served in the second maximum of solar cycle 23. The change of sign may depend on a change in the ratio be- tween phases of the oscillatory processes studied. How- ever, the mechanism of the phenomenon observed re- mains unknown. It was also shown that the correlation decreased under stronger internal (disease) or external (chronic gamma- irradiation) influences (Table 2). 3.2. Energetics of Animal Cells Also the self-luminescence of living cells can be used for cytodiagnostics. For instance, it was shown [1,14,15] that the state of the mitochondrial energetic apparatus of a cell can be quantitatively characterized by the ratio of the intensities of luminescence of oxidized flavoproteins (530 nm) and reduced pyridinenucleotides (470 nm): 470 470530 5.0 I II (4) In this case the application of the microspectral analy- sis enabled one to find that in one cell (neurons of stretch-receptor) there are two mitochondrial pools re- sponsible for the energy supply of different functional mechanisms of the cell-membrane transport and syn- thetic processes (Figure 5). It was shown that these two mitochondrial pools are controlled by different mecha- nisms. Therefore, in one and the same cell, at one and the same instant the mitochondria belonging to different Table 1. Correlation coefficients between the 10.7 cm solar radio flux and the synthetic activity of blood lymphocytes in different years. 1993 1994 2000 2002 -0.81 ** ± 0.08 -0.63 * ± 0.17 -0.63 * ± 0.15 0.71 * ± 0.09 * p < 0.05, ** p < 0.01 Table 2. Correlation coefficients between the 10.7 cm solar radio flux and the synthetic activity of blood lymphocytes in health, in pathology, and after gamma-irradiation. Control (healthy state) Pathology (cholelithiasis) Gamma - irradiation (14.4 cGy/day to 15 Gy) -0.63 * ± 0.17 -0.24 ± 0.26 -0.45 ± 0.22 * p < 0.05 pools may be in different states of activity. It is only the method of spectral analysis that enables one to obtain such information about the state and organization of in- tracellular organelles in a functioning cell [1]. Taking into consideration the changes in the energetic apparatus of cells upon malignization found by Warburg it can be supposed that the characteristic parameter can also be used for automatic detection of cancerous ma- lignant cells in preparation [16]. 470 530 1I I B A (5) 3.3. Ecology and Environment Protection. In solving the problems of environment protection, the relationship between autotrophic and heterotrophic en- ergy provision reflects the wellbeing of an autotrophic organism [2]. The energetic state of high plant cells can be determined from the ratio luminescence band intensi- ties of chlorophyll (680 nm) and oxidized flavoproteins (530 nm). 530 680 I I B A X (6) This makes it possible to detect regions with polluted atmosphere, to assess the state of the forests as well as to predict the harvest of cultivated plants [2,17]. For the same purpose, the following parameters can also be used. 645 680 I I B A (7) 572 680 I I B A (8) Those characterize the state of lichens symbiotic Figure 5. Luminescence spectra of reduced pyridi- nenucleotides (NADH, 470 nm) and oxidized flavo- proteins (FPo, 530 nm) in neuron of stretch-receptor. Ordinate-fluorescence intensity in rel. units. Ab- scissa-the wave length in nm. 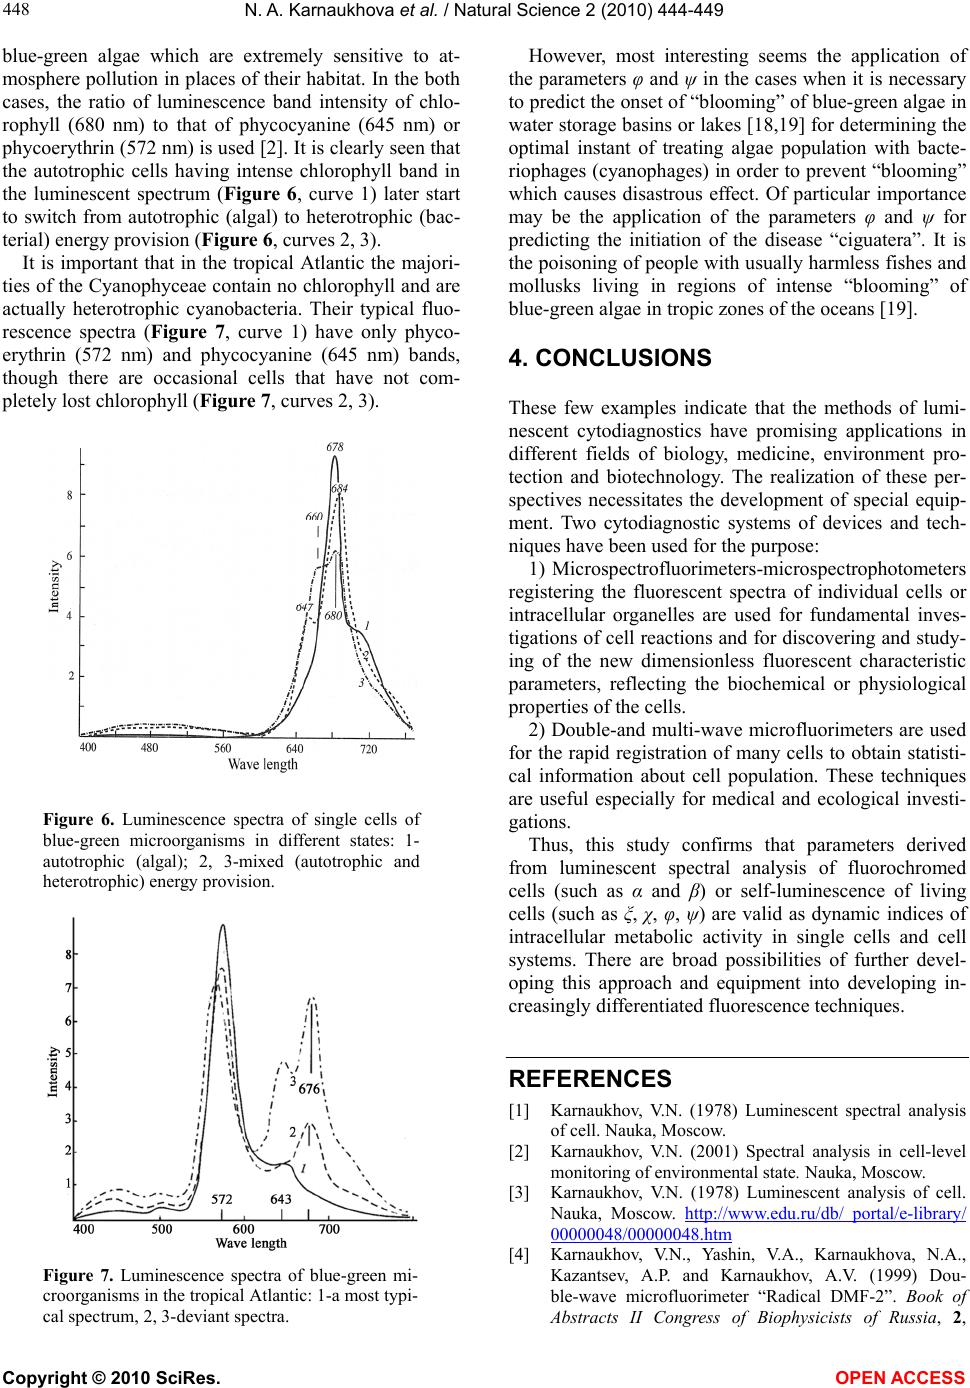 N. A. Karnaukhova et al. / Natural Science 2 (2010) 444-449 Copyright © 2010 SciRes. OPEN ACCESS 448 blue-green algae which are extremely sensitive to at- mosphere pollution in places of their habitat. In the both cases, the ratio of luminescence band intensity of chlo- rophyll (680 nm) to that of phycocyanine (645 nm) or phycoerythrin (572 nm) is used [2]. It is clearly seen that the autotrophic cells having intense chlorophyll band in the luminescent spectrum (Figure 6, curve 1) later start to switch from autotrophic (algal) to heterotrophic (bac- terial) energy provision (Figure 6, curves 2, 3). It is important that in the tropical Atlantic the majori- ties of the Cyanophyceae contain no chlorophyll and are actually heterotrophic cyanobacteria. Their typical fluo- rescence spectra (Figure 7, curve 1) have only phyco- erythrin (572 nm) and phycocyanine (645 nm) bands, though there are occasional cells that have not com- pletely lost chlorophyll (Figure 7, curves 2, 3). Figure 6. Luminescence spectra of single cells of blue-green microorganisms in different states: 1- autotrophic (algal); 2, 3-mixed (autotrophic and heterotrophic) energy provision. Figure 7. Luminescence spectra of blue-green mi- croorganisms in the tropical Atlantic: 1-a most typi- cal spectrum, 2, 3-deviant spectra. However, most interesting seems the application of the parameters φ and ψ in the cases when it is necessary to predict the onset of “blooming” of blue-green algae in water storage basins or lakes [18,19] for determining the optimal instant of treating algae population with bacte- riophages (cyanophages) in order to prevent “blooming” which causes disastrous effect. Of particular importance may be the application of the parameters φ and ψ for predicting the initiation of the disease “ciguatera”. It is the poisoning of people with usually harmless fishes and mollusks living in regions of intense “blooming” of blue-green algae in tropic zones of the oceans [19]. 4. CONCLUSIONS These few examples indicate that the methods of lumi- nescent cytodiagnostics have promising applications in different fields of biology, medicine, environment pro- tection and biotechnology. The realization of these per- spectives necessitates the development of special equip- ment. Two cytodiagnostic systems of devices and tech- niques have been used for the purpose: 1) Microspectrofluorimeters-microspectrophotometers registering the fluorescent spectra of individual cells or intracellular organelles are used for fundamental inves- tigations of cell reactions and for discovering and study- ing of the new dimensionless fluorescent characteristic parameters, reflecting the biochemical or physiological properties of the cells. 2) Double-and multi-wave microfluorimeters are used for the rapid registration of many cells to obtain statisti- cal information about cell population. These techniques are useful especially for medical and ecological investi- gations. Thus, this study confirms that parameters derived from luminescent spectral analysis of fluorochromed cells (such as α and β) or self-luminescence of living cells (such as ξ, χ, φ, ψ) are valid as dynamic indices of intracellular metabolic activity in single cells and cell systems. There are broad possibilities of further devel- oping this approach and equipment into developing in- creasingly differentiated fluorescence techniques. REFERENCES [1] Karnaukhov, V.N. (1978) Luminescent spectral analysis of cell. Nauka, Moscow. [2] Karnaukhov, V.N. (2001) Spectral analysis in cell-level monitoring of environmental state. Nauka, Moscow. [3] Karnaukhov, V.N. (1978) Luminescent analysis of cell. Nauka, Moscow. http://www.edu.ru/db/ portal/e-library/ 00000048/00000048.htm [4] Karnaukhov, V.N., Yashin, V.A., Karnaukhova, N.A., Kazantsev, A.P. and Karnaukhov, A.V. (1999) Dou- ble-wave microfluorimeter “Radical DMF-2”. Book of Abstracts II Congress of Biophysicists of Russia, 2, 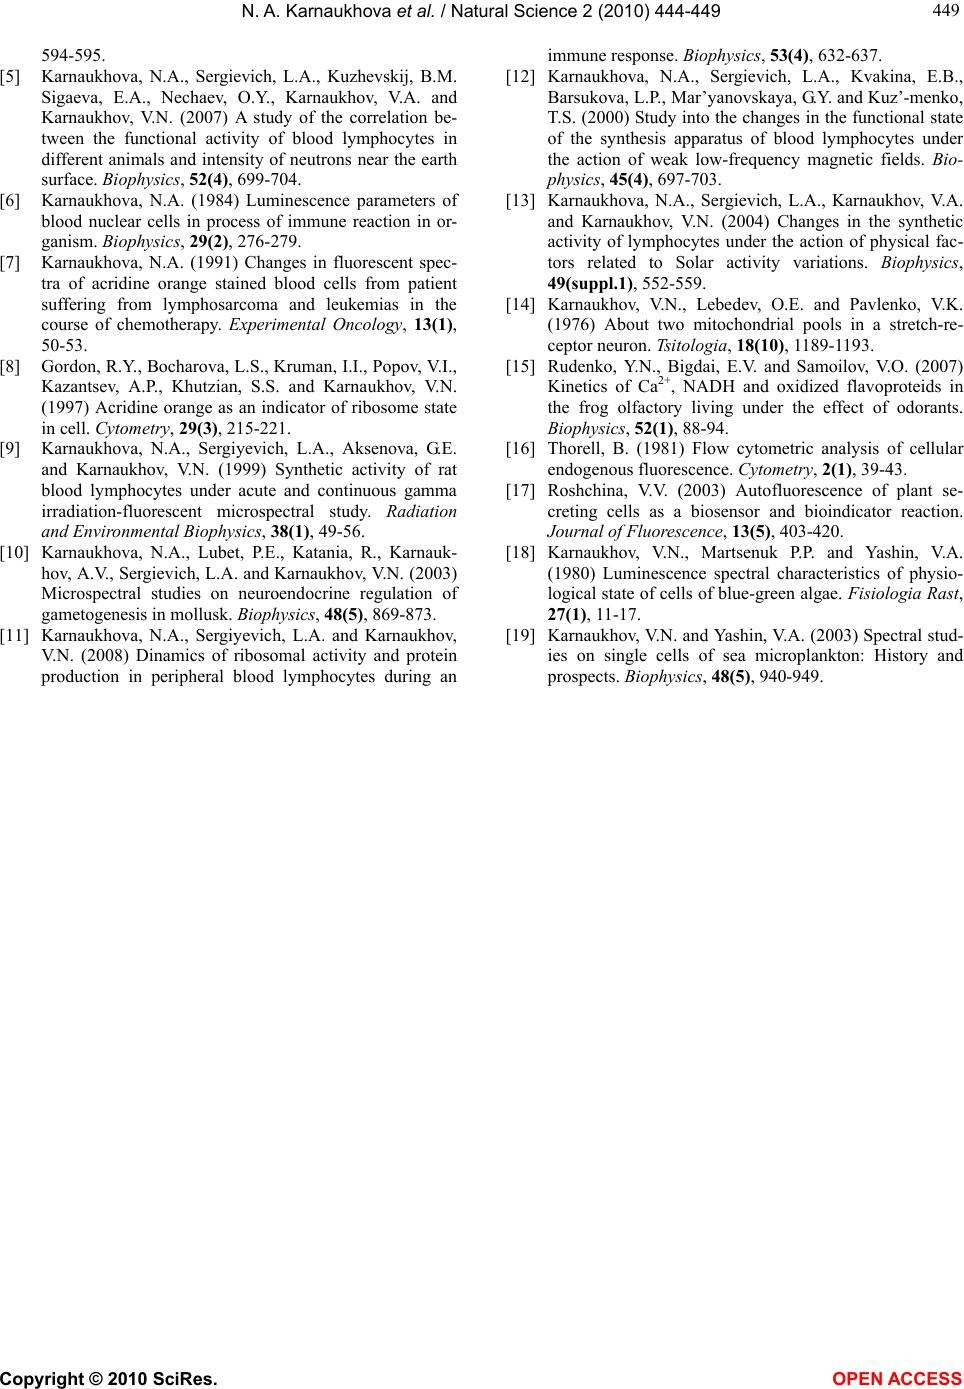 N. A. Karnaukhova et al. / Natural Science 2 (2010) 444-449 Copyright © 2010 SciRes. OPEN ACCESS 449 449 594-595. [5] Karnaukhova, N.A., Sergievich, L.A., Kuzhevskij, B.M. Sigaeva, E.A., Nechaev, O.Y., Karnaukhov, V.A. and Karnaukhov, V.N. (2007) A study of the correlation be- tween the functional activity of blood lymphocytes in different animals and intensity of neutrons near the earth surface. Biophysics, 52(4), 699-704. [6] Karnaukhova, N.A. (1984) Luminescence parameters of blood nuclear cells in process of immune reaction in or- ganism. Biophysics, 29(2), 276-279. [7] Karnaukhova, N.A. (1991) Changes in fluorescent spec- tra of acridine orange stained blood cells from patient suffering from lymphosarcoma and leukemias in the course of chemotherapy. Experimental Oncology, 13(1), 50-53. [8] Gordon, R.Y., Bocharova, L.S., Kruman, I.I., Popov, V.I., Kazantsev, A.P., Khutzian, S.S. and Karnaukhov, V.N. (1997) Acridine orange as an indicator of ribosome state in cell. Cytometry, 29(3), 215-221. [9] Karnaukhova, N.A., Sergiyevich, L.A., Aksenova, G.E. and Karnaukhov, V.N. (1999) Synthetic activity of rat blood lymphocytes under acute and continuous gamma irradiation-fluorescent microspectral study. Radiation and Environmental Biophysics, 38(1), 49-56. [10] Karnaukhova, N.A., Lubet, P.Е., Katania, R., Karnauk- hov, А.V., Sergievich, L.A. and Karnaukhov, V.N. (2003) Microspectral studies on neuroendocrine regulation of gametogenesis in mollusk. Biophysics, 48(5), 869-873. [11] Karnaukhova, N.A., Sergiyevich, L.A. and Karnaukhov, V.N. (2008) Dinamics of ribosomal activity and protein production in peripheral blood lymphocytes during an immune response. Biophysics, 53(4), 632-637. [12] Karnaukhova, N.A., Sergievich, L.A., Kvakina, E.B., Barsukova, L.P., Mar’yanovskaya, G.Y. and Kuz’-menko, T.S. (2000) Study into the changes in the functional state of the synthesis apparatus of blood lymphocytes under the action of weak low-frequency magnetic fields. Bio- physics, 45(4), 697-703. [13] Karnaukhova, N.A., Sergievich, L.A., Karnaukhov, V.A. and Karnaukhov, V.N. (2004) Changes in the synthetic activity of lymphocytes under the action of physical fac- tors related to Solar activity variations. Biophysics, 49(suppl.1), 552-559. [14] Karnaukhov, V.N., Lebedev, O.E. and Pavlenko, V.K. (1976) About two mitochondrial pools in a stretch-re- ceptor neuron. Tsitologia, 18(10), 1189-1193. [15] Rudenko, Y.N., Bigdai, E.V. and Samoilov, V.O. (2007) Kinetics of Са2+, NADH and oxidized flavoproteids in the frog olfactory living under the effect of odorants. Biophysics, 52(1), 88-94. [16] Thorell, B. (1981) Flow cytometric analysis of cellular endogenous fluorescence. Cytometry, 2(1), 39-43. [17] Roshchina, V.V. (2003) Autofluorescence of plant se- creting cells as a biosensor and bioindicator reaction. Journal of Fluorescence, 13(5), 403-420. [18] Karnaukhov, V.N., Martsenuk P.P. and Yashin, V.A. (1980) Luminescence spectral characteristics of physio- logical state of cells of blue-green algae. Fisiologia Rast, 27(1), 11-17. [19] Karnaukhov, V.N. and Yashin, V.A. (2003) Spectral stud- ies on single cells of sea microplankton: History and prospects. Biophysics, 48(5), 940-949. |