

Paper Menu >>
Journal Menu >>
 Vol.2, No.5, 432-443 (2010) Natural Science http://dx.doi.org/10.4236/ns.2010.25053 Copyright © 2010 SciRes. OPEN ACCESS Kinetic spectrophotometric determination of certain cephalosporins using iodate/iodide mixture Salwa R. El-Shaboury, Fardous A. Mohamed, Gamal A. Saleh, Azza H. Rageh* Department of Pharmaceutical Analytical Chemistry, Faculty of Pharmacy, Assiut University, Assiut, Egypt; [email protected]; [email protected]; [email protected]; *Corresponding Author: [email protected] Received 10 December 2009; revised 28 January 2010; accepted 8 March 2010. ABSTRACT A simple, precise and accurate kinetic spectro- photometric method for determination of ce- fradine anhydrous, cefaclor monohydrate, ce- fadroxil monohydrate, cefalexin anhydrous and cefixime in bulk and in pharmaceutical formula- tions has been developed. The method based on a kinetic investigation of the reaction of the free carboxylic acid group of the drug with a mixture of potassium iodate and potassium io- dide at room temperature to form yellow col- oured triiodide ions. The reaction was followed up spectrophotometrically by measuring the increase in absorbance at 352 nm as a function of time. The initial rate, fixed time, variable time and rate-constant methods were adopted for constructing the calibration curves but fixed time method has been found to be more appli- cable. The analytical performance of the method, in terms of accuracy and precision, was statis- tically validated; the results were satisfactory. The method has been successfully applied to the determination of the studied drugs in com- mercial pharmaceutical formulations. Statistical comparison of the results with a well estab- lished reported method showed excellent ag- reement and proved that there is no significant difference in the accuracy and precision. Keywords: Cephalosporins; Kinetic Spectrophotometry; Lodate/Lodide Mixture; Pharmaceutical Analysis 1. INTRODUCTION Because cephalosporins are among the safest and the most effective broad-spectrum bactericidal antimicrobial agents available to the clinician, they have become the most widely prescribed of all antibiotics. All of these semi-synthetic antibiotics are derived from 7-amino-ce- phalosporanic acid and contain a β-lactam ring fused to a dihydrothiazine ring (Table 1) but differ in the nature of the substituents attached at the 3 and/or 7-positions of the cephem ring. These substitutions affect either the pharmacokinetic properties (3-position) or the antibacte- rial spectrum (7-position) of the cephalosporins. Cepha- losporins operate by inhibiting bacterial cell wall bio- synthesis which grows actively against a wide range of both gram-positive and gram-negative bacteria. The po- sitive results of these drugs include the resistance of penicillinases and ability to treat infections that are re- sistant to penicillin derivatives. The official methods for analyzing cephalosporins are mostly chromatographic methods [1] which are expensive. Most of the reported methods involve the cleavage of the β-lactam moiety of the cephalosporin structure. These methods include spe- ctrophotometric [2-6] spectrofluorimetric [7-10]. and electrochemical methods [11-13]. A direct chemical ana- lysis based on the reactivity of the intact molecule is not frequently encountered. Kinetic spectrophotometric methods are becoming of great interest in chemical and pharmaceutical analysis [14]. The application of these methods offered some specific advantages [15,16]. 1) Simplicity owing to elimination of some experi- mental steps such as filtration and extraction prior to absorbance measurements. 2) High selectivity due to the measurement of the in- crease or decrease of the absorbance as a function of reaction time instead of measuring the concrete absorb- ance value. 3) Avoiding the interference of the coloured and/or turbidity background of the samples, and possibility of avoiding the interference of the other active compounds present in the commercial product if they are resisting the established reaction conditions. The literatures are still lacking analytical procedures based on kinetics for determination of the investigated drugs in commercial dosage forms. A kinetic spectro- photometric method has been reported for determination of cefadroxil based on its alkaline hydrolysis [17]. With 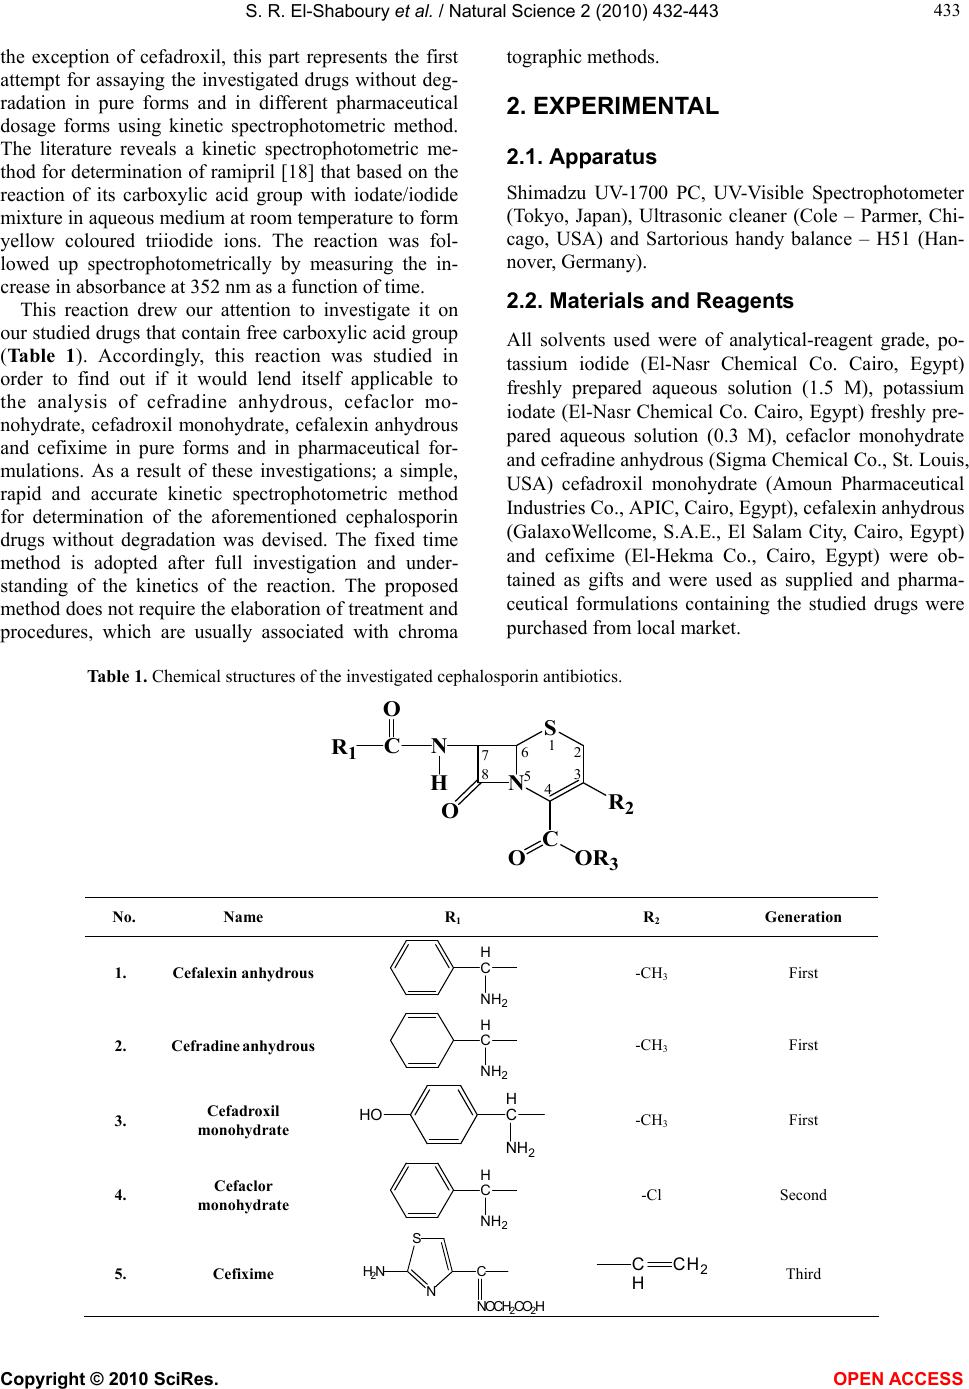 S. R. El-Shaboury et al. / Natural Science 2 (2010) 432-443 Copyright © 2010 SciRes. OPEN ACCESS 433 433 the exception of cefadroxil, this part represents the first attempt for assaying the investigated drugs without deg- radation in pure forms and in different pharmaceutical dosage forms using kinetic spectrophotometric method. The literature reveals a kinetic spectrophotometric me- thod for determination of ramipril [18] that based on the reaction of its carboxylic acid group with iodate/iodide mixture in aqueous medium at room temperature to form yellow coloured triiodide ions. The reaction was fol- lowed up spectrophotometrically by measuring the in- crease in absorbance at 352 nm as a function of time. This reaction drew our attention to investigate it on our studied drugs that contain free carboxylic acid group (Table 1). Accordingly, this reaction was studied in order to find out if it would lend itself applicable to the analysis of cefradine anhydrous, cefaclor mo- nohydrate, cefadroxil monohydrate, cefalexin anhydrous and cefixime in pure forms and in pharmaceutical for- mulations. As a result of these investigations; a simple, rapid and accurate kinetic spectrophotometric method for determination of the aforementioned cephalosporin drugs without degradation was devised. The fixed time method is adopted after full investigation and under- standing of the kinetics of the reaction. The proposed method does not require the elaboration of treatment and procedures, which are usually associated with chroma tographic methods. 2. EXPERIMENTAL 2.1. Apparatus Shimadzu UV-1700 PC, UV-Visible Spectrophotometer (Tokyo, Japan), Ultrasonic cleaner (Cole – Parmer, Chi- cago, USA) and Sartorious handy balance – H51 (Han- nover, Germany). 2.2. Materials and Reagents All solvents used were of analytical-reagent grade, po- tassium iodide (El-Nasr Chemical Co. Cairo, Egypt) freshly prepared aqueous solution (1.5 M), potassium iodate (El-Nasr Chemical Co. Cairo, Egypt) freshly pre- pared aqueous solution (0.3 M), cefaclor monohydrate and cefradine anhydrous (Sigma Chemical Co., St. Louis, USA) cefadroxil monohydrate (Amoun Pharmaceutical Industries Co., APIC, Cairo, Egypt), cefalexin anhydrous (GalaxoWellcome, S.A.E., El Salam City, Cairo, Egypt) and cefixime (El-Hekma Co., Cairo, Egypt) were ob- tained as gifts and were used as supplied and pharma- ceutical formulations containing the studied drugs were purchased from local market. Table 1. Chemical structures of the investigated cephalosporin antibiotics. S NR 2 C OOR 3 O NC O R 1 H 12 3 4 6 7 85 No. Name R1 R2 Generation 1. Cefalexin anhydrous H C NH2 -CH3 First 2. Cefradine anhydrous H C NH2 -CH3 First 3. Cefadroxil monohydrate H C NH2 HO -CH3 First 4. Cefaclor monohydrate H C NH2 -Cl Second 5. Cefixime S N H 2NC NOCH2 CO2 H C H CH2 Third 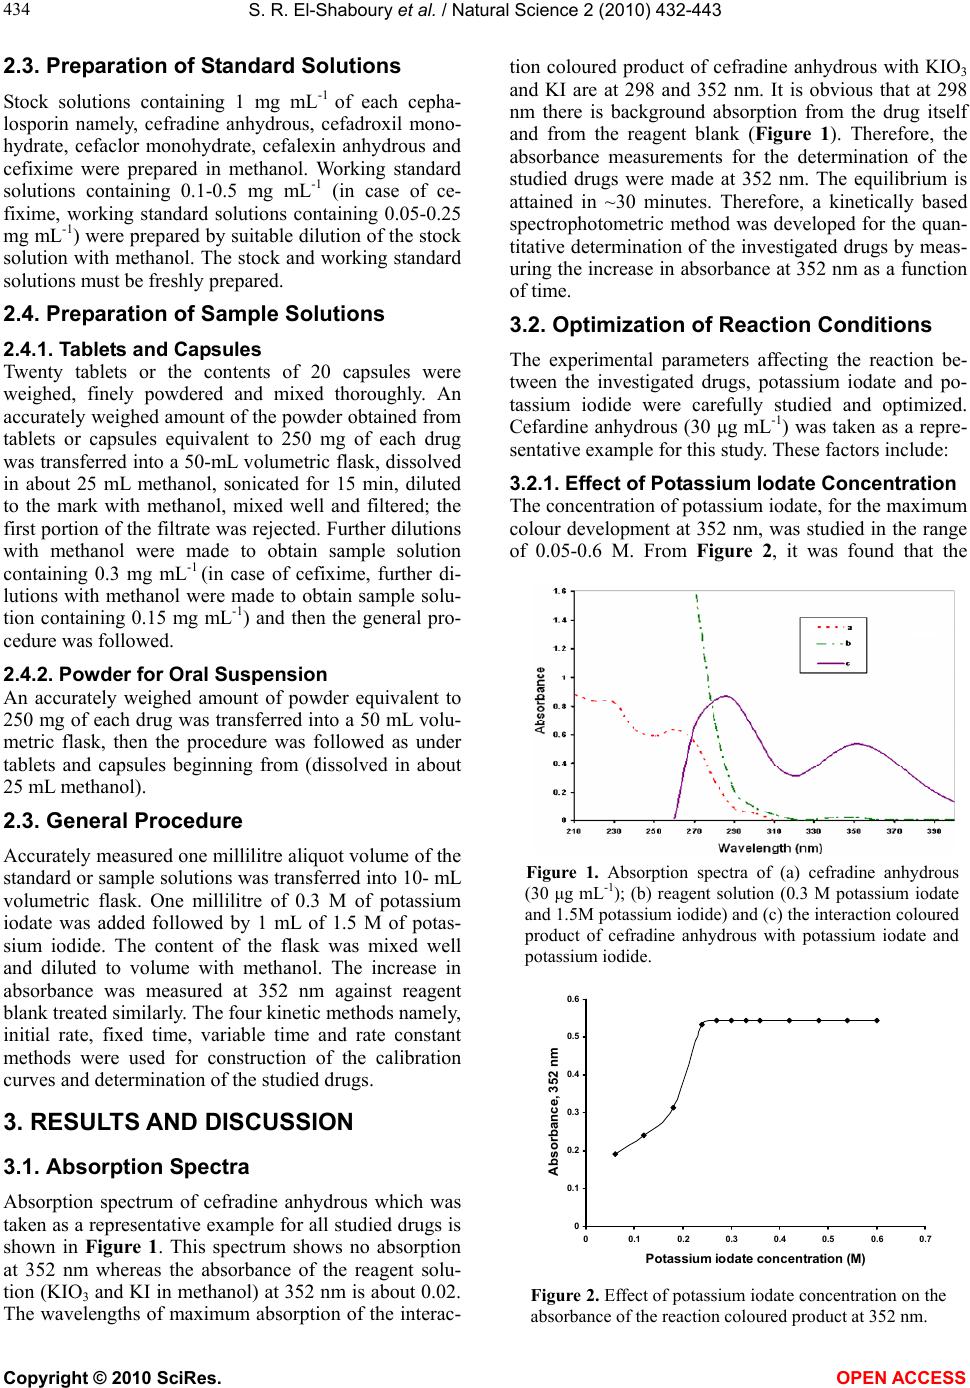 S. R. El-Shaboury et al. / Natural Science 2 (2010) 432-443 Copyright © 2010 SciRes. OPEN ACCESS 434 2.3. Preparation of Standard Solutions Stock solutions containing 1 mg mL-1 of each cepha- losporin namely, cefradine anhydrous, cefadroxil mono- hydrate, cefaclor monohydrate, cefalexin anhydrous and cefixime were prepared in methanol. Working standard solutions containing 0.1-0.5 mg mL-1 (in case of ce- fixime, working standard solutions containing 0.05-0.25 mg mL-1) were prepared by suitable dilution of the stock solution with methanol. The stock and working standard solutions must be freshly prepared. 2.4. Preparation of Sample Solutions 2.4.1. Tablets and Capsules Twenty tablets or the contents of 20 capsules were weighed, finely powdered and mixed thoroughly. An accurately weighed amount of the powder obtained from tablets or capsules equivalent to 250 mg of each drug was transferred into a 50-mL volumetric flask, dissolved in about 25 mL methanol, sonicated for 15 min, diluted to the mark with methanol, mixed well and filtered; the first portion of the filtrate was rejected. Further dilutions with methanol were made to obtain sample solution containing 0.3 mg mL-1 (in case of cefixime, further di- lutions with methanol were made to obtain sample solu- tion containing 0.15 mg mL-1) and then the general pro- cedure was followed. 2.4.2. Powder for Oral Suspension An accurately weighed amount of powder equivalent to 250 mg of each drug was transferred into a 50 mL volu- metric flask, then the procedure was followed as under tablets and capsules beginning from (dissolved in about 25 mL methanol). 2.3. General Procedure Accurately measured one millilitre aliquot volume of the standard or sample solutions was transferred into 10- mL volumetric flask. One millilitre of 0.3 M of potassium iodate was added followed by 1 mL of 1.5 M of potas- sium iodide. The content of the flask was mixed well and diluted to volume with methanol. The increase in absorbance was measured at 352 nm against reagent blank treated similarly. The four kinetic methods namely, initial rate, fixed time, variable time and rate constant methods were used for construction of the calibration curves and determination of the studied drugs. 3. RESULTS AND DISCUSSION 3.1. Absorption Spectra Absorption spectrum of cefradine anhydrous which was taken as a representative example for all studied drugs is shown in Figure 1. This spectrum shows no absorption at 352 nm whereas the absorbance of the reagent solu- tion (KIO3 and KI in methanol) at 352 nm is about 0.02. The wavelengths of maximum absorption of the interac- tion coloured product of cefradine anhydrous with KIO3 and KI are at 298 and 352 nm. It is obvious that at 298 nm there is background absorption from the drug itself and from the reagent blank (Figure 1). Therefore, the absorbance measurements for the determination of the studied drugs were made at 352 nm. The equilibrium is attained in ~30 minutes. Therefore, a kinetically based spectrophotometric method was developed for the quan- titative determination of the investigated drugs by meas- uring the increase in absorbance at 352 nm as a function of time. 3.2. Optimization of Reaction Conditions The experimental parameters affecting the reaction be- tween the investigated drugs, potassium iodate and po- tassium iodide were carefully studied and optimized. Cefardine anhydrous (30 μg mL-1) was taken as a repre- sentative example for this study. These factors include: 3.2.1. Effect of Potassium Iodate Concentration The concentration of potassium iodate, for the maximum colour development at 352 nm, was studied in the range of 0.05-0.6 M. From Figure 2, it was found that the Figure 1. Absorption spectra of (a) cefradine anhydrous (30 μg mL-1); (b) reagent solution (0.3 M potassium iodate and 1.5M potassium iodide) and (c) the interaction coloured product of cefradine anhydrous with potassium iodate and potassium iodide. 0 0.1 0.2 0.3 0.4 0.5 0.6 00.10.2 0.3 0.4 0.50.6 0.7 Potassium iodate concentration (M) Absorbance, 352 nm Figure 2. Effect of potassium iodate concentration on the absorbance of the reaction coloured product at 352 nm. 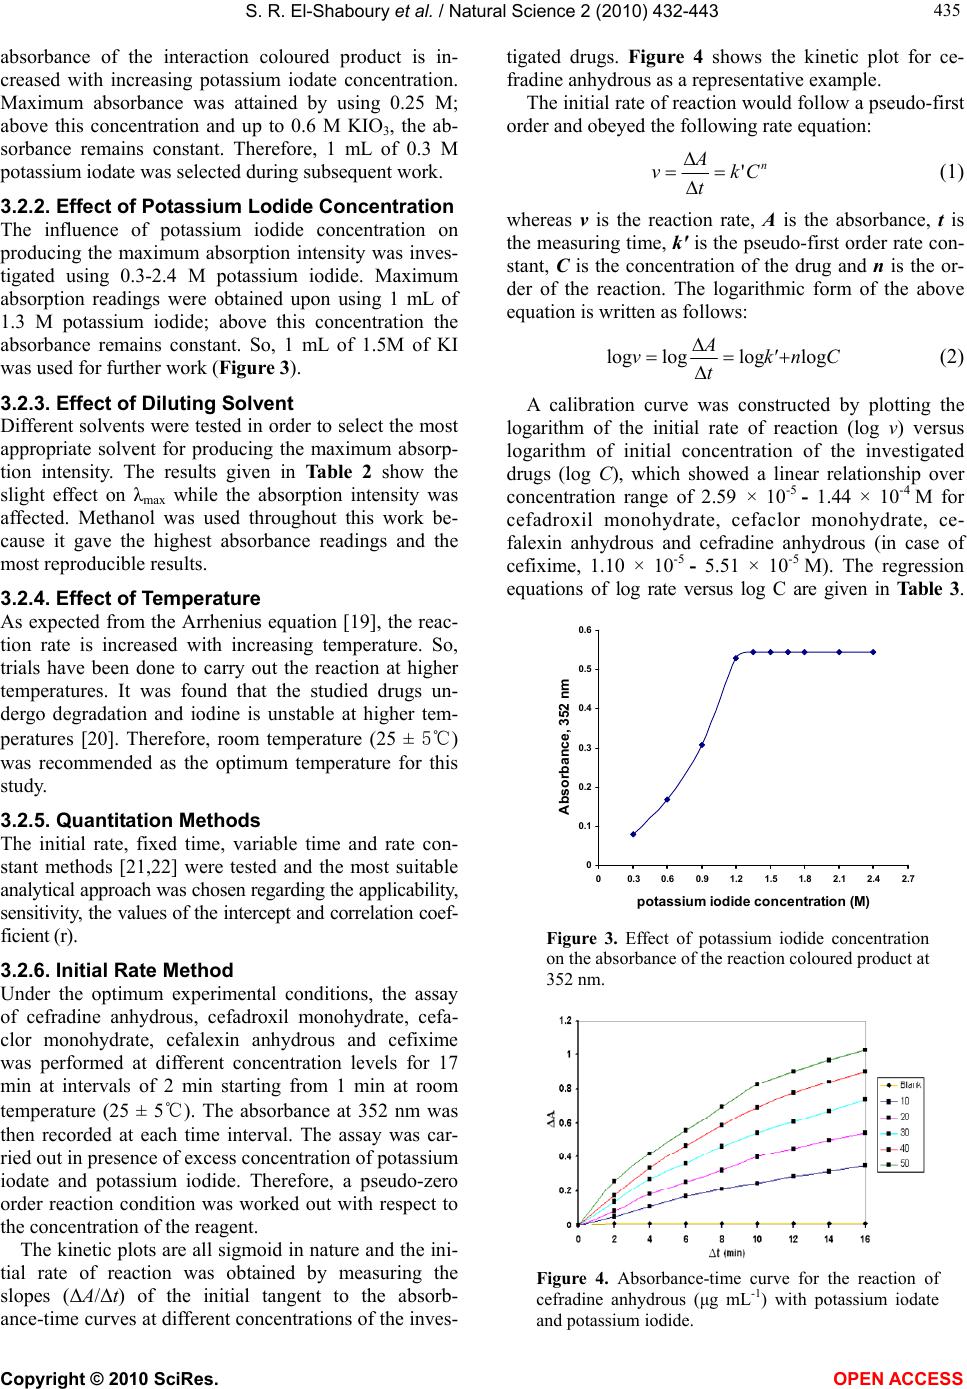 S. R. El-Shaboury et al. / Natural Science 2 (2010) 432-443 Copyright © 2010 SciRes. OPEN ACCESS 435 435 absorbance of the interaction coloured product is in- creased with increasing potassium iodate concentration. Maximum absorbance was attained by using 0.25 M; above this concentration and up to 0.6 M KIO3, the ab- sorbance remains constant. Therefore, 1 mL of 0.3 M potassium iodate was selected during subsequent work. 3.2.2. Effect of Potassium Lodide Concentration The influence of potassium iodide concentration on producing the maximum absorption intensity was inves- tigated using 0.3-2.4 M potassium iodide. Maximum absorption readings were obtained upon using 1 mL of 1.3 M potassium iodide; above this concentration the absorbance remains constant. So, 1 mL of 1.5M of KI was used for further work (Figure 3). 3.2.3. Effect of Diluting Solvent Different solvents were tested in order to select the most appropriate solvent for producing the maximum absorp- tion intensity. The results given in Table 2 show the slight effect on λmax while the absorption intensity was affected. Methanol was used throughout this work be- cause it gave the highest absorbance readings and the most reproducible results. 3.2.4. Effect of Temperature As expected from the Arrhenius equation [19], the reac- tion rate is increased with increasing temperature. So, trials have been done to carry out the reaction at higher temperatures. It was found that the studied drugs un- dergo degradation and iodine is unstable at higher tem- peratures [20]. Therefore, room temperature (25 ± 5℃) was recommended as the optimum temperature for this study. 3.2.5. Quantitation Methods The initial rate, fixed time, variable time and rate con- stant methods [21,22] were tested and the most suitable analytical approach was chosen regarding the applicability, sensitivity, the values of the intercept and correlation coef- ficient (r). 3.2.6. Initial Rate Method Under the optimum experimental conditions, the assay of cefradine anhydrous, cefadroxil monohydrate, cefa- clor monohydrate, cefalexin anhydrous and cefixime was performed at different concentration levels for 17 min at intervals of 2 min starting from 1 min at room temperature (25 ± 5℃). The absorbance at 352 nm was then recorded at each time interval. The assay was car- ried out in presence of excess concentration of potassium iodate and potassium iodide. Therefore, a pseudo-zero order reaction condition was worked out with respect to the concentration of the reagent. The kinetic plots are all sigmoid in nature and the ini- tial rate of reaction was obtained by measuring the slopes (ΔA/Δt) of the initial tangent to the absorb- ance-time curves at different concentrations of the inves- tigated drugs. Figure 4 shows the kinetic plot for ce- fradine anhydrous as a representative example. The initial rate of reaction would follow a pseudo-first order and obeyed the following rate equation: n Ck t A v' (1) whereas ν is the reaction rate, A is the absorbance, t is the measuring time, k' is the pseudo-first order rate con- stant, C is the concentration of the drug and n is the or- der of the reaction. The logarithmic form of the above equation is written as follows: Cn'k t A vloglogloglog (2) A calibration curve was constructed by plotting the logarithm of the initial rate of reaction (log v) versus logarithm of initial concentration of the investigated drugs (log C), which showed a linear relationship over concentration range of 2.59 × 10⁻⁵ - 1.44 × 10⁻⁴ M for cefadroxil monohydrate, cefaclor monohydrate, ce- falexin anhydrous and cefradine anhydrous (in case of cefixime, 1.10 × 10⁻⁵ - 5.51 × 10⁻⁵ M). The regression equations of log rate versus log C are given in Table 3. 0 0.1 0.2 0.3 0.4 0.5 0.6 0 0.30.60.91.21.51.82.12.42.7 potassium iodide concentration (M) Absorbance, 352 nm Figure 3. Effect of potassium iodide concentration on the absorbance of the reaction coloured product at 352 nm. Figure 4. Absorbance-time curve for the reaction of cefradine anhydrous (μg mL-1) with potassium iodate and potassium iodide. 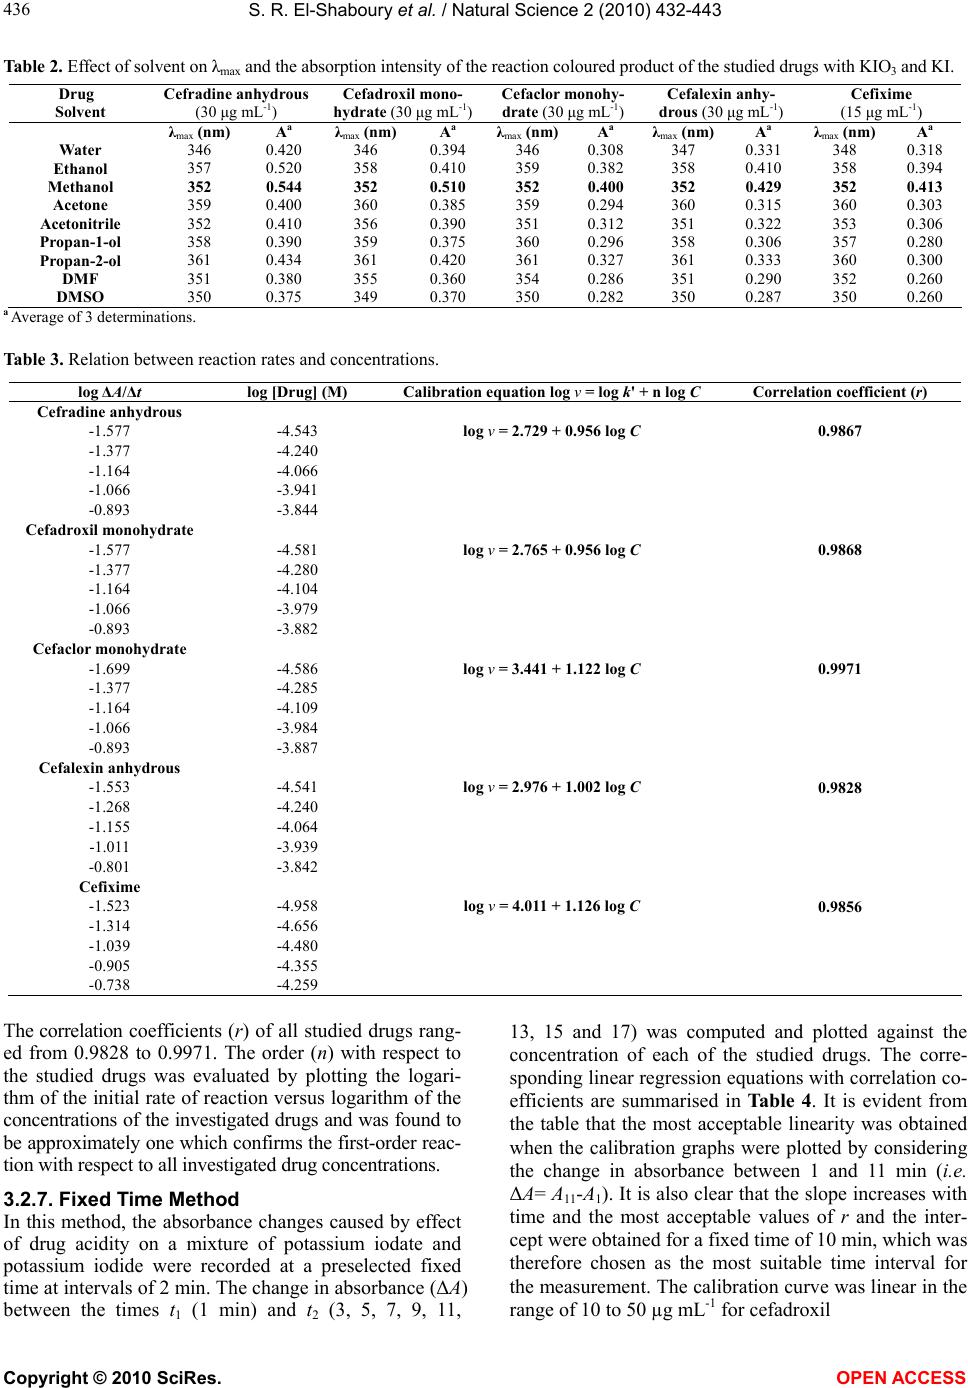 S. R. El-Shaboury et al. / Natural Science 2 (2010) 432-443 Copyright © 2010 SciRes. OPEN ACCESS 436 Table 2. Effect of solvent on λmax and the absorption intensity of the reaction coloured product of the studied drugs with KIO3 and KI. Drug Solvent Cefradine anhydrous (30 μg mL-1) Cefadroxil mono- hydrate (30 μg mL-1) Cefaclor monohy- drate (30 μg mL-1) Cefalexin anhy- drous (30 μg mL-1) Cefixime (15 μg mL-1) λmax (nm) Aa λmax (nm)Aa λmax (nm)Aa λmax (nm)Aa λmax (nm)Aa Water 346 0.420 346 0.394 346 0.308 347 0.331 348 0.318 Ethanol 357 0.520 358 0.410 359 0.382 358 0.410 358 0.394 Methanol 352 0.544 352 0.510 352 0.400 352 0.429 352 0.413 Acetone 359 0.400 360 0.385 359 0.294 360 0.315 360 0.303 Acetonitrile 352 0.410 356 0.390 351 0.312 351 0.322 353 0.306 Propan-1-ol 358 0.390 359 0.375 360 0.296 358 0.306 357 0.280 Propan-2-ol 361 0.434 361 0.420 361 0.327 361 0.333 360 0.300 DMF 351 0.380 355 0.360 354 0.286 351 0.290 352 0.260 DMSO 350 0.375 349 0.370 350 0.282 350 0.287 350 0.260 a Average of 3 determinations. Table 3. Relation between reaction rates and concentrations. log ΔA/Δt log [Drug] (M) Calibration equation log ν = log k' + n log C Correlation coefficient (r) Cefradine anhydrous -1.577 -4.543 log ν = 2.729 + 0.956 log C 0.9867 -1.377 -4.240 -1.164 -4.066 -1.066 -3.941 -0.893 -3.844 Cefadroxil monohydrate -1.577 -4.581 log ν = 2.765 + 0.956 log C 0.9868 -1.377 -4.280 -1.164 -4.104 -1.066 -3.979 -0.893 -3.882 Cefaclor monohydrate -1.699 -4.586 log ν = 3.441 + 1.122 log C 0.9971 -1.377 -4.285 -1.164 -4.109 -1.066 -3.984 -0.893 -3.887 Cefalexin anhydrous -1.553 -4.541 log ν = 2.976 + 1.002 log C 0.9828 -1.268 -4.240 -1.155 -4.064 -1.011 -3.939 -0.801 -3.842 Cefixime -1.523 -4.958 log ν = 4.011 + 1.126 log C 0.9856 -1.314 -4.656 -1.039 -4.480 -0.905 -4.355 -0.738 -4.259 The correlation coefficients (r) of all studied drugs rang- ed from 0.9828 to 0.9971. The order (n) with respect to the studied drugs was evaluated by plotting the logari- thm of the initial rate of reaction versus logarithm of the concentrations of the investigated drugs and was found to be approximately one which confirms the first-order reac- tion with respect to all investigated drug concentrations. 3.2.7. Fixed Time Method In this method, the absorbance changes caused by effect of drug acidity on a mixture of potassium iodate and potassium iodide were recorded at a preselected fixed time at intervals of 2 min. The change in absorbance (ΔA) between the times t1 (1 min) and t2 (3, 5, 7, 9, 11, 13, 15 and 17) was computed and plotted against the concentration of each of the studied drugs. The corre- sponding linear regression equations with correlation co- efficients are summarised in Table 4. It is evident from the table that the most acceptable linearity was obtained when the calibration graphs were plotted by considering the change in absorbance between 1 and 11 min (i.e. ΔA= A11 -A1). It is also clear that the slope increases with time and the most acceptable values of r and the inter- cept were obtained for a fixed time of 10 min, which was therefore chosen as the most suitable time interval for the measurement. The calibration curve was linear in the range of 10 to 50 µg mL-1 for cefadroxil 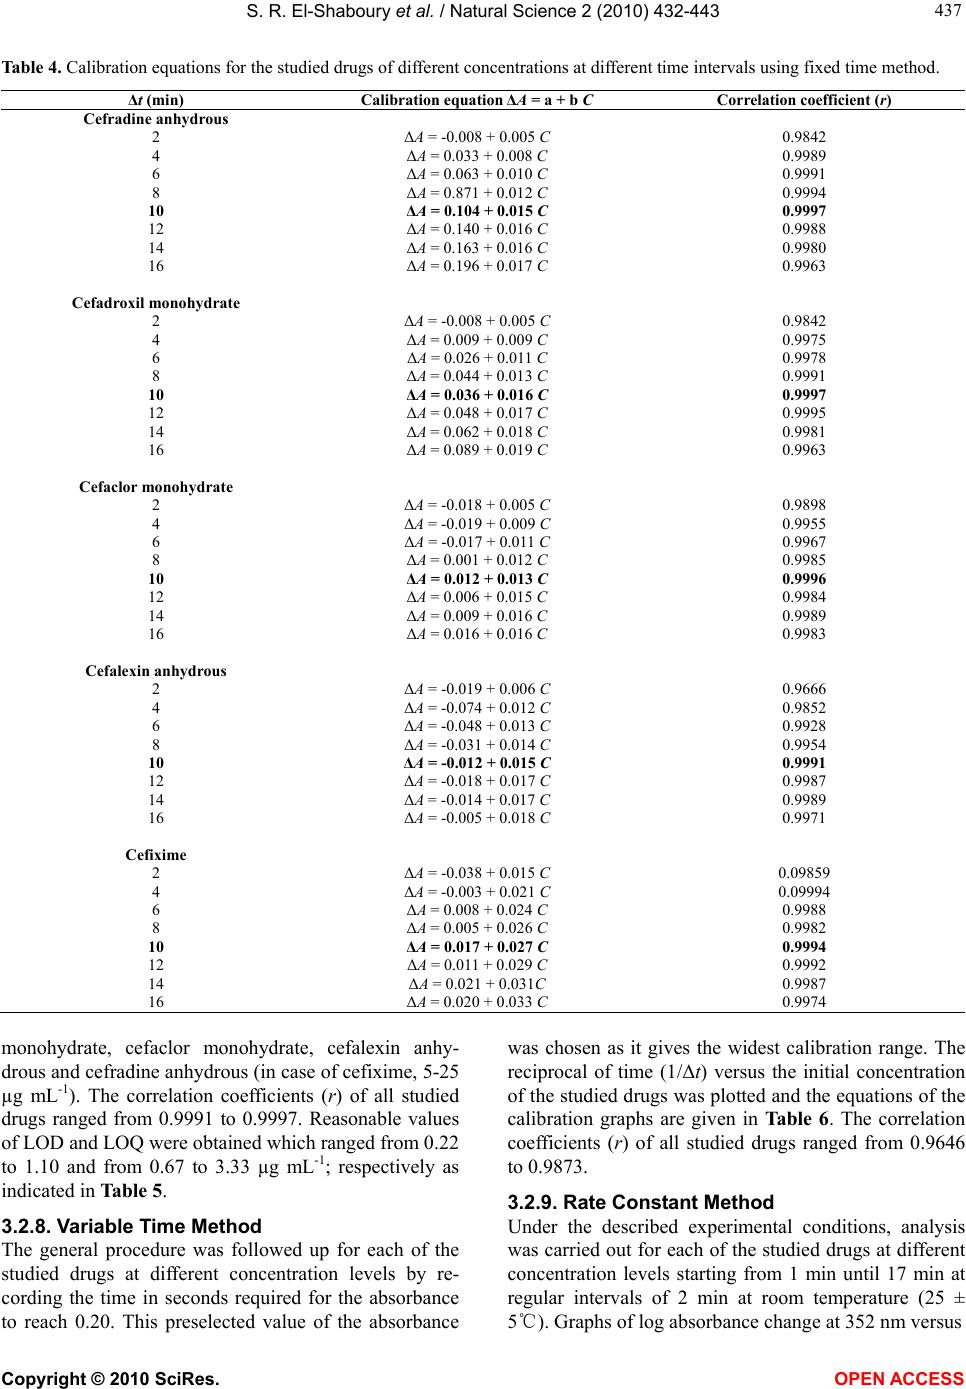 S. R. El-Shaboury et al. / Natural Science 2 (2010) 432-443 Copyright © 2010 SciRes. OPEN ACCESS 437 437 Table 4. Calibration equations for the studied drugs of different concentrations at different time intervals using fixed time method. Δt (min) Calibration equation ΔA = a + b C Correlation coefficient (r) Cefradine anhydrous 2 ΔA = -0.008 + 0.005 C 0.9842 4 ΔA = 0.033 + 0.008 C 0.9989 6 ΔA = 0.063 + 0.010 C 0.9991 8 ΔA = 0.871 + 0.012 C 0.9994 10 ΔA = 0.104 + 0.015 C 0.9997 12 ΔA = 0.140 + 0.016 C 0.9988 14 ΔA = 0.163 + 0.016 C 0.9980 16 ΔA = 0.196 + 0.017 C 0.9963 Cefadroxil monohydrate 2 ΔA = -0.008 + 0.005 C 0.9842 4 ΔA = 0.009 + 0.009 C 0.9975 6 ΔA = 0.026 + 0.011 C 0.9978 8 ΔA = 0.044 + 0.013 C 0.9991 10 ΔA = 0.036 + 0.016 C 0.9997 12 ΔA = 0.048 + 0.017 C 0.9995 14 ΔA = 0.062 + 0.018 C 0.9981 16 ΔA = 0.089 + 0.019 C 0.9963 Cefaclor monohydrate 2 ΔA = -0.018 + 0.005 C 0.9898 4 ΔA = -0.019 + 0.009 C 0.9955 6 ΔA = -0.017 + 0.011 C 0.9967 8 ΔA = 0.001 + 0.012 C 0.9985 10 ΔA = 0.012 + 0.013 C 0.9996 12 ΔA = 0.006 + 0.015 C 0.9984 14 ΔA = 0.009 + 0.016 C 0.9989 16 ΔA = 0.016 + 0.016 C 0.9983 Cefalexin anhydrous 2 ΔA = -0.019 + 0.006 C 0.9666 4 ΔA = -0.074 + 0.012 C 0.9852 6 ΔA = -0.048 + 0.013 C 0.9928 8 ΔA = -0.031 + 0.014 C 0.9954 10 ΔA = -0.012 + 0.015 C 0.9991 12 ΔA = -0.018 + 0.017 C 0.9987 14 ΔA = -0.014 + 0.017 C 0.9989 16 ΔA = -0.005 + 0.018 C 0.9971 Cefixime 2 ΔA = -0.038 + 0.015 C 0.09859 4 ΔA = -0.003 + 0.021 C 0.09994 6 ΔA = 0.008 + 0.024 C 0.9988 8 ΔA = 0.005 + 0.026 C 0.9982 10 ΔA = 0.017 + 0.027 C 0.9994 12 ΔA = 0.011 + 0.029 C 0.9992 14 ΔA = 0.021 + 0.031C 0.9987 16 ΔA = 0.020 + 0.033 C 0.9974 monohydrate, cefaclor monohydrate, cefalexin anhy- drous and cefradine anhydrous (in case of cefixime, 5-25 µg mL-1). The correlation coefficients (r) of all studied drugs ranged from 0.9991 to 0.9997. Reasonable values of LOD and LOQ were obtained which ranged from 0.22 to 1.10 and from 0.67 to 3.33 µg mL-1; respectively as indicated in Table 5. 3.2.8. Variable Time Method The general procedure was followed up for each of the studied drugs at different concentration levels by re- cording the time in seconds required for the absorbance to reach 0.20. This preselected value of the absorbance was chosen as it gives the widest calibration range. The reciprocal of time (1/Δt) versus the initial concentration of the studied drugs was plotted and the equations of the calibration graphs are given in Table 6. The correlation coefficients (r) of all studied drugs ranged from 0.9646 to 0.9873. 3.2.9. Rate Constant Method Under the described experimental conditions, analysis was carried out for each of the studied drugs at different concentration levels starting from 1 min until 17 min at regular intervals of 2 min at room temperature (25 ± 5℃). Graphs of log absorbance change at 352 nm versus 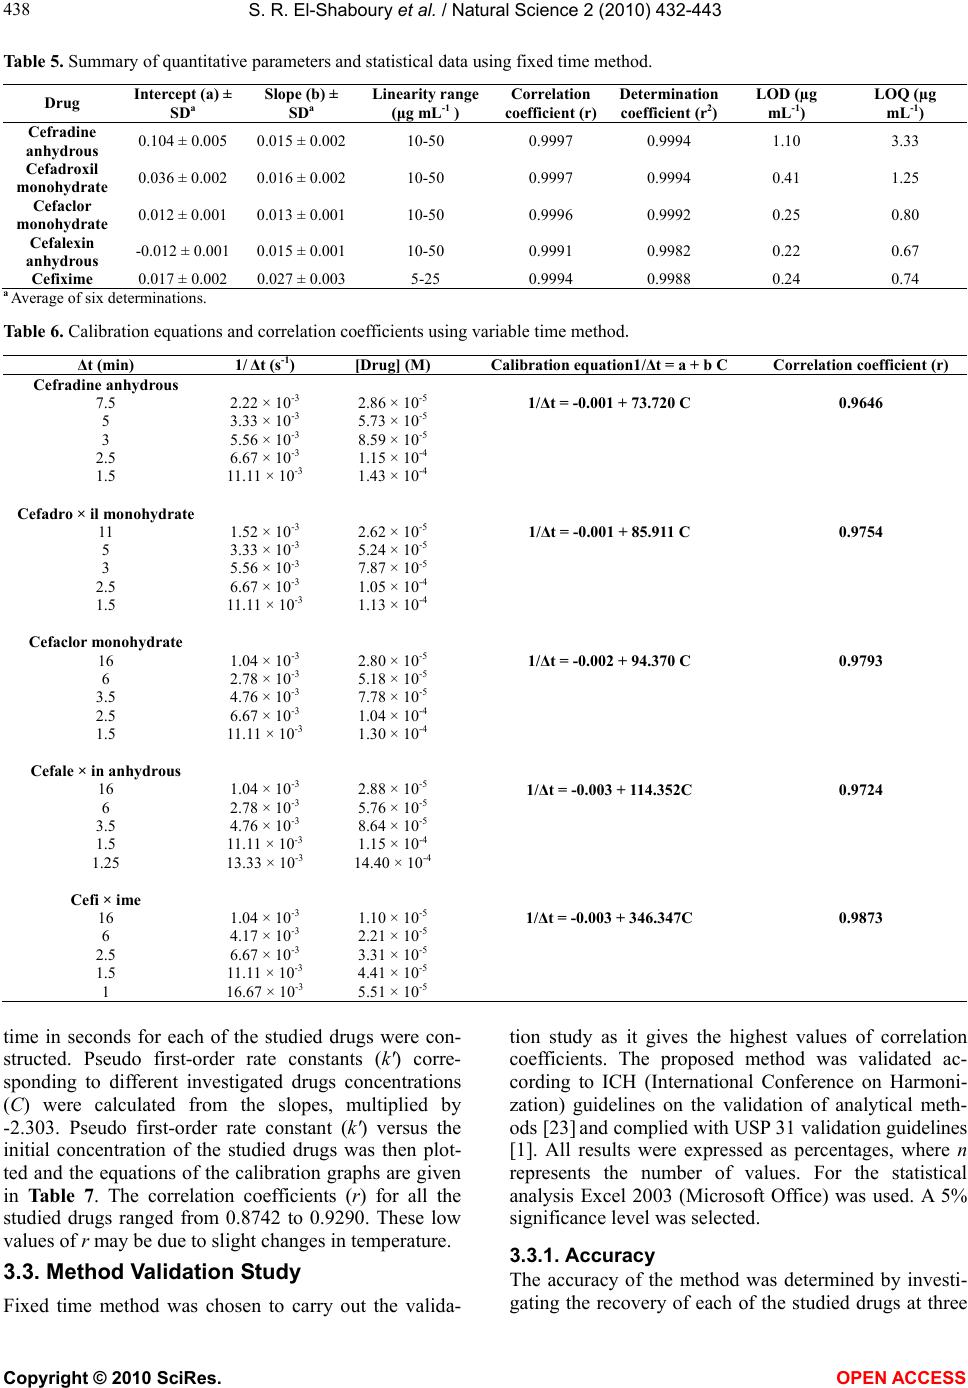 S. R. El-Shaboury et al. / Natural Science 2 (2010) 432-443 Copyright © 2010 SciRes. OPEN ACCESS 438 Table 5. Summary of quantitative parameters and statistical data using fixed time method. Drug Intercept (a) ± SDa Slope (b) ± SDa Linearity range (μg mL-1 ) Correlation coefficient (r) Determination coefficient (r2) LOD (µg mL-1) LOQ (µg mL-1) Cefradine anhydrous 0.104 ± 0.005 0.015 ± 0.002 10-50 0.9997 0.9994 1.10 3.33 Cefadroxil monohydrate 0.036 ± 0.002 0.016 ± 0.002 10-50 0.9997 0.9994 0.41 1.25 Cefaclor monohydrate 0.012 ± 0.001 0.013 ± 0.001 10-50 0.9996 0.9992 0.25 0.80 Cefalexin anhydrous -0.012 ± 0.001 0.015 ± 0.001 10-50 0.9991 0.9982 0.22 0.67 Cefixime 0.017 ± 0.002 0.027 ± 0.003 5-25 0.9994 0.9988 0.24 0.74 a Average of six determinations. Table 6. Calibration equations and correlation coefficients using variable time method. Δt (min) 1/ Δt (s-1) [Drug] (M) Calibration equation1/Δt = a + b C Correlation coefficient (r) Cefradine anhydrous 7.5 2.22 × 10⁻³ 2.86 × 10⁻⁵ 1/Δt = -0.001 + 73.720 C 0.9646 5 3.33 × 10⁻³ 5.73 × 10⁻⁵ 3 5.56 × 10⁻³ 8.59 × 10⁻⁵ 2.5 6.67 × 10⁻³ 1.15 × 10⁻⁴ 1.5 11.11 × 10⁻³ 1.43 × 10⁻⁴ Cefadro × il monohydrate 11 1.52 × 10⁻³ 2.62 × 10⁻⁵ 1/Δt = -0.001 + 85.911 C 0.9754 5 3.33 × 10⁻³ 5.24 × 10⁻⁵ 3 5.56 × 10⁻³ 7.87 × 10⁻⁵ 2.5 6.67 × 10⁻³ 1.05 × 10⁻⁴ 1.5 11.11 × 10⁻³ 1.13 × 10⁻⁴ Cefaclor monohydrate 16 1.04 × 10⁻³ 2.80 × 10⁻⁵ 1/Δt = -0.002 + 94.370 C 0.9793 6 2.78 × 10⁻³ 5.18 × 10⁻⁵ 3.5 4.76 × 10⁻³ 7.78 × 10⁻⁵ 2.5 6.67 × 10⁻³ 1.04 × 10⁻⁴ 1.5 11.11 × 10⁻³ 1.30 × 10⁻⁴ Cefale × in anhydrous 16 1.04 × 10⁻³ 2.88 × 10⁻⁵ 1/Δt = -0.003 + 114.352C 0.9724 6 2.78 × 10⁻³ 5.76 × 10⁻⁵ 3.5 4.76 × 10⁻³ 8.64 × 10⁻⁵ 1.5 11.11 × 10⁻³ 1.15 × 10⁻⁴ 1.25 13.33 × 10⁻³ 14.40 × 10⁻⁴ Cefi × ime 16 1.04 × 10⁻³ 1.10 × 10⁻⁵ 1/Δt = -0.003 + 346.347C 0.9873 6 4.17 × 10⁻³ 2.21 × 10⁻⁵ 2.5 6.67 × 10⁻³ 3.31 × 10⁻⁵ 1.5 11.11 × 10⁻³ 4.41 × 10⁻⁵ 1 16.67 × 10⁻³ 5.51 × 10⁻⁵ time in seconds for each of the studied drugs were con- structed. Pseudo first-order rate constants (k') corre- sponding to different investigated drugs concentrations (C) were calculated from the slopes, multiplied by -2.303. Pseudo first-order rate constant (k') versus the initial concentration of the studied drugs was then plot- ted and the equations of the calibration graphs are given in Table 7. The correlation coefficients (r) for all the studied drugs ranged from 0.8742 to 0.9290. These low values of r may be due to slight changes in temperature. 3.3. Method Validation Study Fixed time method was chosen to carry out the valida- tion study as it gives the highest values of correlation coefficients. The proposed method was validated ac- cording to ICH (International Conference on Harmoni- zation) guidelines on the validation of analytical meth- ods [23] and complied with USP 31 validation guidelines [1]. All results were expressed as percentages, where n represents the number of values. For the statistical analysis Excel 2003 (Microsoft Office) was used. A 5% significance level was selected. 3.3.1. Accuracy The accuracy of the method was determined by investi- gating the recovery of each of the studied drugs at three 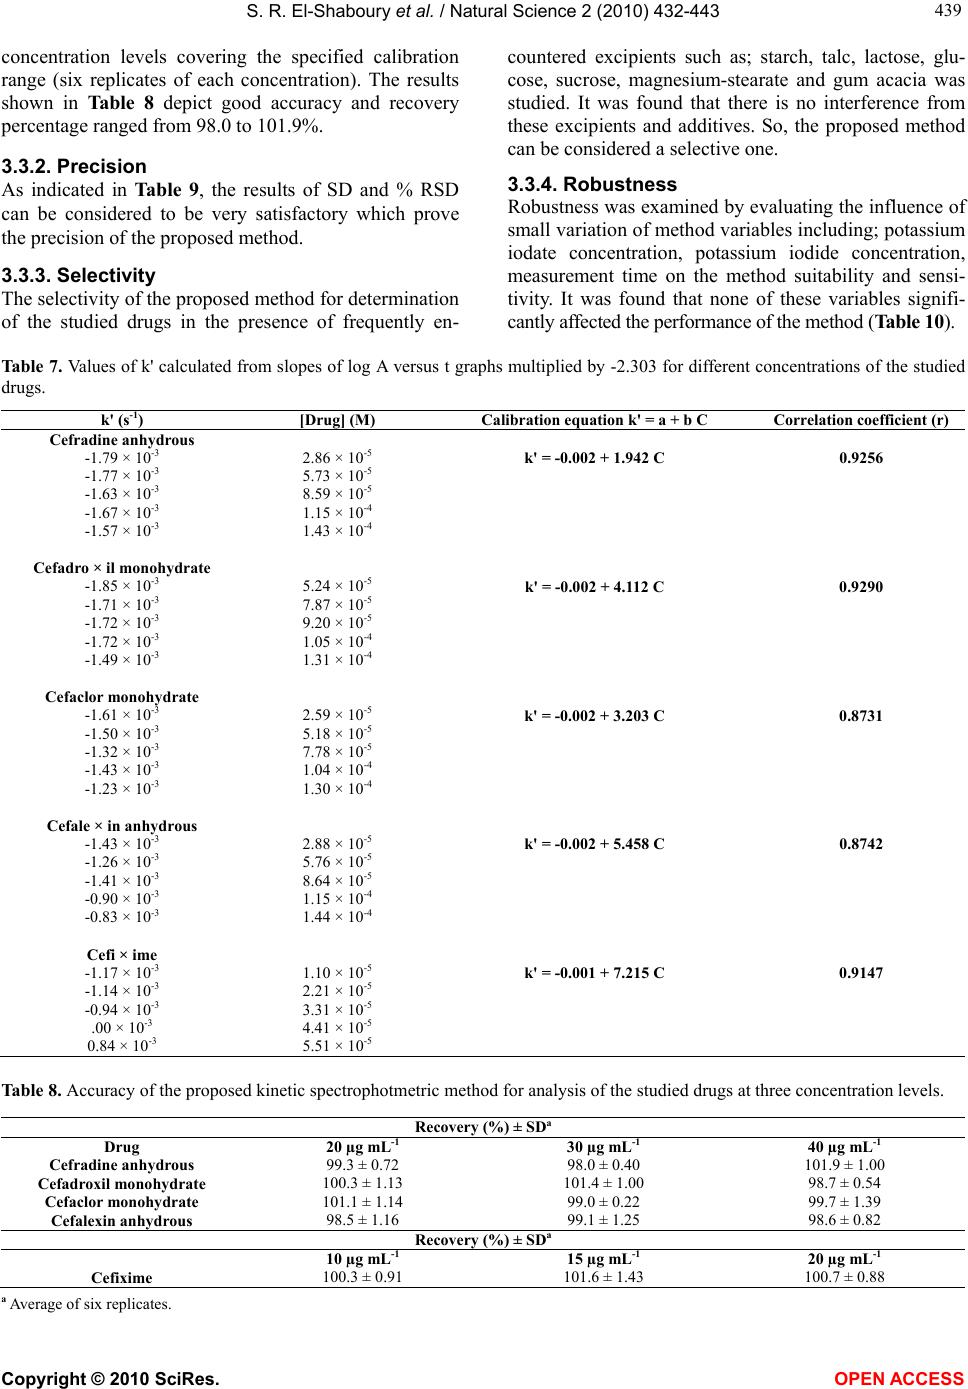 S. R. El-Shaboury et al. / Natural Science 2 (2010) 432-443 Copyright © 2010 SciRes. OPEN ACCESS 439 439 concentration levels covering the specified calibration range (six replicates of each concentration). The results shown in Table 8 depict good accuracy and recovery percentage ranged from 98.0 to 101.9%. 3.3.2. Precision As indicated in Table 9, the results of SD and % RSD can be considered to be very satisfactory which prove the precision of the proposed method. 3.3.3. Selectivity The selectivity of the proposed method for determination of the studied drugs in the presence of frequently en- countered excipients such as; starch, talc, lactose, glu- cose, sucrose, magnesium-stearate and gum acacia was studied. It was found that there is no interference from these excipients and additives. So, the proposed method can be considered a selective one. 3.3.4. Robustness Robustness was examined by evaluating the influence of small variation of method variables including; potassium iodate concentration, potassium iodide concentration, measurement time on the method suitability and sensi- tivity. It was found that none of these variables signifi- cantly affected the performance of the method (Table 10). Table 7. Values of k' calculated from slopes of log A versus t graphs multiplied by -2.303 for different concentrations of the studied drugs. k' (s-1) [Drug] (M) Calibration equation k' = a + b C Correlation coefficient (r) Cefradine anhydrous -1.79 × 10⁻³ 2.86 × 10⁻⁵ k' = -0.002 + 1.942 C 0.9256 -1.77 × 10⁻³ 5.73 × 10⁻⁵ -1.63 × 10⁻³ 8.59 × 10⁻⁵ -1.67 × 10⁻³ 1.15 × 10⁻⁴ -1.57 × 10⁻³ 1.43 × 10⁻⁴ Cefadro × il monohydrate -1.85 × 10⁻³ 5.24 × 10⁻⁵ k' = -0.002 + 4.112 C 0.9290 -1.71 × 10⁻³ 7.87 × 10⁻⁵ -1.72 × 10⁻³ 9.20 × 10⁻⁵ -1.72 × 10⁻³ 1.05 × 10⁻⁴ -1.49 × 10⁻³ 1.31 × 10⁻⁴ Cefaclor monohydrate -1.61 × 10⁻³ 2.59 × 10⁻⁵ k' = -0.002 + 3.203 C 0.8731 -1.50 × 10⁻³ 5.18 × 10⁻⁵ -1.32 × 10⁻³ 7.78 × 10⁻⁵ -1.43 × 10⁻³ 1.04 × 10⁻⁴ -1.23 × 10⁻³ 1.30 × 10⁻⁴ Cefale × in anhydrous -1.43 × 10⁻³ 2.88 × 10⁻⁵ k' = -0.002 + 5.458 C 0.8742 -1.26 × 10⁻³ 5.76 × 10⁻⁵ -1.41 × 10⁻³ 8.64 × 10⁻⁵ -0.90 × 10⁻³ 1.15 × 10⁻⁴ -0.83 × 10⁻³ 1.44 × 10⁻⁴ Cefi × ime -1.17 × 10⁻³ 1.10 × 10⁻⁵ k' = -0.001 + 7.215 C 0.9147 -1.14 × 10⁻³ 2.21 × 10⁻⁵ -0.94 × 10⁻³ 3.31 × 10⁻⁵ .00 × 10-3 4.41 × 10⁻⁵ 0.84 × 10⁻³ 5.51 × 10⁻⁵ Table 8. Accuracy of the proposed kinetic spectrophotmetric method for analysis of the studied drugs at three concentration levels. Recovery (%) ± SDa Drug 20 µg mL-1 30 µg mL-1 40 µg mL-1 Cefradine anhydrous 99.3 ± 0.72 98.0 ± 0.40 101.9 ± 1.00 Cefadroxil monohydrate 100.3 ± 1.13 101.4 ± 1.00 98.7 ± 0.54 Cefaclor monohydrate 101.1 ± 1.14 99.0 ± 0.22 99.7 ± 1.39 Cefalexin anhydrous 98.5 ± 1.16 99.1 ± 1.25 98.6 ± 0.82 Recovery (%) ± SDa 10 µg mL-1 15 µg mL-1 20 µg mL-1 Cefixime 100.3 ± 0.91 101.6 ± 1.43 100.7 ± 0.88 a Average of six replicates. 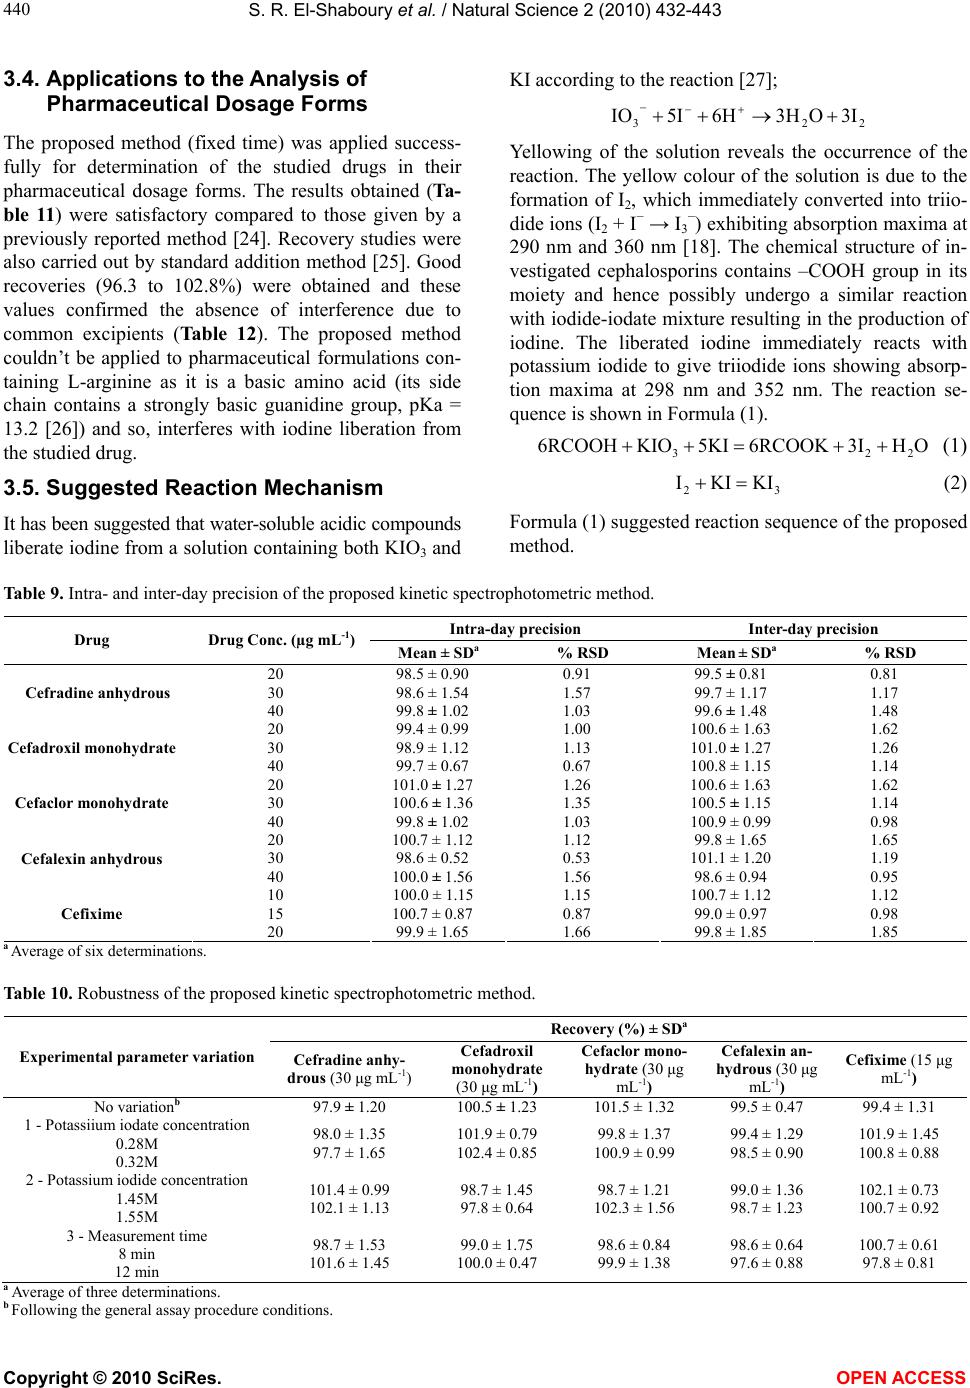 S. R. El-Shaboury et al. / Natural Science 2 (2010) 432-443 Copyright © 2010 SciRes. OPEN ACCESS 440 3.4. Applications to the Analysis of Pharmaceutical Dosage Forms The proposed method (fixed time) was applied success- fully for determination of the studied drugs in their pharmaceutical dosage forms. The results obtained (Ta- ble 11) were satisfactory compared to those given by a previously reported method [24]. Recovery studies were also carried out by standard addition method [25]. Good recoveries (96.3 to 102.8%) were obtained and these values confirmed the absence of interference due to common excipients (Table 12). The proposed method couldn’t be applied to pharmaceutical formulations con- taining L-arginine as it is a basic amino acid (its side chain contains a strongly basic guanidine group, pKa = 13.2 [26]) and so, interferes with iodine liberation from the studied drug. 3.5. Suggested Reaction Mechanism It has been suggested that water-soluble acidic compounds liberate iodine from a solution containing both KIO3 and KI according to the reaction [27]; 223 3IO3H6H5IIO Yellowing of the solution reveals the occurrence of the reaction. The yellow colour of the solution is due to the formation of I2, which immediately converted into triio- dide ions (I2 + I− → I3 −) exhibiting absorption maxima at 290 nm and 360 nm [18]. The chemical structure of in- vestigated cephalosporins contains –COOH group in its moiety and hence possibly undergo a similar reaction with iodide-iodate mixture resulting in the production of iodine. The liberated iodine immediately reacts with potassium iodide to give triiodide ions showing absorp- tion maxima at 298 nm and 352 nm. The reaction se- quence is shown in Formula (1). OH3I6RCOOK5KIKIO6RCOOH 223 (1) 32 KIKII (2) Formula (1) suggested reaction sequence of the proposed method. Table 9. Intra- and inter-day precision of the proposed kinetic spectrophotometric method. Intra-day precision Inter-day precision Drug Drug Conc. (µg mL-1) Mean ± SDa % RSD Mean ± SDa % RSD 20 98.5 ± 0.90 0.91 99.5 ± 0.81 0.81 30 98.6 ± 1.54 1.57 99.7 ± 1.17 1.17 Cefradine anhydrous 40 99.8 ± 1.02 1.03 99.6 ± 1.48 1.48 20 99.4 ± 0.99 1.00 100.6 ± 1.63 1.62 30 98.9 ± 1.12 1.13 101.0 ± 1.27 1.26 Cefadroxil monohydrate 40 99.7 ± 0.67 0.67 100.8 ± 1.15 1.14 20 101.0 ± 1.27 1.26 100.6 ± 1.63 1.62 30 100.6 ± 1.36 1.35 100.5 ± 1.15 1.14 Cefaclor monohydrate 40 99.8 ± 1.02 1.03 100.9 ± 0.99 0.98 20 100.7 ± 1.12 1.12 99.8 ± 1.65 1.65 30 98.6 ± 0.52 0.53 101.1 ± 1.20 1.19 Cefalexin anhydrous 40 100.0 ± 1.56 1.56 98.6 ± 0.94 0.95 10 100.0 ± 1.15 1.15 100.7 ± 1.12 1.12 15 100.7 ± 0.87 0.87 99.0 ± 0.97 0.98 Cefixime 20 99.9 ± 1.65 1.66 99.8 ± 1.85 1.85 a Average of six determinations. Table 10. Robustness of the proposed kinetic spectrophotometric method. Recovery (%) ± SDa Experimental parameter variationCefradine anhy- drous (30 μg mL-1) Cefadroxil monohydrate (30 μg mL-1) Cefaclor mono- hydrate (30 μg mL-1) Cefalexin an- hydrous (30 μg mL-1) Cefixime (15 μg mL-1) No variationb 97.9 ± 1.20 100.5 ± 1.23 101.5 ± 1.32 99.5 ± 0.47 99.4 ± 1.31 1 - Potassiium iodate concentration 0.28M 0.32M 98.0 ± 1.35 97.7 ± 1.65 101.9 ± 0.79 102.4 ± 0.85 99.8 ± 1.37 100.9 ± 0.99 99.4 ± 1.29 98.5 ± 0.90 101.9 ± 1.45 100.8 ± 0.88 2 - Potassium iodide concentration 1.45M 1.55M 101.4 ± 0.99 102.1 ± 1.13 98.7 ± 1.45 97.8 ± 0.64 98.7 ± 1.21 102.3 ± 1.56 99.0 ± 1.36 98.7 ± 1.23 102.1 ± 0.73 100.7 ± 0.92 3 - Measurement time 8 min 12 min 98.7 ± 1.53 101.6 ± 1.45 99.0 ± 1.75 100.0 ± 0.47 98.6 ± 0.84 99.9 ± 1.38 98.6 ± 0.64 97.6 ± 0.88 100.7 ± 0.61 97.8 ± 0.81 a Average of three determinations. b Following the general assay procedure conditions. 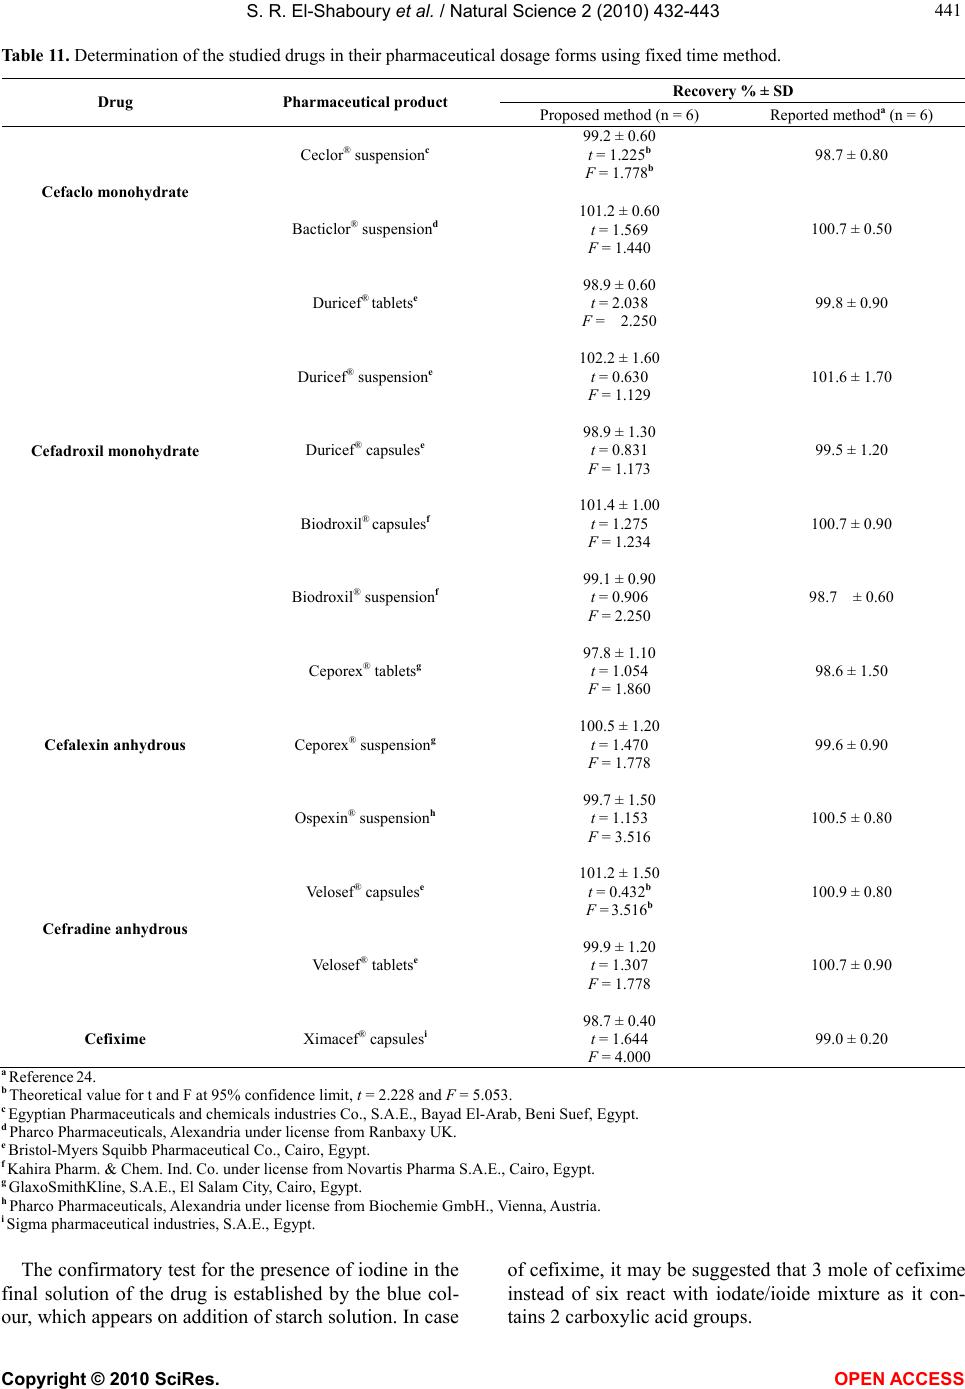 S. R. El-Shaboury et al. / Natural Science 2 (2010) 432-443 Copyright © 2010 SciRes. OPEN ACCESS 441 441 Table 11. Determination of the studied drugs in their pharmaceutical dosage forms using fixed time method. Recovery % ± SD Drug Pharmaceutical product Proposed method (n = 6) Reported methoda (n = 6) Ceclor® suspensionc 99.2 ± 0.60 t = 1.225b F = 1.778b 98.7 ± 0.80 Cefaclo monohydrate Bacticlor® suspensiond 101.2 ± 0.60 t = 1.569 F = 1.440 100.7 ± 0.50 Duricef® tabletse 98.9 ± 0.60 t = 2.038 F = 2.250 99.8 ± 0.90 Duricef® suspensione 102.2 ± 1.60 t = 0.630 F = 1.129 101.6 ± 1.70 Duricef® capsulese 98.9 ± 1.30 t = 0.831 F = 1.173 99.5 ± 1.20 Biodroxil® capsulesf 101.4 ± 1.00 t = 1.275 F = 1.234 100.7 ± 0.90 Cefadroxil monohydrate Biodroxil® suspensionf 99.1 ± 0.90 t = 0.906 F = 2.250 98.7 ± 0.60 Ceporex® tabletsg 97.8 ± 1.10 t = 1.054 F = 1.860 98.6 ± 1.50 Ceporex® suspensiong 100.5 ± 1.20 t = 1.470 F = 1.778 99.6 ± 0.90 Cefalexin anhydrous Ospexin® suspensionh 99.7 ± 1.50 t = 1.153 F = 3.516 100.5 ± 0.80 Ve lo s ef ® capsulese 101.2 ± 1.50 t = 0.432b F = 3.516b 100.9 ± 0.80 Cefradine anhydrous Ve lo s ef ® tabletse 99.9 ± 1.20 t = 1.307 F = 1.778 100.7 ± 0.90 Cefixime Xi macef® capsulesi 98.7 ± 0.40 t = 1.644 F = 4.000 99.0 ± 0.20 a Reference 24. b Theoretical value for t and F at 95% confidence limit, t = 2.228 and F = 5.053. c Egyptian Pharmaceuticals and chemicals industries Co., S.A.E., Bayad El-Arab, Beni Suef, Egypt. d Pharco Pharmaceuticals, Alexandria under license from Ranbaxy UK. e Bristol-Myers Squibb Pharmaceutical Co., Cairo, Egypt. f Kahira Pharm. & Chem. Ind. Co. under license from Novartis Pharma S.A.E., Cairo, Egypt. g GlaxoSmithKline, S.A.E., El Salam City, Cairo, Egypt. h Pharco Pharmaceuticals, Alexandria under license from Biochemie GmbH., Vienna, Austria. i Sigma pharmaceutical industries, S.A.E., Egypt. The confirmatory test for the presence of iodine in the final solution of the drug is established by the blue col- our, which appears on addition of starch solution. In case of cefixime, it may be suggested that 3 mole of cefixime instead of six react with iodate/ioide mixture as it con- tains 2 carboxylic acid groups. 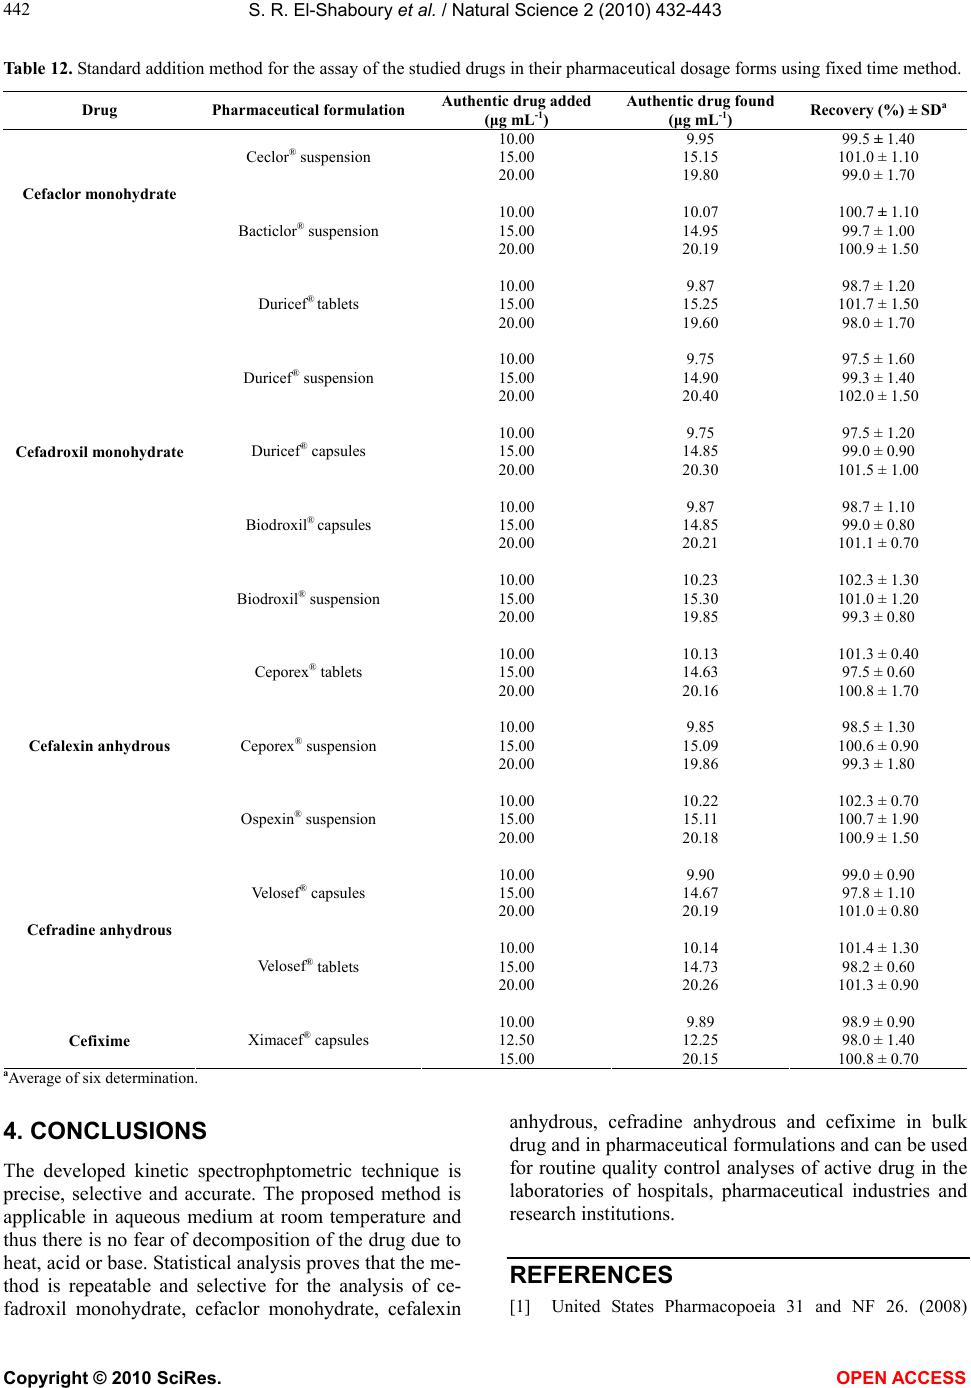 S. R. El-Shaboury et al. / Natural Science 2 (2010) 432-443 Copyright © 2010 SciRes. OPEN ACCESS 442 Table 12. Standard addition method for the assay of the studied drugs in their pharmaceutical dosage forms using fixed time method. Drug Pharmaceutical formulation Authentic drug added (μg mL-1) Authentic drug found (μg mL-1) Recovery (%) ± SDa 10.00 9.95 99.5 ± 1.40 15.00 15.15 101.0 ± 1.10 Ceclor® suspension 20.00 19.80 99.0 ± 1.70 10.00 10.07 100.7 ± 1.10 15.00 14.95 99.7 ± 1.00 Cefaclor monohydrate Bacticlor® suspension 20.00 20.19 100.9 ± 1.50 10.00 9.87 98.7 ± 1.20 15.00 15.25 101.7 ± 1.50 Duricef® tablets 20.00 19.60 98.0 ± 1.70 10.00 9.75 97.5 ± 1.60 15.00 14.90 99.3 ± 1.40 Duricef® suspension 20.00 20.40 102.0 ± 1.50 10.00 9.75 97.5 ± 1.20 15.00 14.85 99.0 ± 0.90 Duricef® capsules 20.00 20.30 101.5 ± 1.00 10.00 9.87 98.7 ± 1.10 15.00 14.85 99.0 ± 0.80 Biodroxil® capsules 20.00 20.21 101.1 ± 0.70 10.00 10.23 102.3 ± 1.30 15.00 15.30 101.0 ± 1.20 Cefadroxil monohydrate Biodroxil® suspension 20.00 19.85 99.3 ± 0.80 10.00 10.13 101.3 ± 0.40 15.00 14.63 97.5 ± 0.60 Ceporex® tablets 20.00 20.16 100.8 ± 1.70 10.00 9.85 98.5 ± 1.30 15.00 15.09 100.6 ± 0.90 Ceporex® suspension 20.00 19.86 99.3 ± 1.80 10.00 10.22 102.3 ± 0.70 15.00 15.11 100.7 ± 1.90 Cefalexin anhydrous Ospexin® suspension 20.00 20.18 100.9 ± 1.50 10.00 9.90 99.0 ± 0.90 15.00 14.67 97.8 ± 1.10 Ve lo s ef ® capsules 20.00 20.19 101.0 ± 0.80 10.00 10.14 101.4 ± 1.30 15.00 14.73 98.2 ± 0.60 Cefradine anhydrous Ve lo s ef ® tablets 20.00 20.26 101.3 ± 0.90 10.00 9.89 98.9 ± 0.90 12.50 12.25 98.0 ± 1.40 Cefixime Ximacef® capsules 15.00 20.15 100.8 ± 0.70 aAverage of six determination. 4. CONCLUSIONS The developed kinetic spectrophptometric technique is precise, selective and accurate. The proposed method is applicable in aqueous medium at room temperature and thus there is no fear of decomposition of the drug due to heat, acid or base. Statistical analysis proves that the me- thod is repeatable and selective for the analysis of ce- fadroxil monohydrate, cefaclor monohydrate, cefalexin anhydrous, cefradine anhydrous and cefixime in bulk drug and in pharmaceutical formulations and can be used for routine quality control analyses of active drug in the laboratories of hospitals, pharmaceutical industries and research institutions. REFERENCES [1] United States Pharmacopoeia 31 and NF 26. (2008) 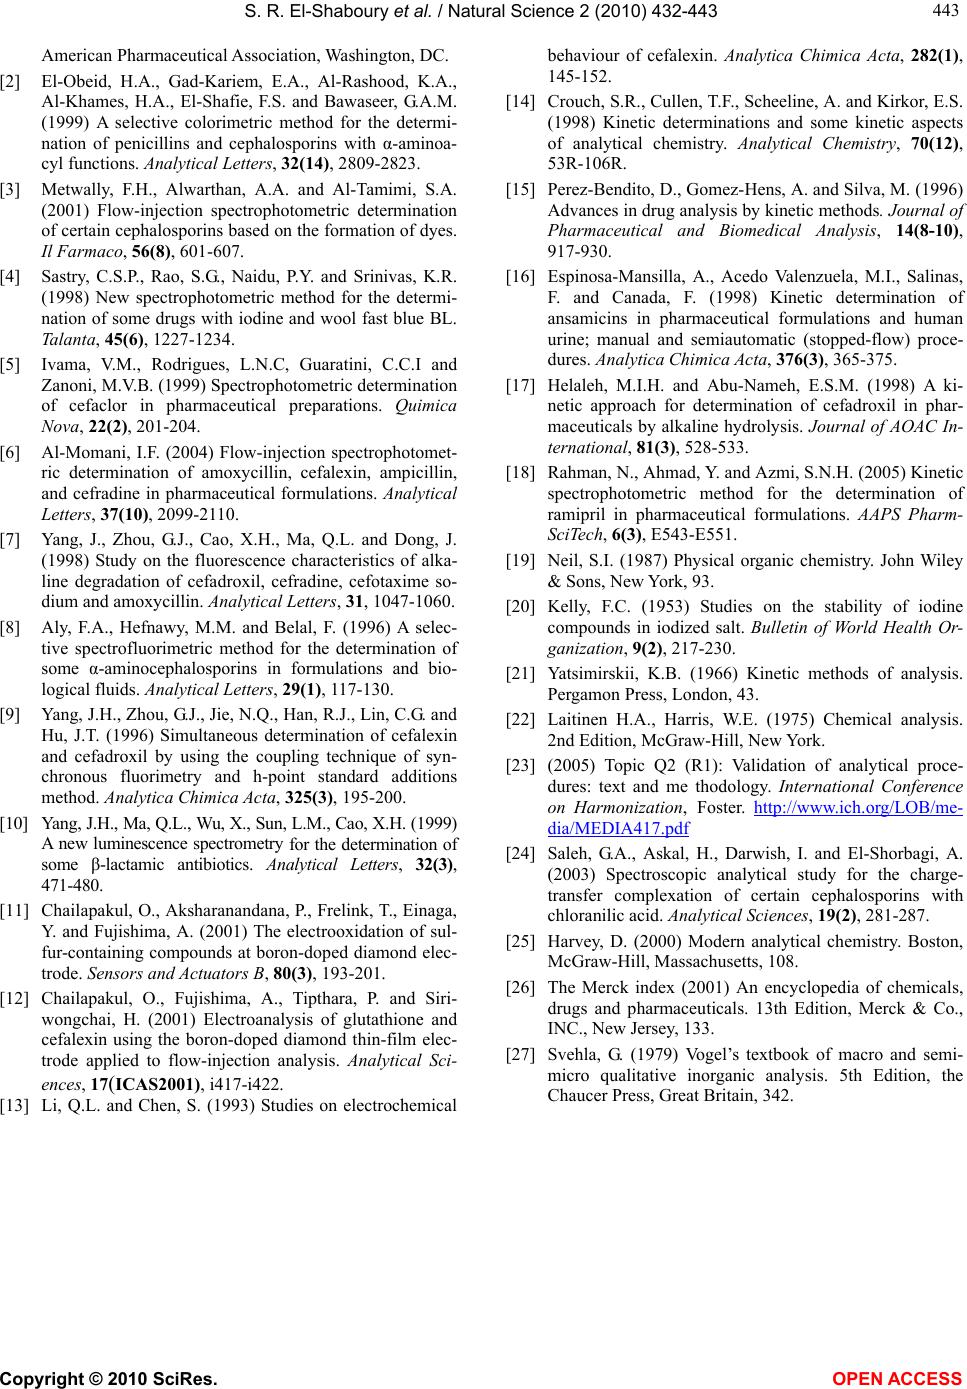 S. R. El-Shaboury et al. / Natural Science 2 (2010) 432-443 Copyright © 2010 SciRes. OPEN ACCESS 443 443 American Pharmaceutical Association, Washington, DC. [2] El-Obeid, H.A., Gad-Kariem, E.A., Al-Rashood, K.A., Al-Khames, H.A., El-Shafie, F.S. and Bawaseer, G.A.M. (1999) A selective colorimetric method for the determi- nation of penicillins and cephalosporins with α-aminoa- cyl functions. Analytical Letters, 32(14), 2809-2823. [3] Metwally, F.H., Alwarthan, A.A. and Al-Tamimi, S.A. (2001) Flow-injection spectrophotometric determination of certain cephalosporins based on the formation of dyes. Il Farmaco, 56(8), 601-607. [4] Sastry, C.S.P., Rao, S.G., Naidu, P.Y. and Srinivas, K.R. (1998) New spectrophotometric method for the determi- nation of some drugs with iodine and wool fast blue BL. Talanta, 45(6), 1227-1234. [5] Ivama, V.M., Rodrigues, L.N.C, Guaratini, C.C.I and Zanoni, M.V.B. (1999) Spectrophotometric determination of cefaclor in pharmaceutical preparations. Quimica Nova, 22(2), 201-204. [6] Al-Momani, I.F. (2004) Flow-injection spectrophotomet- ric determination of amoxycillin, cefalexin, ampicillin, and cefradine in pharmaceutical formulations. Analytical Letters, 37(10), 2099-2110. [7] Yang, J., Zhou, G.J., Cao, X.H., Ma, Q.L. and Dong, J. (1998) Study on the fluorescence characteristics of alka- line degradation of cefadroxil, cefradine, cefotaxime so- dium and amoxycillin. Analytical Letters, 31, 1047-1060. [8] Aly, F.A., Hefnawy, M.M. and Belal, F. (1996) A selec- tive spectrofluorimetric method for the determination of some α-aminocephalosporins in formulations and bio- logical fluids. Analytical Letters, 29(1), 117-130. [9] Yang, J.H., Zhou, G.J., Jie, N.Q., Han, R.J., Lin, C.G. and Hu, J.T. (1996) Simultaneous determination of cefalexin and cefadroxil by using the coupling technique of syn- chronous fluorimetry and h-point standard additions method. Analytica Chimica Acta, 325(3), 195-200. [10] Yang, J.H., Ma, Q.L., Wu, X., Sun, L.M., Cao, X.H. (1999) A new luminescence spectrometry for the determination of some β-lactamic antibiotics. Analytical Letters, 32(3), 471-480. [11] Chailapakul, O., Aksharanandana, P., Frelink, T., Einaga, Y. and Fujishima, A. (2001) The electrooxidation of sul- fur-containing compounds at boron-doped diamond elec- trode. Sensors and Actuators B, 80(3), 193-201. [12] Chailapakul, O., Fujishima, A., Tipthara, P. and Siri- wongchai, H. (2001) Electroanalysis of glutathione and cefalexin using the boron-doped diamond thin-film elec- trode applied to flow-injection analysis. Analytical Sci- ences, 17(ICAS2001), i417-i422. [13] Li, Q.L. and Chen, S. (1993) Studies on electrochemical behaviour of cefalexin. Analytica Chimica Acta, 282(1), 145-152. [14] Crouch, S.R., Cullen, T.F., Scheeline, A. and Kirkor, E.S. (1998) Kinetic determinations and some kinetic aspects of analytical chemistry. Analytical Chemistry, 70(12), 53R-106R. [15] Perez-Bendito, D., Gomez-Hens, A. and Silva, M. (1996) Advances in drug analysis by kinetic methods. Journal of Pharmaceutical and Biomedical Analysis, 14(8-10), 917-930. [16] Espinosa-Mansilla, A., Acedo Valenzuela, M.I., Salinas, F. and Canada, F. (1998) Kinetic determination of ansamicins in pharmaceutical formulations and human urine; manual and semiautomatic (stopped-flow) proce- dures. Analytica Chimica Acta, 376(3), 365-375. [17] Helaleh, M.I.H. and Abu-Nameh, E.S.M. (1998) A ki- netic approach for determination of cefadroxil in phar- maceuticals by alkaline hydrolysis. Journal of AOAC In- ternational, 81(3), 528-533. [18] Rahman, N., Ahmad, Y. and Azmi, S.N.H. (2005) Kinetic spectrophotometric method for the determination of ramipril in pharmaceutical formulations. AAPS Pharm- SciTech, 6(3), E543-E551. [19] Neil, S.I. (1987) Physical organic chemistry. John Wiley & Sons, New York, 93. [20] Kelly, F.C. (1953) Studies on the stability of iodine compounds in iodized salt. Bulletin of World Health Or- ganization, 9(2), 217-230. [21] Yatsimirskii, K.B. (1966) Kinetic methods of analysis. Pergamon Press, London, 43. [22] Laitinen H.A., Harris, W.E. (1975) Chemical analysis. 2nd Edition, McGraw-Hill, New York. [23] (2005) Topic Q2 (R1): Validation of analytical proce- dures: text and me thodology. International Conference on Harmonization, Foster. http://www.ich.org/LOB/me- dia/MEDIA417.pdf [24] Saleh, G.A., Askal, H., Darwish, I. and El-Shorbagi, A. (2003) Spectroscopic analytical study for the charge- transfer complexation of certain cephalosporins with chloranilic acid. Analytical Sciences, 19(2), 281-287. [25] Harvey, D. (2000) Modern analytical chemistry. Boston, McGraw-Hill, Massachusetts, 108. [26] The Merck index (2001) An encyclopedia of chemicals, drugs and pharmaceuticals. 13th Edition, Merck & Co., INC., New Jersey, 133. [27] Svehla, G. (1979) Vogel’s textbook of macro and semi- micro qualitative inorganic analysis. 5th Edition, the Chaucer Press, Great Britain, 342. |