

Paper Menu >>
Journal Menu >>
 Creative Education 2012. Vol.3, No.2, 224-227 Published Online April 2012 in SciRes (http://www.SciRP.org/journal/ce) http://dx.doi.org/10.4236/ce.2012.32035 Copyright © 2012 SciRes. 224 The Relationship between Institutional Efficiency and Instructional Quality in Higher Education Susanne Rassouli-Currier University of Central Oklahoma, Edmond, USA Email: [email protected] Received March 4th, 2012; revised April 2nd, 2012; accepted April 12th, 2012 Wage setting methodologies for university faculty may be merit/market based or administered. Failure to exploit the fact that faculty productivity depends on abilities and wages results in inefficient use of uni- versity budgets. If such inefficiencies exist it suggests suboptimal productivity of the existing faculty and the inability to attract new qualified faculty. As motivation for this analysis, a simple model of university faculty “output” maximization is presented. Efficient budget allocation requires that faculty compensation be structured so that marginal productivities are equated across faculty. This paper examines and com- pares the efficiency of several regional universities in the US, identified as “peers”, employing the Data Envelopment Analysis (DEA) estimation method. The results suggest the existence of inefficiencies and more notably, that the homogeneity assumption regarding the peers is questionable. Keywords: Salary; Efficiency; DEA; Higher Education; Education Administration Introduction and Related Literature The topic of university faculty salaries has been addressed frequently through research with varying focal points of interest. Cohn (1973) develops a multiple regression model to analyze the factors that might have an effect on faculty salaries. Al- though the empirical results of this study are dated and of lim- ited applicability to the current economic situation of university professors and their pay, many of the model’s independent variables that are identified still have explanatory power today. These include the type of institution, whether it is public or private, geographic location, quality measures, institution size, and state per capita income. The variable that Cohn finds to have the greatest effect on faculty salaries is that of institution quality. Tuckman and Tuckman (1976) also use regression methods “to analyze the determinants of salary structure at American universities”. The explanatory variables of their model empha- size the rate and amount that faculty publish, faculty personal characteristics such as gender and age, the university’s geo- graphic location, and the area of faculty expertise. Two of the more definitive outcomes are that publishing and research raise salaries compared to teaching and that academic field correlates to a significant variation in faculty salaries. Hoenack (1982) uses a theoretical approach to analyze how prices affect the choices made by faculty, students, legislators, and others involved in higher education with regard to the effi- cient use of resources. He concludes that inefficiency results from the existing prices, and he suggests how efficiency could be improved through changes in prices. Alexander (2001) analyzes the impact that the growing dis- parity between faculty salaries at private universities compared to those at public universities is having on the ability of public institutions to attract and retain top-notch faculty. He describes the potential for the development of two separate higher educa- tion systems, one private and the other public. As private uni- versities are better able to compete financially, there exists a possible “brain drain” as higher quality faculty migrate toward better salaries. The differential between faculty salaries at pub- lic and private universities is reported by Smallwood (2006) from a survey conducted by the College and University Profes- sional Association (CUPA) for Human Resources. This survey reveals that salaries for 2005-2006 increased by 3.7 percent at private universities compared to only 3.1 percent at public uni- versities. In a series of articles contained in the ASHE-ERIC Higher Education Report (2001) several aspects of faculty compensa- tion systems are addressed. The first article describes how the quality of an institution is related to how well the institution achieves its self-stated mission. Its mission is heavily depend- ent on the faculty, which in turn is strongly affected by the faculty compensation system. Faculty compensation is deter- mined by a variety of factors, both external and internal. Nota- bly, one of the internal factors cited is “market pay in the disci- pline”. The second article describes the three main types of faculty compensation systems: 1) the contract salary system or merit pay; 2) the single salary system; and 3) nontraditional faculty compensation systems. The third article describes the commonly used arguments in favor of either merit pay or the single salary system. The fourth article describes the advan- tages and disadvantages of the three compensation systems mentioned above. Interestingly, one of the primary disadvan- tages of the single salary compensation system is listed as “a lack of efficiency in the use of human resources”. With regard to the methods that have been developed and utilized to measure technical and/or allocative inefficiency, the literature is replete with a history of scholarly contributions. Some of the more notable and most frequently cited of these include; Farrell (1957), Aigner et al., (1977), Kumbhakar and Wang (2006) among others. This paper first describes a simple microeconomic model of 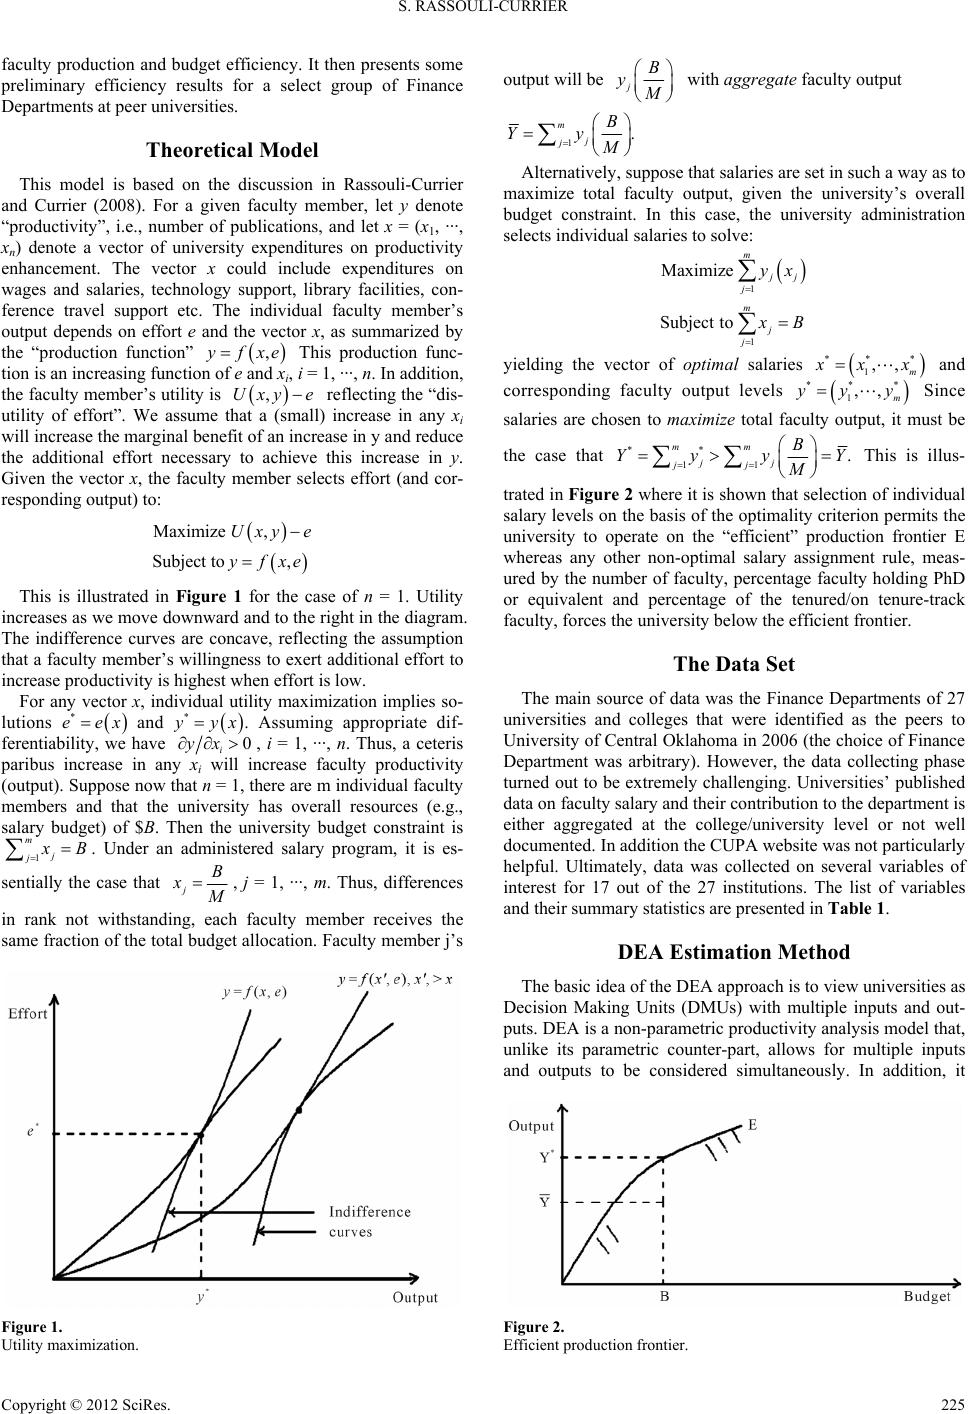 S. RASSOULI-CURRIER faculty production and budget efficiency. It then presents some preliminary efficiency results for a select group of Finance Departments at peer universities. Theoretical Model This model is based on the discussion in Rassouli-Currier and Currier (2008). For a given faculty member, let y denote “productivity”, i.e., number of publications, and let x = (x1, ···, xn) denote a vector of university expenditures on productivity enhancement. The vector x could include expenditures on wages and salaries, technology support, library facilities, con- ference travel support etc. The individual faculty member’s output depends on effort e and the vector x, as summarized by the “production function” ,yfxe This production func- tion is an increasing function of e and xi, i = 1, ···, n. In addition, the faculty member’s utility is ,Uxy e reflecting the “dis- utility of effort”. We assume that a (small) increase in any xi will increase the marginal benefit of an increase in y and reduce the additional effort necessary to achieve this increase in y. Given the vector x, the faculty member selects effort (and cor- responding output) to: Maximize , Subject to , Uxy e yfxe This is illustrated in Figure 1 for the case of n = 1. Utility increases as we move downward and to the right in the diagram. The indifference curves are concave, reflecting the assumption that a faculty member’s willingness to exert additional effort to increase productivity is highest when effort is low. For any vector x, individual utility maximization implies so- lutions * eex and * yyx. Assuming appropriate dif- ferentiability, we have 0 i yx, i = 1, ···, n. Thus, a ceteris paribus increase in any xi will increase faculty productivity (output). Suppose now that n = 1, there are m individual faculty members and that the university has overall resources (e.g., salary budget) of $B. Then the university budget constraint is 1 m j j x B . Under an administered salary program, it is es- sentially the case that j x B M , j = 1, ···, m. Thus, differences in rank not withstanding, each faculty member receives the same fraction of the total budget allocation. Faculty member j’s Figure 1. Utility maximization. output will be j B y M with aggregate faculty output 1. m j j B Yy M Alternatively, suppose that salaries are set in such a way as to maximize total faculty output, given the university’s overall budget constraint. In this case, the university administration selects individual salaries to solve: 1 1 Maximize Subject to m j j j m j j yx x B yielding the vector of optimal salaries ** * 1,, m x xx ** * ,,yy y and corresponding faculty output levels Since salaries are chosen to maximize total faculty output, it must be 1m the case that ** 11 . mm jj jj B Yyy M Y This is illus- trated in Figure 2 where it is shown that selection of individual salary levels on the basis of the optimality criterion permits the university to operate on the “efficient” production frontier E whereas any other non-optimal salary assignment rule, meas- ured by the number of faculty, percentage faculty holding PhD or equivalent and percentage of the tenured/on tenure-track faculty, forces the university below the efficient frontier. The Data Set The main source of data was the Finance Departments of 27 universities and colleges that were identified as the peers to University of Central Oklahoma in 2006 (the choice of Finance Department was arbitrary). However, the data collecting phase turned out to be extremely challenging. Universities’ published data on faculty salary and their contribution to the department is either aggregated at the college/university level or not well documented. In addition the CUPA website was not particularly helpful. Ultimately, data was collected on several variables of interest for 17 out of the 27 institutions. The list of variables and their summary statistics are presented in Table 1. DEA Estimation Method The basic idea of the DEA approach is to view universities as Decision Making Units (DMUs) with multiple inputs and out- puts. DEA is a non-parametric productivity analysis model that, unlike its parametric counter-part, allows for multiple inputs and outputs to be considered simultaneously. In addition, it Figure 2. Efficient production frontier. Copyright © 2012 SciRes. 225 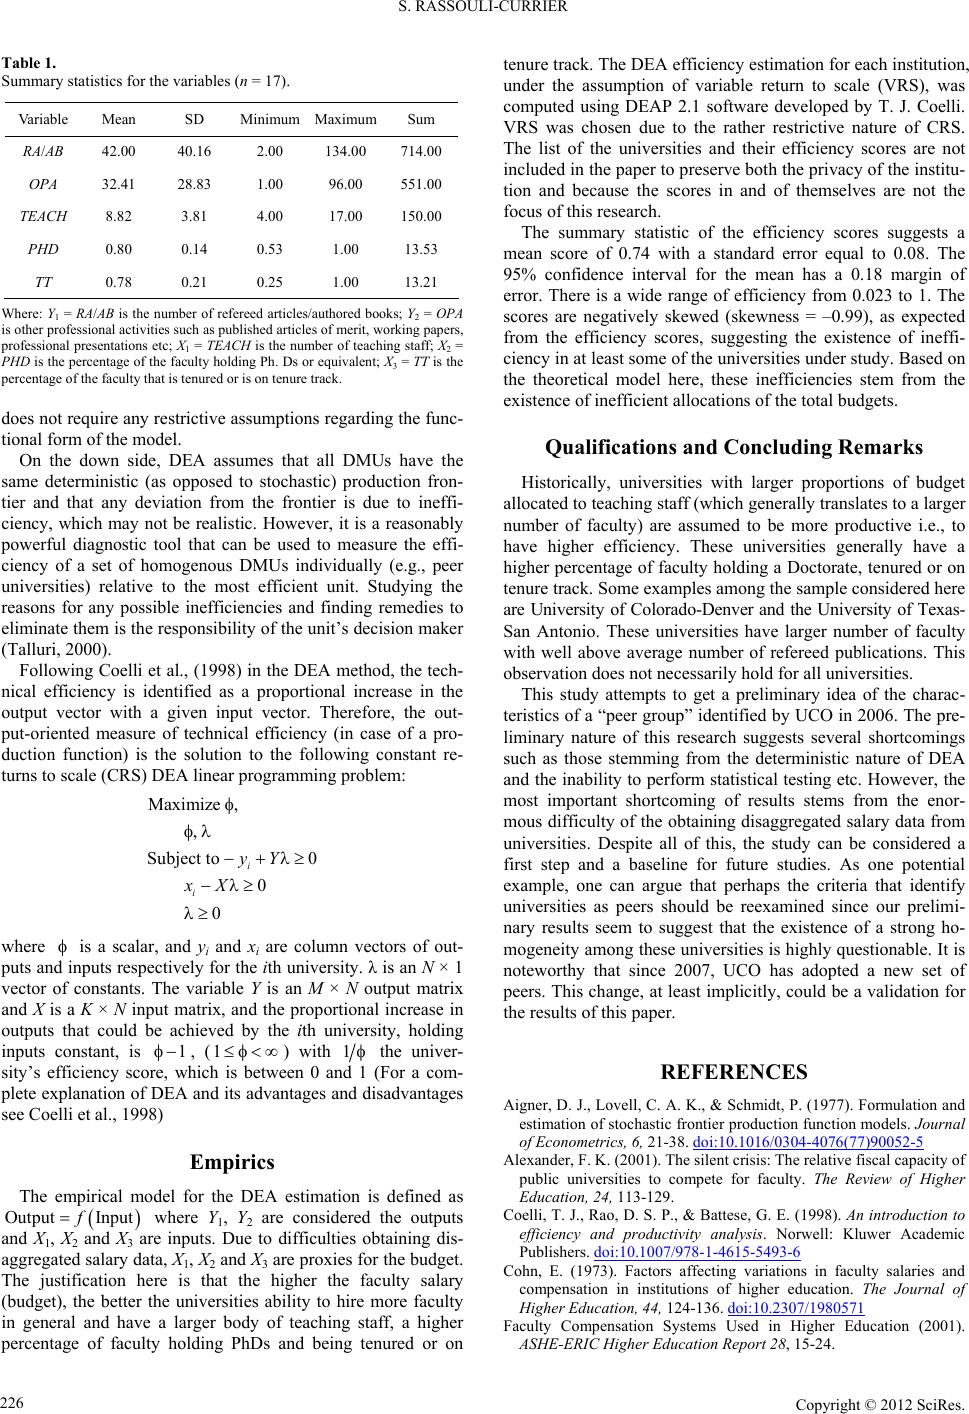 S. RASSOULI-CURRIER Table 1. Summary statistics for the variables (n = 17). Variable Mean SD Minimum Maximum Sum RA/AB 42.00 40.16 2.00 134.00 714.00 OPA 32.41 28.83 1.00 96.00 551.00 TEACH 8.82 3.81 4.00 17.00 150.00 PHD 0.80 0.14 0.53 1.00 13.53 TT 0.78 0.21 0.25 1.00 13.21 Where: Y1 = RA/AB is the number of refereed articles/authored books; Y2 = OPA is other professional activities such as published articles of merit, working papers, professional presentations etc; X1 = TEACH is the number of teaching staff; X2 = PHD is the percentage of the faculty holding Ph. Ds or equivalent; X3 = TT is the percentage of the faculty that is tenured or is on tenure track. does not require any restrictive assumptions regarding the func- tional form of the model. On the down side, DEA assumes that all DMUs have the same deterministic (as opposed to stochastic) production fron- tier and that any deviation from the frontier is due to ineffi- ciency, which may not be realistic. However, it is a reasonably powerful diagnostic tool that can be used to measure the effi- ciency of a set of homogenous DMUs individually (e.g., peer universities) relative to the most efficient unit. Studying the reasons for any possible inefficiencies and finding remedies to eliminate them is the responsibility of the unit’s decision maker (Talluri, 2000). Following Coelli et al., (1998) in the DEA method, the tech- nical efficiency is identified as a proportional increase in the output vector with a given input vector. Therefore, the out- put-oriented measure of technical efficiency (in case of a pro- duction function) is the solution to the following constant re- turns to scale (CRS) DEA linear programming problem: Maximize , , Subject to0 0 0 i i yY xX where is a scalar, and yi and xi are column vectors of out- puts and inputs respectively for the ith university. λ is an N × 1 vector of constants. The variable Y is an M × N output matrix and X is a K × N input matrix, and the proportional increase in outputs that could be achieved by the ith university, holding inputs constant, is , (1) with 1 1 the univer- sity’s efficiency score, which is between 0 and 1 (For a com- plete explanation of DEA and its advantages and disadvantages see Coelli et al., 1998) Empirics The empirical model for the DEA estimation is defined as Output Inputf where Y1, Y2 are considered the outputs and X1, X2 and X3 are inputs. Due to difficulties obtaining dis- aggregated salary data, X1, X2 and X3 are proxies for the budget. The justification here is that the higher the faculty salary (budget), the better the universities ability to hire more faculty in general and have a larger body of teaching staff, a higher percentage of faculty holding PhDs and being tenured or on tenure track. The DEA efficiency estimation for each institution, under the assumption of variable return to scale (VRS), was computed using DEAP 2.1 software developed by T. J. Coelli. VRS was chosen due to the rather restrictive nature of CRS. The list of the universities and their efficiency scores are not included in the paper to preserve both the privacy of the institu- tion and because the scores in and of themselves are not the focus of this research. The summary statistic of the efficiency scores suggests a mean score of 0.74 with a standard error equal to 0.08. The 95% confidence interval for the mean has a 0.18 margin of error. There is a wide range of efficiency from 0.023 to 1. The scores are negatively skewed (skewness = –0.99), as expected from the efficiency scores, suggesting the existence of ineffi- ciency in at least some of the universities under study. Based on the theoretical model here, these inefficiencies stem from the existence of inefficient allocations of the total budgets. Qualifications and Concluding Remarks Historically, universities with larger proportions of budget allocated to teaching staff (which generally translates to a larger number of faculty) are assumed to be more productive i.e., to have higher efficiency. These universities generally have a higher percentage of faculty holding a Doctorate, tenured or on tenure track. Some examples among the sample considered here are University of Colorado-Denver and the University of Texas- San Antonio. These universities have larger number of faculty with well above average number of refereed publications. This observation does not necessarily hold for all universities. This study attempts to get a preliminary idea of the charac- teristics of a “peer group” identified by UCO in 2006. The pre- liminary nature of this research suggests several shortcomings such as those stemming from the deterministic nature of DEA and the inability to perform statistical testing etc. However, the most important shortcoming of results stems from the enor- mous difficulty of the obtaining disaggregated salary data from universities. Despite all of this, the study can be considered a first step and a baseline for future studies. As one potential example, one can argue that perhaps the criteria that identify universities as peers should be reexamined since our prelimi- nary results seem to suggest that the existence of a strong ho- mogeneity among these universities is highly questionable. It is noteworthy that since 2007, UCO has adopted a new set of peers. This change, at least implicitly, could be a validation for the results of this paper. REFERENCES Aigner, D. J., Lovell, C. A. K., & Schmidt, P. (1977). Formulation and estimation of stochastic frontier production function models. Journal of Econometrics, 6, 21-38. doi:10.1016/0304-4076(77)90052-5 Alexander, F. K. (2001). The silent crisis: The relative fiscal capacity of public universities to compete for faculty. The Review of Higher Education, 24, 113-129. Coelli, T. J., Rao, D. S. P., & Battese, G. E. (1998). An introduction to efficiency and productivity analysis. Norwell: Kluwer Academic Publishers. doi:10.1007/978-1-4615-5493-6 Cohn, E. (1973). Factors affecting variations in faculty salaries and compensation in institutions of higher education. The Journal of Higher Education, 44, 124-136. doi:10.2307/1980571 Faculty Compensation Systems Used in Higher Education (2001). ASHE-ERIC Higher Ed uca ti on Report 28, 15-24. Copyright © 2012 SciRes. 226  S. RASSOULI-CURRIER Copyright © 2012 SciRes. 227 Hoenack, S. A. (1982). Pricing and efficiency in higher education. The Journal of Higher Education, 53, 403-418. doi:10.2307/1981606 Kumbhakar, Subal, C., & Wang, H.-J. (2006). Estimation of technical and allocative inefficiency: A primal system approach. Journal of Econometrics, 134, 419-440. doi:10.1016/j.jeconom.2005.07.001 Rassouli-Currier, S., & Currier, K. (2008). Inefficiency in higher: An empirical application to peer regional universities. Southwestern Economic Review: Research Notes. Smallwood, S. (2006). Faculty salaries rise by 3.4%; Law professors still earn the most. Chronicle of Higher Edu c ation, 52, A12. Talluri, S. (2000). Data envelopment analysis: Models and extensions. Decision Line, 31, 8-11. Tuckman, B. H., & Tuckman, H. P. (1976). The structure of salaries at american universities. The Journa l of Higher Education, 47, 51-64. doi:10.2307/1978713 |