

Paper Menu >>
Journal Menu >>
 Open Journal of Statistics, 2012, 2, 184-187 http://dx.doi.org/10.4236/ojs.2012.22021 Published Online April 2012 (http://www.SciRP.org/journal/ojs) On a Generalized Model in Accelerated Life Testing Eduardo L. Cruz1, Adolfo M. De Guzman2 1Department of Epidemiology and Biostatistics, University of the Philippines, Manila, Philippines 2School of Statistics, University of the Philippines, Quezon City, Philippines Email: [email protected] Received January 30, 2012; revised February 29, 2012; accepted March 14, 2012 ABSTRACT The main objective of accelerated life tests in this setting is the recovery of the distribution of the random variable rep- resenting lifetime which is difficult to observe at a certain level of a given stress factor. A general model for accelerated life test is proposed that utilizes the inverse prob lem approach, that is, the variable is observ e at different level/s and the transfer function is used to recover the elusive random variable (life time). The problem then is reduced to finding the transfer function. We derive some properties of the proposed general model. The Lognormal distribution and the Ar- rhenius model for lifetime are used as examples. Its relationship with the Cox proportional hazards model is also dis- cussed. Keywords: Accelerated Life Test; Arrhenius Model; Inverse Problem 1. Introduction From the point of view of production and reliability en- gineers, accelerated life testing is an important aspect of product development, quality control and improvement. Accelerated life testing is accomplished by applying in- creased stress on the product or product component. It is intended to produce data on strength and on lifetime of material components and systems. For an excellent but elementary exposition on this, the reader is referred to Nelson [1]. Accelerated life testing is also very interesting from the point of view of theory. Most lifetime data suffer from the censoring problem of statistics. Lifetime obser- vations usually exceed the interest time of the observer or even his own lifetime. Accelerated life tests, however, are performed to destruction thereby eliminating cen- sored observations. The analysis of censored or incom- plete data requires a modification of the usual statistical methodology of independent and identically distributed observations and their uncensored generalizations. Re- cent developments point to the counting process approach with the use of martingales as introduced by Aalen [2] for analyzing survival or lifetime data. The audience is referred to Anderson, Borgen, Gill and Keiding [3] and Fleming and Harrington [4] for a comprehensive treat- ment. The first volume covers extensively both theory and applications of the counting process approach to sur- vival analysis while the second volu me treats the analysis of clinical data via the martingale approach. Both books require some amount of mathematical as well as statisti- cal sophistication. It takes more time for this approach to be a practical statistical technology. An alternative to the counting approach is provided by the Accelerated Life Testing in some interesting cases. This is so because it reduces the number of incomplete observations and even eliminate them. Section 2 of this paper describes a generalized model for accelerated life testing. Its properties are stated and discussed in Section 3 where some examples are also provided. Section 4 gives some concluding remarks and future work. 2. A Generalized Model for Accelerated Life Test Let X be a nonnegative random variable that represents lifetime in the normal condition, that is, without any stress applied to it, with unknown distribution F. Suppose stress is applied on X and the observations say, 12 X ,,, s sns XX :S S are made from a distribution, say Fs. This setting is an example of the inverse problem ap- proach in statistics where the stress S is a known operator. That is, X X:S SF F ,,, or , (1) in some space of random variables. Here the stress s may have K levels, i.e. 12 K s ss. An approach to accelerated life test model is given by Cox and Oakes [5] and Barlow and Sheuer [6] and also appears in Gnedenko, et al. [7]. This is described as fol- lows. Denote a failure time distribution function under a C opyright © 2012 SciRes. OJS  E. L. CRUZ ET AL. 185 normal stress condition by F0(·). The accelerated life time transformation is given in terms of , F tz 0 ,, and F0(·) by the relat ionship F tzF tzA ,zA ,zA , , (2) where is a positive function (or acceleration function) connecting “time to failure” with a stress factor z, and A is a vector of unknown parameters. For z = 0, is assumed equal to 1. This relationship is a scale transformation where a change in stress does not result in a chang e in the sh ape of the distribution function but changes its scale only. This relationship can be writ- ten in terms of the acceleration function as g tzAt . (3) In other words, the relationship above is linear with a time acceleration function . We now propose a model for accelerated life test gen- eralizes the relationship in (3). This general model is expressed in terms of random variables and thus is sim- pler in structure. Let S be a nonempty set whose elements we will refer to as stress space. For example, in the Ar- rhenius model, S is the set of nonnegative real numbers representing temperature. We define the proposed model by , s X As X , , (4) where X is the random variable under normal use, is a vector of parameters, s S and A s is called the scaling or acceleration function which is a monotone function continuous from the right. This model is a sto- chastic process S : X sS and will be called a general lifetime model with stress space S. The model says the random lifetime S X depends on the stress s, where stress is a state or configuration of stress factors belonging to some known stress space S. Information on the stress space should be available in the underlying field such as medicine for clinical trials, psychology for behavioral studies, chemistry for phenomena depending on clinical reactions, to name a few. Two situations arise from this model: first, if stress s is fixed or controlled, this model is interpreted as a general accelerated life test model. If s is random, the model is known as the survival model with covariates. In this pa- per we consider only the first case where stress s is fixed. We will refer to this model as the Generalized Model for Accelerated Life Testing (GMALT). It will be shown how this model relates to the well-known Arrhenius model in reliability engineering. The Arrhenius model is widely used to model product life as a function of tem- perature. Applications include electrical insulations, solid state and semiconductor devices, battery cells, and in- candescent lamp filaments. 3. Elementary Properties of the GMALT and Some Examples As mentioned in the introduction, the main advantage of the proposed model which is expressed as a scaling of random variables is that its properties can be studied more conveniently. In this section we present some ana- lytic properties of the proposed model and state them as propositions. 3.1. Mean and Covariance Function Proposition 1. If S X is a gmalt with acceleration func- tion , A s and stress space S, then the mean function μs and the covariance function 2, s t are given by, ,, X sAsEX As s , S and 2, 2 ,, , ,,, XX st X EAs XAsAt As At 20 2 22 ,X SAs where μX and X are the mean and variance of the untransformed X, respectively. In particular, the variance at any stress s S is . The proof of these is straightforward and follows from the properties of expectation. To keep things simple, we write A(s) in- stead of , A s from now on. The next property shows the effect of log transforma- tion in the GMALT model. The proof follows directly from applying the definition of logarithmic function and mathematical expectation. 3.2. Effect of Log Transformation glo S S Proposition 2. If X As X, then X has constant variance 2Var logS X and mean 0log given by , (6) log where 0 A s log So the log transformation results in a constant variance but a changing mean. In particular, since and . logEX 0, 1As log 0As , the mean decreases since . An interesting case is when log X S has a Normal distribution. Example 1. (Lognormal model) In the GMALT, S X is Lognormal with mean S 2 and variance S log if s X is normal with mean, say 2 and variance S . In this case the parameters of 2 exp 2 Sb X are and 22 22 expexp 1 Sb expb where , and 2 and are as defined in Property 2 (See Hogg and Craig [8] for pr operties of Lognormal distribution). This example will enable us to make inferences about X which is not observed in the GMALT model via the ac- celeration function A(s), when it is known. In the next example we show a situation where the Copyright © 2012 SciRes. OJS 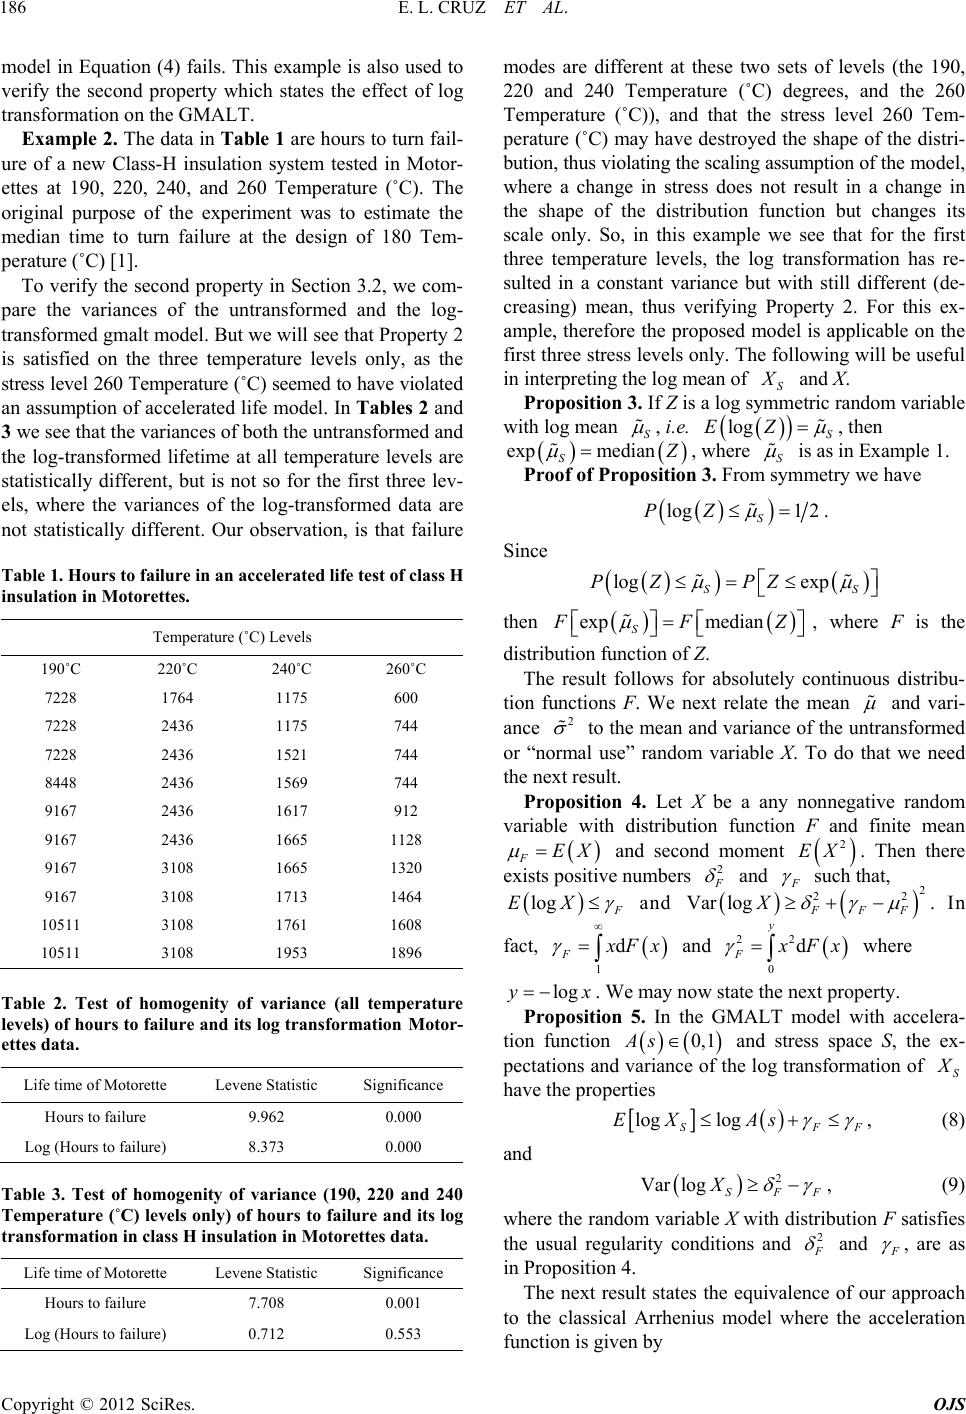 E. L. CRUZ ET AL. 186 model in Equation (4) fails. This example is also used to verify the second property which states the effect of log transforma tion on the GMALT. Example 2. The data in Table 1 are hours to turn fail- ure of a new Class-H insulation system tested in Motor- ettes at 190, 220, 240, and 260 Temperature (˚C). The original purpose of the experiment was to estimate the median time to turn failure at the design of 180 Tem- perature (˚C) [1]. To verify the second property in Section 3.2, we com- pare the variances of the untransformed and the log- transformed gmalt model. But we will see that Property 2 is satisfied on the three temperature levels only, as the stress level 260 Temperature (˚C) seemed to have violat ed an assumption of accelerated life model. In Tables 2 and 3 we see that the variances of both the untransformed and the log-transformed lifetime at all temperature levels are statistically different, but is not so for the first three lev- els, where the variances of the log-transformed data are not statistically different. Our observation, is that failure Table 1. Hours to failure in an accelerated life test of class H insulation in Motorettes. Temperature (˚C) Levels 190˚C 220˚C 240˚C 260˚C 7228 1764 1175 600 7228 2436 1175 744 7228 2436 1521 744 8448 2436 1569 744 9167 2436 1617 912 9167 2436 1665 1128 9167 3108 1665 1320 9167 3108 1713 1464 10511 3108 1761 1608 10511 3108 1953 1896 Table 2. Test of homogenity of variance (all temperature levels) of hours to failure and its log transformation Motor- ettes data. Life time of Motorette Levene Statistic Significance Hours to failure 9.962 0.000 Log (Hours to failure) 8.373 0.000 Table 3. Test of homogenity of variance (190, 220 and 240 Temperature (˚C) levels only) of hours to failure and its log transformation in class H insulation in Motorettes data. Life time of Motorette Levene Statistic Significance Hours to failure 7.708 0.001 Log (Hours to failure) 0.712 0.553 modes are different at these two sets of levels (the 190, 220 and 240 Temperature (˚C) degrees, and the 260 Temperature (˚C)), and that the stress level 260 Tem- perature (˚C) may have destroyed the shape of the distri- bution, thus violating the scaling assumption of the mo d e l , where a change in stress does not result in a change in the shape of the distribution function but changes its scale only. So, in this example we see that for the first three temperature levels, the log transformation has re- sulted in a constant variance but with still different (de- creasing) mean, thus verifying Property 2. For this ex- ample, therefore th e proposed model is applicable on the first three stress levels only. The following will be useful in interpreting the log mean of S and X. X Proposition 3. If Z is a log symmetric random variable with log mean S , i.e. logEZ S , then exp median Z S , where S is as in Example 1. Proof of Propositio n 3. From symmetry we have log1 2 S PZ . Since log exp SS PZ PZ exp median S F FZ then , where F is the distribution fun c tion of Z. The result follows for absolutely continuous distribu- tion functions F. We next relate the mean 2 and vari- ance to the mean and variance of the untransformed or “normal use” random variable X. To do that we need the next result. Proposition 4. Let X be a any nonnegative random variable with distribution function F and finite mean EX 2 EX 2 F and second moment . Then there exists positive numbers F and F such that, logEX and . In F 2 22 Var logFFF X 1 d F x Fx 22 0 d y F and x fact, Fx logyx where . We may now state the next property. Proposition 5. In the GMALT model with accelera- tion function 0, 1As S and stress space S, the ex- pectations and variance of the log transformation of X have the properties log log SFF EX As , (8) and 2 Var logSFF X 2 , (9) where the random variable X with distribution F satisfies the usual regularity conditions and F and F , are as in Proposition 4. The next result states the equivalence of our approach to the classical Arrhenius model where the acceleration function is given by Copyright © 2012 SciRes. OJS  E. L. CRUZ ET AL. Copyright © 2012 SciRes. OJS 187 12 exp A ss 0,s (11) with is a function of temperature and 1 and 2 are constants characteristic of the product fail- ure mechanism and test conditions [9 ]. 3.3. Relationship to Cox Proportional Hazards Model and Arrhenius Model In the next result we show the equivalence of the GMALT model and the Cox regression model or the pro- portional hazards model. The reader is referred to Flem- ing and Harrington [4] for an exposition. This result shows that the dual of the GMALT model is the Cox proportional hazards in the counting process approach to survival analysis, the GMALT being the lifetime ap- proach to survival analysis. The Arhennius life model is also presented as special case. Proposition 6. In the GMALT model with accelera- tion function A s 1 with stress space S, the hazard func- tion at any stress s S is given by , 0 x sAs 0,x 01 x for all (13) If exp A sX xp where X is the covariate, then 01 0 ,e x sx 1 X which is the Cox proportional hazards model with one covariate. In par- ticular, if X s, 01 and 12 where s is temperature, and 1 and 2 are constants, we get the well-known Arhennius model [9]. Proof of Propositio n 6. Let . Then SS PXy F , S X F PAsX yPX FyAs As y , where X F is the distribution of X. Also X 1 X F yAs As fyAs where fX is the density of X. By definition the hazard function (at a given stress level s) is 1 1 0 ,11 , S SX X A sfyAs FyAs fy xs Fy As x by letting x yAs , . 3.4. Equivalence to Model of Cox and Oakes Finally we show the equivalence of the proposed model (4) to the one given by Cox and Oakes [5] and described in Section 2. Let X have distribution function F. Since S X As X we have , . S PXtPAsX tPX FtAs ,( ,tAs Taking ,1, A ss ;, F tsFs t gives and the two are equivalent. Thus, the approach of Cox and Oakes may be also taken as a special case of GMALT. 4. Concluding Remarks In this paper, we considered a general model for acceler- ated life testing and derive some of its properties. This model is expressed in terms of the random variables which is simpler, instead of distribution functions. An important consideration is the choice of stress level, where the GMALT model may fail. A threshold level (stress) at which the scaling is no longer applicable must be sought by the scientist. Future work may consider where a test of hypothesis 0 applies. Rejec- tion of this hypothesis means we can proceed to the test or increase stress at a certain level. For the simple null hypothesis :1HAs 0:1HAs , rejection in favor of the alter- native :1HAs 0 indicates that we can start doing accelerated testing at stress level s where 1As . For products where A s is not known, the search for A s is the subject of many inquiries. 5. Acknowledgements E. L. C. thanks the Office of the Vice President for Academic Affairs of the University of the Philippines where he was recipient of Doctoral Stude nt Grant. REFERENCES [1] W. Nelson, “Accelerated Testing: Statistical Models, Test Plans and Analysis,” Wiley, New York, 2004. [2] O. Aalen, “Nonparametric Inference for a Family of Coun- ting Processes,” Annals of Statistics, Vol. 6, No. 4, 1978, pp. 701-726. doi:10.1214/aos/1176344247 [3] P. K. Andersen, O. Borgan, R. D. Gill and N. Keiding, “Statistical Model Based on Coun ting Processes,” Sp ri ng e r- Verlag, New York, 1993. [4] T. Fleming and D. Harrington, “Counting Processes and Survival Analysis,” Wiley, New York, 1992. [5] D. R. Cox and D. Oakes, “The Analysis of Survival Data,” Chapman and Hall, London, 1984. [6] R. Barlow and E. Scheuer, “Estimation from Accelerated Life Tests,” Technometrics, Vol. 13, No. 1, 1971, pp. 145- 160. [7] B. Gnedenko, I. Pavlov and I. Ushakov, “Statistical Reli- ability Engineering,” John Wiley & Sons Ltd., New York, 1999. [8] R. Hogg and A. Craig, “Introduction to Mathematical Statistics,” John Wiley & Sons Ltd., New York, 1995. [9] W. Q. Meeker and L. A. Escobar, “Statistical Methods for Reliability Data,” John Wiley & Sons Ltd., New York, 1998. |