

Paper Menu >>
Journal Menu >>
 Journal of Transportation Technologies, 2012, 2, 158-164 http://dx.doi.org/10.4236/jtts.2012.22017 Published Online April 2012 (http://www.SciRP.org/journal/jtts) Comparison of In-Use Operating Costs of Hybrid-Electric and Conventional School Buses Shauna Hallmark, Robert Sperry Center for Transportation Research and Education, Iowa State University, Ames, USA Email: [email protected] Received November 15, 2011; revised January 10, 2012; accepted February 15, 2012 ABSTRACT Hybrid-electric school buses became available in the US through a national consortium designed to bring hybrid-elec- tric school buses to market by creating enough demand among school districts to encourage manufacturers to invest in development of the technology. A number of school districts in the US joined the HESB project to purchase plug-in hybrid-electric school buses. Sixteen hybrid-electric school buses were purchased and piloted in 11 states. Two of the hybrid-electric school buses were purchased by the Nevada and Sigourney school districts in the state of Iowa, US. In-use fuel economy and electricity operating costs were monitored for the two Iowa hybrid school buses and two con- trol buses (one in each district). Fuel consumption and other operational metrics were calculated and compared for each school district. The hybrid buses were deployed in January 2008 and data were recorded through May 2010. Valuation of the data indicated that the Nevada HESB had 29.6% better fuel economy than the control bus and the Sigourney HESB had 39.2% better fuel economy than the control bus. Electrical costs per mile were also calculated for the two hybrid-electric school buses. Total operating costs per mile were calculated based on fuel use per mile for all buses and electrical costs for the hybrid-electric school buses. The cost to operate the hybrid bus in Nevada was 37 cents/mile while the control bus cost 42 cents/mile, making the hybrid bus 13% less expensive to operate. The hybrid bus in Si- gourney was 27 cents/mile while the control bus was 34 cents/mile, making the hybrid bus 21% less expensive to oper- ate. All values are in US dollars. Keywords: Hybrid Vehicles; Fuel Consumption; School Bus; Energy 1. Introduction Around 26 million school children are transported to school annually in the United States on school buses re- sulting in 5.8 billion miles of travel per year [1]. Al- though transporting school children on school buses is significantly more fuel efficient than transportation in private vehicles, school buses still consume around 822 million gallons of diesel fuel annually. The cost of pro- viding school transportation can be overwhelming for US school districts as fuel costs rise and school budgets are reduced due to eco nomic downturn. In response to rising transportation costs, some school districts are cutting services which increase the number of private vehicle trips which can increase overall fuel use considerably. The American School Bus Council [1] estimates that if children who customarily ride the school bus took those school trips in private vehicles, the school trips would consume an additional 2.3 billion gallons of fuel. This would result in even more consumption of non-renew- able resources and continued reliance on foreign energy sources. As a result, even though it may be challenging for agencies, such as resource strapped school districts, to invest energy and resources, it is important that agen- cies take the lead in finding sustainable solutions. It is also particularly important that school districts take the lead in demonstrating sustainable practices to school children. One sustainable solution to school transportation prob- lems is use of hybrid school buses, which have the po- tential to reduce emissions and overall life-cycle costs compared to conventional diesel school buses. Prior to 2006, the hybrid technology was only available in transit buses and passenger vehicles with both having a track record of fuel economy and emissions benefits. Hybrid technology has recently become available in the school bus market. In order to create enough demand to bring hybrid school buses to market, a national consortium was formed in the US. The Hybrid-Electric School Bus (HESB) Project was organized by Advanced Energy. The project was designed to bring hybrid school buses to market by creating enough demand among school dis- tricts to encourage a manufacturer to invest in the devel- C opyright © 2012 SciRes. JTTs  S. HALLMARK ET AL. 159 opment of the technology [2]. The expected benefits of the hybrid-electric school buses are fuel efficiency, re- duced fuel costs, and decreased emissions. A number of school districts joined the HESB project and purchased plug-in hybrid-electric school buses. Six- teen hybrid-electric school buses were purchased and piloted in 11 states. Two of the hybrid-electric school buses were purchased by Iowa school districts. 1.1. Performance of Hybrid School Buses Although hybrid technology was relatively new in school buses, a few studies are available which have assessed the fuel economy and emissions impact of hybrid school buses. It should be noted that most of the studies cited in the following sections were assessments of buses that participated in the HESB project. Enova tested a plug-in hybrid school bus using a chas- sis dynamometer to evaluate fuel economy under con- trolled test conditions. The company used the West Vir- ginia University Suburban Cycle (WVUSC) and Tor- rance California Test Cycle (TCTC) [3]. With the WVUSC, the research ers found that the hybrid bus had a fuel economy of 12.70 mpg, while a conventional bus used for comparison had a fuel economy of 7.10 mph; a 79% improvement. For the TCTC, the researchers found a 57% improvement in fuel economy for the hybrid bus, with 12.80 mpg for the hybrid and 8.10 mpg for the con- ventional bus. Hybrid-electric school buses in Vermont were tested using on-road emissions equipment [4]. It was estimated that the hybrid-electric school bus consumed 28.7% less fuel than a standard diesel school bus. Additionally, the researcher found that NOx emissions were 49% lower for the hybrid-electric school bus than for the conventional school bus, CO emissions were 72% lower, and HC emissions were 49% lower. Data were collected on a conventional charge-sus- taining (hybrid) bus, a standard diesel control bus, and a charge-depleting (plug-in hybrid) bus for the New York Power Authority (NYPA) [3]. Fuel consumption for three test routes was measured (urban, suburban, and rural) and they found that the plug-in hybrid school bus had a fuel economy 51% to 131% higher than the other buses, depending on the test route. However, this was only observed while the HESB operated in charge-de- pleting mode. Once it began operating in charge-sus- taining mode, it performed similar to the conventional hybrid and diesel control buses. In another study, a plug- in hybrid schoo l bus w as co m- pared to a control bus by The University of Texas. The study authors found that fuel economy for the conven- tional bus was 6.9 mpg, while fuel economy was 9.0 mpg for the HESB (an increase of 30%). The researchers also reported that the control bus emitted approximatel y 6 3 kg of CO2 per day while the HESB emitted 51 kg. When the researchers factored in pollution for electricity regenera- tion to recharge batteries, this represents a reduction of 23.5% [3]. Advanced Energy [3] has also been collecting in-use fuel economy data from each school district involved in the HSEB project across the US. Advanced Energy’s researchers evaluated the fuel economy comparing hy- brid-electric school buses and regular school buses. Overall, the hybrid buses have done much better than the control buses. Three school districts reported decreases in fuel economy, 5%, 6%, and 12% respectively. The remaining school districts have reported improved fuel economy for the hybrid-electric school buses over con- trol buses. Two districts reported improvements between 6% and 8%, three reported improvements from 11% to 14%, one had a 23% savings, one had a 47% improve- ment, and one school district saw a fuel economy im- provem ent of 57%. Choi and Frey et al. [5] conducted a study which com- pared energy use for a plug-in parallel-hybrid diesel- electric school bus (PHSB) to a conventional school bus using five real-world driving cycles. They found that the direct diesel fuel economy was 3.2% to 9.5% better for the PHSB compared to the conventional bus. The National Renewable Energy Laboratory [6] ana- lyzed real-world school bus drive cycle data for a first-generation PHEV, a more recent PHEV, and a con- ventional school bus. Depending on the drive cycle, PHEV fuel savings ranged from 30% to 50% while the buses were in charge depleting mode. While in charge sustaining mode the PHEV showed only small fuel sav- ings compared to the conventional bus. 1.2. Hybrid Performance in the Transit Market Although only a few studies have been conducted to as- sess the fuel economy or emissions for hybrid school buses, transit buses have used hybrid technology for some time and have overall shown significant fuel economy and emissions improvements over conventional buses. Chassis dynamometer tests were conducted for 10 low-floor hybrid buses and 14 conventional high-floor diesel transit buses run by New York City Transit [7]. Buses were evaluated over three driving cycles including the Central Business District (CBD), New York bus cy- cle, and the Manhattan cycle. The operating costs, effi- ciency, emissions, and overall performance were also compared while both types of buses were operating on similar routes. They found that fuel economy was 48% higher for the hybrid buses. A study by Battelle [8] tested emissions using a dy- Copyright © 2012 SciRes. JTTs  S. HALLMARK ET AL. 160 namometer for one diesel hybrid-electric bus and two regular diesel buses (with and without catalyzed diesel particulate filters [DPF]). The researchers reported that fuel economy for the hybrid bus was 54% higher than the two regular diesel buses. In another study, two buses were tested using a dynamometer at the National Re- newable Energy Laboratory’s (NREL’s) Refuel facility in Golden, Colorado [9]. One bus was a conventional diesel and the other was a hybrid bus and both were tested over several drive cycles including Manhattan, Orange County Transit A, CBD, and King County Metro. Results are shown in Table 1 for each drive cycle. The table shows percent difference in fuel economy among the buses (fuel economy was reported as miles per gal- lon). Fuel economy was 30.3% to 74.6% higher for the hybrid bus compared to the conv entional buses. In another study, Clark et al. [10] evaluated six transit buses with traditional diesel engines, two powered by spark-ignited compressed natural gas (CNG), and one hybrid transit bus in Mexico City using a mobile heavy- duty emissions testing lab. Buses were tested over a drive cycle representative of Mexico City transit bus operation, which was developed using GPS data from in-use transit buses. Depending on how fuel economy was evaluated, the hybrid bus ranked 4th and 1st in fuel economy. 1.3. Objective Two school districts in Iowa, (US) participated in the Hybrid Electric School Bus Project (Nevada and Sigour- ney) and each purchased one hybrid-electric school bus. The Center for Transportation Research and Education (CTRE) at Iowa State University (ISU) monitored and evaluated bus performance for the two Iowa HESBs from 2008 to 2010. The project was funded by the Iowa En- ergy Center (IEC). The team used information provided by the school district to calculate fuel economy and elec- tricity use for the two hybrid-electric school buses and two traditional diesel school buses which were used as controls. The objectives of the research were to monitor fuel and electricity use and assess the on-road operating costs of the hybrid buses compared to conventional school buses. Tab le 1. Percentage chan ge comp ared to conventional buses . Cycle Fuel economy Manhattan +74.6% OCTA +50.6% CBD +48.3% KCM +30.3% 1.4. Iowa Buses Each of the two school districts purchased one hy- brid-electric school bus with funding assistance from the Iowa Energy Center (IEC). Each school district was also asked to select a control bus which had similar charac- teristics to the hybrid-electric bus (size, year manufac- tured, etc.) and operated on similar routes. The hy- brid-electric school buses were manufactured by IC Bus. The school bus body is the same as that of a standard school bus and bus specifications include the following [2]: 6.4 L 210 hp diesel Hybrid system with plug-in capability Post-transmission parallel drive 80 kW electric motor 35 kWh Li-ion phosphate battery pack Both of the Iowa HESB buses are 2009 International 65-passenger buses with an International MaxForce (V8) 6.4 L engine with an Allison automatic 2000 transmis- sion. The hybrid function can be turned off so that the bus runs on the internal combustion engine (ICE) only. The Nevada control school bus is a 2009 Bluebird 65-passenger bus with a Cummins ISB07 engine (220 HP, Allison automatic GEN4, 2500 PTS, TC 221). The Sigourney control bus is a 2005 Bluebird, 65-passenger with a Caterpillar C-7 (V6) engine (210 HP) with an Al- lison automatic 2000 transmission. The Nevada School District is located in Nevada, Iowa, about 10 miles west of Ames, Iowa. The district has about 13 operational buses and transports around 828 school children per day. The district uses a 20% biodiesel blend. The blend amount varies, but the same fuel was used in both the h ybrid and contro l buses. The Sigourney School District is located about 90 miles southeast o f Des Moines, Iowa. The district has about 11 buses and trans- ports around 320 school children per day. Both locations are considered to be rural co mmunities. 2. Methodology to Evaluate Operating Costs Both school districts began recording information for the hybrid buses in February of 2008. The Nevada school district also began reporting for the control bus in Febru- ary 2008 while the Sigourney school district did not se- lect a control bus until October 2008. Data were recorded for all buses through May 2010. Each time the buses were fueled, school districts reported the date, odometer, gallons of fuel added, fuel cost, and any maintenance or other issues. Initially, neither Iowa school district had a separate electric meter for the hybrid bus. When a dedicated meter became available, electricity use was recorded. However, less electricity use information was available than for fuel use. Additionally, although the districts did a good Copyright © 2012 SciRes. JTTs 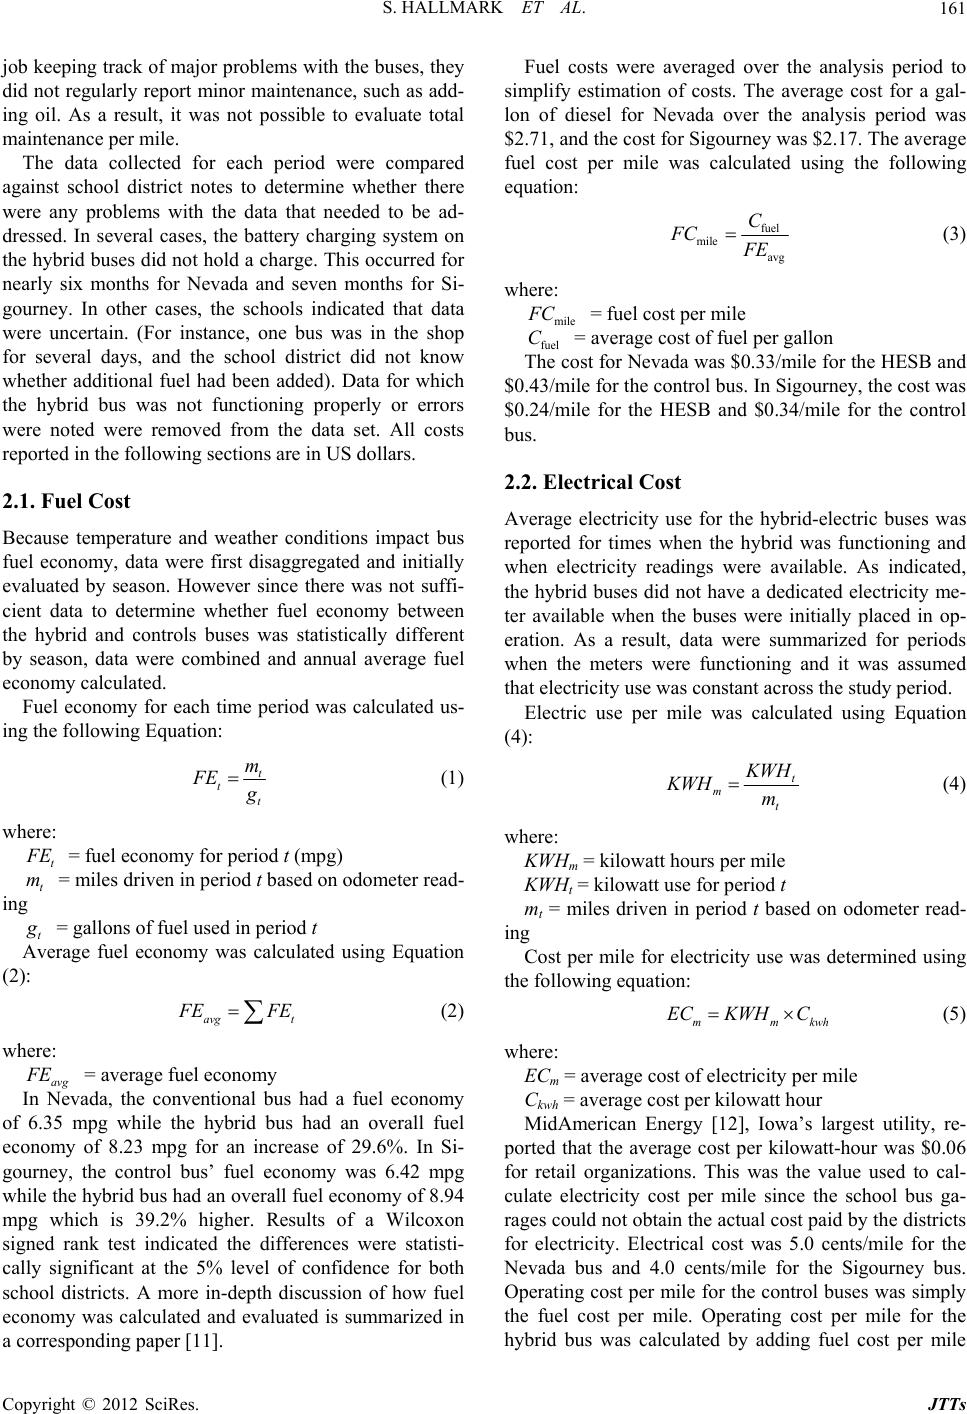 S. HALLMARK ET AL. 161 job keeping track of major problems with the buses, they did not regularly report minor maintenance, such as add- ing oil. As a result, it was not possible to evaluate total maintenance per mile. The data collected for each period were compared against school district notes to determine whether there were any problems with the data that needed to be ad- dressed. In several cases, the battery charging system on the hybrid buses did not hold a charge. This occurred for nearly six months for Nevada and seven months for Si- gourney. In other cases, the schools indicated that data were uncertain. (For instance, one bus was in the shop for several days, and the school district did not know whether additional fuel had been added). Data for which the hybrid bus was not functioning properly or errors were noted were removed from the data set. All costs reported in the following sections are in US dollars. 2.1. Fuel Cost Because temperature and weather conditions impact bus fuel economy, data were first disaggregated and initially evaluated by season. However since there was not suffi- cient data to determine whether fuel economy between the hybrid and controls buses was statistically different by season, data were combined and annual average fuel economy calculated. Fuel economy for each time period was calculated us- ing the following Equation: t tt m FE g (1) where: t F E m = fuel economy for period t (mpg) t = miles driven in period t based on odometer read- ing t g = gallons of fuel used in peri od t Average fuel economy was calculated using Equation (2): avg t F EFE (2) where: avg F E = average fuel economy In Nevada, the conventional bus had a fuel economy of 6.35 mpg while the hybrid bus had an overall fuel economy of 8.23 mpg for an increase of 29.6%. In Si- gourney, the control bus’ fuel economy was 6.42 mpg while the hybrid bus had an overall fuel economy of 8.94 mpg which is 39.2% higher. Results of a Wilcoxon signed rank test indicated the differences were statisti- cally significant at the 5% level of confidence for both school districts. A more in-depth discussion of how fuel economy was calculated and evaluated is summarized in a correspondin g paper [11]. Fuel costs were averaged over the analysis period to simplify estimation of costs. The average cost for a gal- lon of diesel for Nevada over the analysis period was $2.71, and the cost for Sigourney was $2.17. The average fuel cost per mile was calculated using the following equation: fuel mile avg C FC F E (3) where: mile F C C = fuel cost per mile fuel The cost for Nevada was $0.33/mile for the HESB and $0.43/mile for the control bus. In Sigourn ey, the co st was $0.24/mile for the HESB and $0.34/mile for the control bus. = average cost of fuel per gallon 2.2. Electrical Cost Average electricity use for the hybrid-electric buses was reported for times when the hybrid was functioning and when electricity readings were available. As indicated, the hybrid buses did not have a dedicated electricity me- ter available when the buses were initially placed in op- eration. As a result, data were summarized for periods when the meters were functioning and it was assumed that electricity use was constant across the study period. Electric use per mile was calculated using Equation (4): t mt K WH KWH m (4) where: KWHm = kilowatt hours p er mile KWHt = kilowatt use for period t mt = miles driven in period t based on odometer read- ing Cost per mile for electricity use was determined using the following equ ation: mm ECKWH Ckwh (5) where: ECm = average cost of electricity per mile Ckwh = average cost per kilowa t t hour MidAmerican Energy [12], Iowa’s largest utility, re- ported that the average cost per kilowatt-hour was $0.06 for retail organizations. This was the value used to cal- culate electricity cost per mile since the school bus ga- rages could not obtain th e actual cost paid by the districts for electricity. Electrical cost was 5.0 cents/mile for the Nevada bus and 4.0 cents/mile for the Sigourney bus. Operating cost per mile for the control buses was simply the fuel cost per mile. Operating cost per mile for the hybrid bus was calculated by adding fuel cost per mile Copyright © 2012 SciRes. JTTs  S. HALLMARK ET AL. Copyright © 2012 SciRes. JTTs 162 and electricity cost per mile. 3. Other Costs Several long term costs which are important factors in assessing whether investment in hybrid buses makes sense for a school district could not be included in the analysis. Initial feasibility studies and marketing of hy- brid buses indicate that the hybrid technology would re- sult in less engine wear and regenerative braking is esti- mated to result in less brake wear [13-16]. However, the battery pack s ad d ap prox imately 2000 po und s [1 3] wh ich may increase wear on some parts such as shock absorbers and tires. Replacement cost of the batteries will also add to the lifecycle cost of the hybrid buses. IC Bus [13] in- dicates that the lithium-ion batteries have a life of 5 - 7 years. The replacement costs, however, are to some ex- tent unknown at this point. Battery technology is rapidly evolving so the cost of b atteries in the future will depend on the latest technology and costs when it is time to re- place the batteries. One of the original project goals was to track mainte- nance costs for the hybrid and control buses. However, the buses were only followed for 2 years which was not sufficient time to identify differences in normal wear. During the study, a number of maintenance issues spe- cific to the hybrid buses occurred. The initial charging connections and power cords furnished with the buses proved to be inadequate for the function for which they were needed. After both districts’ chargers burned (or shorted) out, all were replaced with heavier duty cords and more positive (locking) connections. In addition, the batteries required about eight hours to achieve a full charge, so the intermediate charge between the typical morning and af ternoon routes was insufficient to provide full electrical power in the afternoon. During periods of maximum electrical use (and minimal engine use), the idling engine did not circulate and heat enough water in its cooling system to pro vide adequate h eat to the interio r of the bus. This was unacceptable to the driver and the riders, so the attempted so lution was an auxiliary electric heater. However, during the study, any maintenance costs specific to the hybrid system was covered under the vehicle warranty so the schools did not incur any actual costs due to the maintenance issues. Additionally, it was felt that the initial maintenance problems with the h ybrid buses were generational and will be overcome in future models so these types of costs are not expected to occur with more recent hybrid school buses. Reduced emissions are another cost that could be in- cluded in a lifecycle analysis. Studies have shown sig- nificant reduction in criteria pollutants for hybrid school buses compared to regular school buses. Students on hy- brid school buses would have lower exposure to pollut- ants, particularly particulate matter, resulting in a posi- tive health benefit. However, quantifying costs associ- ated with a reduction in pollutants was beyond the scope of this study. Additionally the benefits of these reduced costs are not accrued to the school distri ct s them sel ves. 4. Results Operating costs by category are provided in Table 2. As shown, the cost to operate the hybrid bus in Nevada was 38.0 cents/mile while the con trol bus cost 43.0 cents/mile, making the hybrid bus 13% less expensive to operate. The hybrid bus in Sigourney was 28.0 cents/mile while the control bus was 34.0 cents/mile), making the hybrid bus 21% less expensive to operate. As noted in Section 4 none of the maintenance costs directly related to the hy- brid buses were paid by the school, so these costs were not factored in. This would be typical of any new vehicle while it was still under warranty. Additionally, as indi- cated, differences in regular maintenance were not noted. Regular maintenance includes items such as an oil change, changing an air filter, etc. The Nevada HESB was driven an average 987 miles per month while the control bus was driven an average of 705 miles. The average mileage for the Nevada buses was 846 miles per month. Assuming a school year of 9 months, the average cost for operating a HESB over an average route would be 9 × 1362 × $0.236 = $2893 an- nually while the cost to operate a traditional bus on a similar route is 9 × 1362 × 0.267 = $3273. Total savings are $380 annually. The Sigourney HESB was driven an average of 1339 Table 2. Operational metrics for Iowa buses (costs are in USD). Avg fuel economy in km/l (mpg) Avg fuel cost in $/liter ($/gal) Avg fuel cost per km (cost/mile) Avg kwh per km (per mile) Avg cost per kwh Avg kwh cost/km (per mile) Total avg cost/km (per mile) Nevada HESB 3.50 (8.23) $0.72 ($2.71) $0.21 ($0.33) 0.53 (0.85)$0.06 $0.032 ($0.051) $0.24 ($0.38) Nevada Control 2.70 (6.35) $0.72 ($2.71) $0.27 ($0.43) NA NA NA $0.27 ($0.43) Sigourney HESB 3.80 (8.94) $0.72 ($2.71) $0.15 ($0.24) 0.37 (0.60)$0.06 $0.022 ($0.036) $0.17 ($0.28) Sigourney Control 2.73 (6.42) $0.72 ($2.71) $0.21 ($0.34) NA NA NA $0.21 ($0 .34) 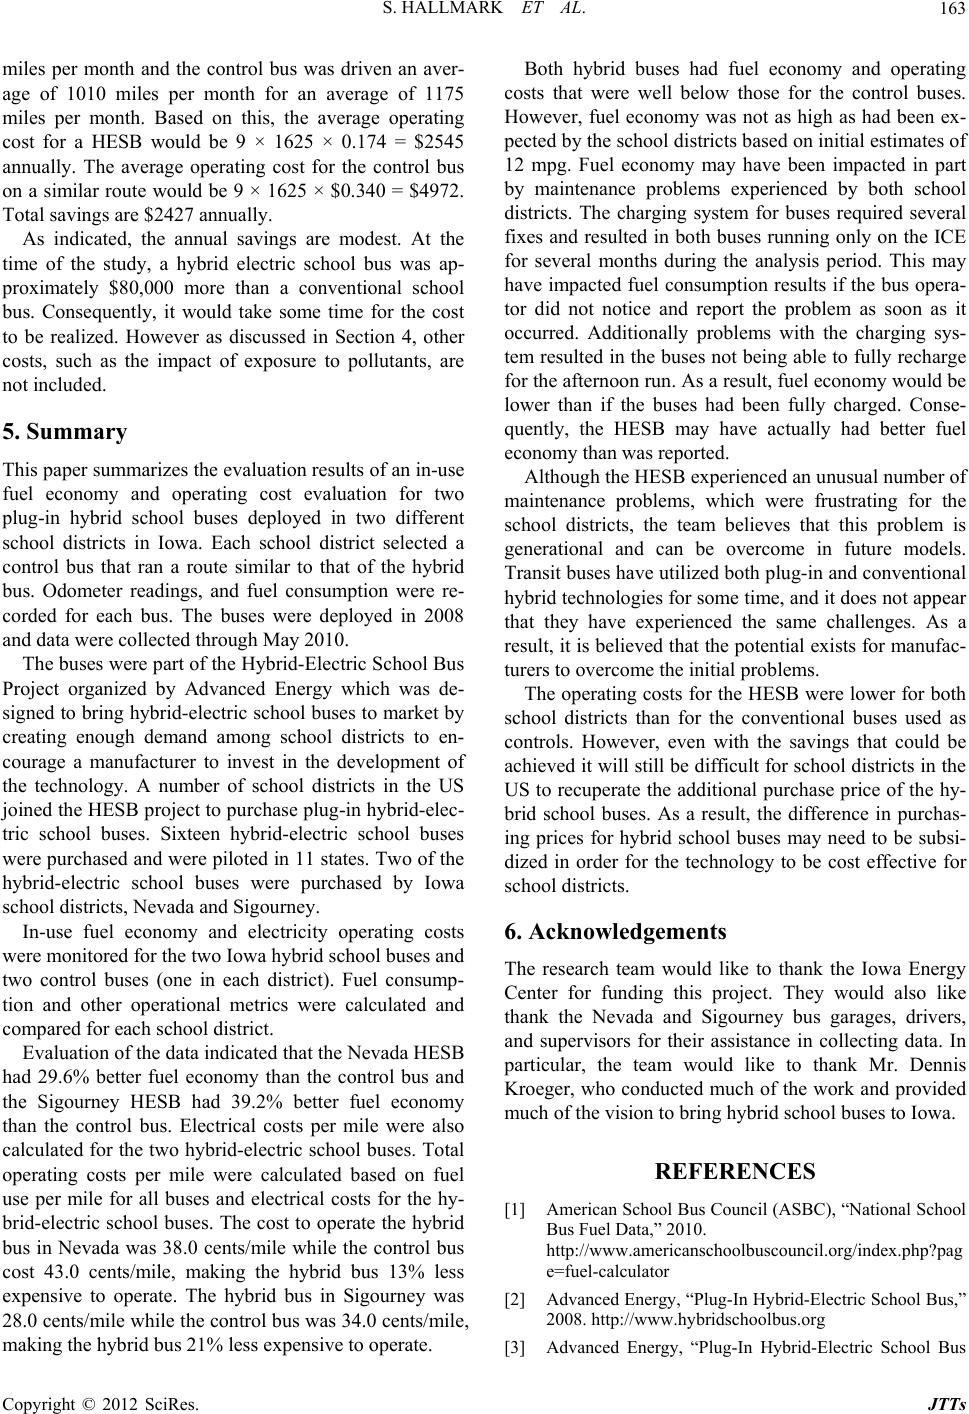 S. HALLMARK ET AL. 163 miles per month and the control bus was driven an aver- age of 1010 miles per month for an average of 1175 miles per month. Based on this, the average operating cost for a HESB would be 9 × 1625 × 0.174 = $2545 annually. The average operating cost for the control bus on a similar route would be 9 × 1625 × $0.340 = $4972. Total savings are $2427 annually. As indicated, the annual savings are modest. At the time of the study, a hybrid electric school bus was ap- proximately $80,000 more than a conventional school bus. Consequently, it would take some time for the cost to be realized. However as discussed in Section 4, other costs, such as the impact of exposure to pollutants, are not included. 5. Summary This paper summarizes the evaluation results of an in-use fuel economy and operating cost evaluation for two plug-in hybrid school buses deployed in two different school districts in Iowa. Each school district selected a control bus that ran a route similar to that of the hybrid bus. Odometer readings, and fuel consumption were re- corded for each bus. The buses were deployed in 2008 and data were collected through May 2010. The buses were part of the Hybrid-Electric School Bus Project organized by Advanced Energy which was de- signed to bring hybrid-electric school buses to market by creating enough demand among school districts to en- courage a manufacturer to invest in the development of the technology. A number of school districts in the US joined the HESB project to purchase plug-in hybrid-elec- tric school buses. Sixteen hybrid-electric school buses were purchased and were piloted in 11 states. Tw o of the hybrid-electric school buses were purchased by Iowa school districts, Nevada and Sigourney. In-use fuel economy and electricity operating costs were monitored for the two Iowa hybrid school buses and two control buses (one in each district). Fuel consump- tion and other operational metrics were calculated and compared for each school district. Evaluation of the data indicated that the Nevada HESB had 29.6% better fuel economy than the control bus and the Sigourney HESB had 39.2% better fuel economy than the control bus. Electrical costs per mile were also calculated for the two hybrid-electric school buses. Total operating costs per mile were calculated based on fuel use per mile for all buses and electrical costs for the hy- brid-electric school buses. The cost to operate the hybrid bus in Nevada was 38.0 cents/mile while the control bus cost 43.0 cents/mile, making the hybrid bus 13% less expensive to operate. The hybrid bus in Sigourney was 28.0 cents/mile while the control bus was 34.0 cents/mile, making the hybrid bus 21% less expensive to operate. Both hybrid buses had fuel economy and operating costs that were well below those for the control buses. However, fuel economy was not as high as had been ex- pected by the school districts based on in itial estimates of 12 mpg. Fuel economy may have been impacted in part by maintenance problems experienced by both school districts. The charging system for buses required several fixes and resulted in both buses running only on the ICE for several months during the analysis period. This may have impacted fuel consumption results if the bus opera- tor did not notice and report the problem as soon as it occurred. Additionally problems with the charging sys- tem resulted in the buses not being able to fully recharge for the afternoo n run. As a result, fu el economy would be lower than if the buses had been fully charged. Conse- quently, the HESB may have actually had better fuel economy than was reported. Although the HESB experienced an unusual number of maintenance problems, which were frustrating for the school districts, the team believes that this problem is generational and can be overcome in future models. Transit buses have utilized both plug-in and conv entional hybrid techno logies fo r some ti me, and it does not appear that they have experienced the same challenges. As a result, it is believed that the potential exists for manufac- turers to overcome the initial problems. The operatin g costs for the HESB were lo wer for both school districts than for the conventional buses used as controls. However, even with the savings that could be achieved it will still be difficult for schoo l districts in the US to recuperate the additional purchase price of the hy- brid school buses. As a result, the difference in purchas- ing prices for hybrid school buses may need to be subsi- dized in order for the technology to be cost effective for school districts. 6. Acknowledgements The research team would like to thank the Iowa Energy Center for funding this project. They would also like thank the Nevada and Sigourney bus garages, drivers, and supervisors for their assistance in collecting data. In particular, the team would like to thank Mr. Dennis Kroeger, who conducted much of the work and provided much of the vision to bring hybrid school buses to Iowa. REFERENCES [1] American School Bus Council (ASBC), “National School Bus Fuel Data,” 2010. http://www.americanschoolbuscouncil.org/index.php?pag e=fuel-calculator [2] Advanced Energy, “Plug-In Hybrid-Electric School Bus,” 2008. http://www.hybridschoolbus.org [3] Advanced Energy, “Plug-In Hybrid-Electric School Bus Copyright © 2012 SciRes. JTTs  S. HALLMARK ET AL. 164 Project: 2010 Program Report,” 2010. http://www.advancedenergy.org/corporate/initiatives/heb /knowledge_library.php [4] H. A. Garabedian, “Hybrid-Electric School Bus (Presen- tation), Vermont Agency of Natural Resources,” 2010. http://www.advancedenergy.org/corporate/initiatives/heb/ knowledge_library.php [5] C. Hyung-Wook and H. C. Frey. “Method for In-Use Measurement and Evaluation of the Activity, Fuel Use, Electricity Use, and Emissions of a Plug-In Hybrid Die- sel-Electric School Bus,” Environmental Science and Technology, Vol. 44, No. 9, 2010, pp. 3601-3607. doi:10.1021/es903330k [6] R. Barnitt and J. Gonder, “Drive Cycle Analysis, Meas- urement of Emissions and Fuel Consumption of a PHEV School Bus,” SAE World Congress, Detroit, 12-14 April 2011. [7] K. Chandler, K. Walkowicz and L. Eudy. “New York City Transit Diesel Hybrid-Electric Buses: Final Results,” DOE/NREL Transit Bus Evaluation Project, July 2002. [8] Battelle, “Technical Assessment of Advanced Transit Bus Propulsion Systems,” Dallas Area Rapid Transit, Dallas, August 2002. [9] K. Chandler and K. Walkowicz, “King County Metro Tran- sit Hybrid Articulated Buses: Final Evaluation Report,” National Renewable Energy Laboratory, 2006. [10] N. Clark, N. Borrell, R. Enrique, D. L. McKain, V. Pa- ramo, W. Hugo, W. Vergara, R. A. Barnett, M. Gautam, G. Thompson, D. W. Lyons and L. Schipper, “Evaluation of Emissions fro m New and In-Use Transit Buse s in Mex- ico City, Mexico,” Journal of the Transportation Re- search Record, No. 1987, 2006, pp. 42-53. [11] S. Hallmark, R. Sperry and A. Mudgal, “In-Use Fuel Economy Benefits of Hybrid Electric School Buses in Iowa,” Journal of the Air and Waste Management Asso- ciation, Vol. 61, No. 5, 2011, pp. 504-510. [12] “MidAmerican Energy: Just the Facts,” 2010. http://www.iowacityareadevelopment.com/infrastructure/ utilities/Just_The_Facts_MidAmerican_Energy_Company. pdf [13] “IC Bus: Hybrid Technology,” 2011. http://www.icbus.com/Static%20Files/ICCorp/PageConte nt/ Community/Hybrid%20Power/Hybrid%20FAQs.pdf [14] T. Built, “Hybrid Bus Benefits,” 2011. http://www.thomasbus.com/earth-friendly/hybrid/benefits .asp [15] P. Ewan, G. David and R. Johnson, “The Hybrid Electric School Bus Technical Feasibility Study,” 2002. http://www.advancedenergy.org [16] “Transport Canada: Hybrid Buses,” 2010. http://www.tc.gc.ca/engprgrams/environment-utsp-casestud y-cs71e-hybridbuses-272.htm Copyright © 2012 SciRes. JTTs |