

Paper Menu >>
Journal Menu >>
 Vol.1, No.1, 10-16 (2010)s doi:10.4236/as.2010.11002 Copyright © 2010 SciRes. Openly accessible at http://www.scirp.org/journal/as/ Agricultural Science Rice yield, nitrogen utilization and ammonia volatilization as influenced by modified rice cultivation at varying nitrogen rates Limei Zhao1,2, Lianghuan Wu1*, Cunjun Dong3, Yongshan Li4 1Ministry of Education Key Laboratory of Environmental Remediation and Ecosystem Health, College of Environmental and Resource Sciences, Zhejiang University, Hangzhou, China; *Corresponding Author: [email protected] 2College of Ecology and Environmental Science, Inner Mongolia Agricultural University, Huhhot, China 3College of Agriculture & Biotechnology, Zhejiang University, Hangzhou, China 4Cotton Research Institute, Shanxi Academy of Agricultural Sciences, Yuncheng, China Received 15 March 2010; revised 5 April 2010; accepted 10 April 2010. ABSTRACT Field experiments were conducted in 2006 to investigate the impacts of modified rice cultiva- tion systems on: grain yield, N uptake, ammonia volatilization from rice soil and N use efficiency (ANUE, agronomic N use efficiency; and PFP, partial factor productivity of applied N). The tri- als compared rice production using modified methods of irrigation, planting, weeding and nutrient management (the system of rice inten- sification, SRI) with traditional flooding (TF). The effect s of differen t N application rates (0, 80, 160, 240 kg ha-1) and of N rates interacting with cultivation methods were also evaluated. Grain yields ranged from 5.6 to 6.9 t ha-1 with SRI, and from 4.0 to 6.1 t ha-1 under TF management. On average, grain yields under SRI were 24% higher than that with TF. Ammonia volatilization was increased significantly under SRI compared with TF and the average total amount of ammo- nia volatilization loss during the rice growth stage under SRI was 22% higher than TF. With increases in application rate, N uptake by rice increased, and the ratio of N in the seed to total N in the plant decreased. Furthermore, results showed that higher ANUE was achieved at a relatively low N fertilizer rate (80 kg ha-1 N) with SRI. Results of these studies suggest that SRI increased rice yield and N uptake and improved ammonia volatilization loss from rice soil com- pared with TF. Moreover, there were significant interactions between N application rates and cultivation methods. We conclude that it was the most important to adjust the amount of N application under SRI, such as reducing the amount of N application. Research on effects of N fertilizer on rice yield and environmental pol- lution under SRI may be worth further studying. Keywords: Ammonia Volatilization; N Use Efficiency; Paddy Soil; Rice Yield; The System of Rice Intensification 1. INTRODUCTION Nitrogen (N) is the most important nutrient in irrigated rice production [1], and current high yields of irrigated rice are usually associated with large applications of fertilizer N [2] . China is currently the world’s largest consumer of nitrogen fertilizers, accounting for 35% of the global N fertilizer consumption [3], and about 7% N was applied to irrigated rice [4]. Nitrogen use efficiency for rice is lower about 30-35% and with N losses up to > 50% in China [5]. The unique condition of the paddy can promote N losses through denitrification, ammonia vola- tilization and leaching, and N losses not only lead to decrease in N fertilizer efficiency but also to soil, water and atmospheric pollution. Therefore, the measurement and assessment of N losses and increased N use effi- ciency have been of great significance for sustainable agriculture and environmental protection. Ammonia vo- latilization is the major process of N losses in irrigated rice, accounting for 0.41-40% of applied N as urea in China [6]. Ghosh and Ravi reported that ammonia vola- tilization losses in flooded soil ranged from negligible amounts to 60% of applied N [7]. The impact of ammo- nia volatilization losses on environmental quality has attracted a great deal of attention [6,8]. In addition, irrigation plays a critical role in the ability of the rice sector to expand production to meet continu- ally growing demand [9] since about 75% of rice pro- duction in the world comes from irrigated lowland rice fields [10]. China’s 31.7 million ha of rice fields account for about 20% of the world’s rice area and produce about 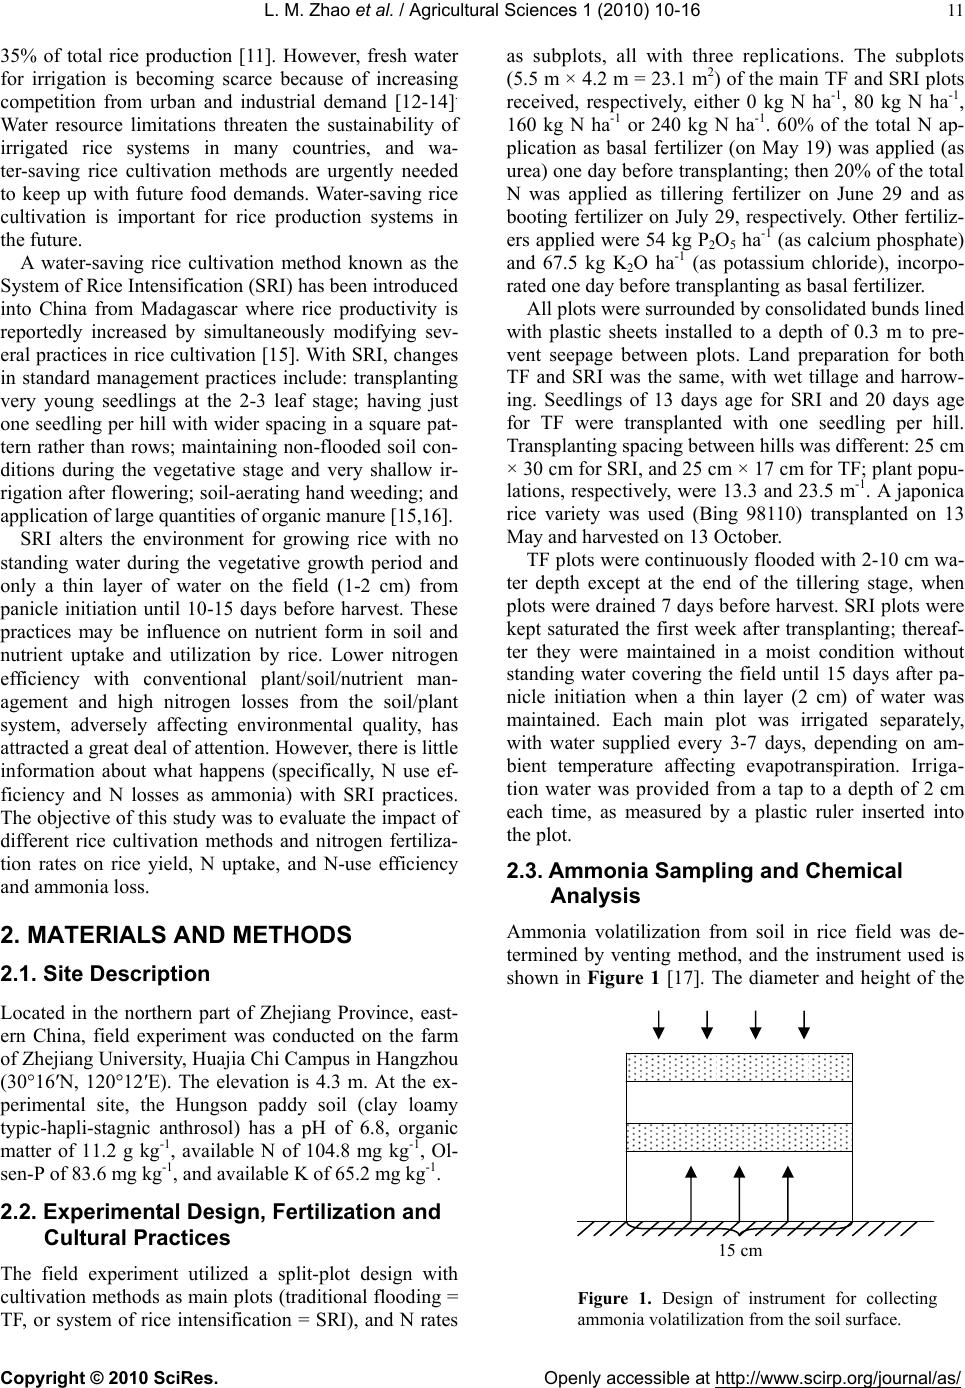 L. M. Zhao et al. / Agricultural Sciences 1 (2010) 10-16 Copyright © 2010 SciRes. Openly accessible at http://www.scirp.org/journal/as/ 11 35% of total rice production [11]. However, fresh water for irrigation is becoming scarce because of increasing competition from urban and industrial demand [12-14]. Water resource limitations threaten the sustainability of irrigated rice systems in many countries, and wa- ter-saving rice cultivation methods are urgently needed to keep up with future food demands. Water-saving rice cultivation is important for rice production systems in the future. A water-saving rice cultivation method known as the System of Rice Intensification (SRI) has been introduced into China from Madagascar where rice productivity is reportedly increased by simultaneously modifying sev- eral practices in rice cultivation [15]. With SRI, changes in standard management practices include: transplanting very young seedlings at the 2-3 leaf stage; having just one seedling per hill with wider spacing in a square pat- tern rather than rows; maintaining non-flooded soil con- ditions during the vegetative stage and very shallow ir- rigation after flowering; soil-aerating hand weeding; and application of large quantities of organic manure [15,16]. SRI alters the environment for growing rice with no standing water during the vegetative growth period and only a thin layer of water on the field (1-2 cm) from panicle initiation until 10-15 days before harvest. These practices may be influence on nutrient form in soil and nutrient uptake and utilization by rice. Lower nitrogen efficiency with conventional plant/soil/nutrient man- agement and high nitrogen losses from the soil/plant system, adversely affecting environmental quality, has attracted a great deal of attention. However, there is little information about what happens (specifically, N use ef- ficiency and N losses as ammonia) with SRI practices. The objective of this study was to evaluate the impact of different rice cultivation methods and nitrogen fertiliza- tion rates on rice yield, N uptake, and N-use efficiency and ammonia loss. 2. MATERIALS AND METHODS 2.1. Site Description Located in the northern part of Zhejiang Province, east- ern China, field experiment was conducted on the farm of Zhejiang University, Huajia Chi Campus in Hangzhou (30°16′N, 120°12′E). The elevation is 4.3 m. At the ex- perimental site, the Hungson paddy soil (clay loamy typic-hapli-stagnic anthrosol) has a pH of 6.8, organic matter of 11.2 g kg-1, available N of 104.8 mg kg-1, Ol- sen-P of 83.6 mg kg-1, and available K of 65.2 mg kg-1. 2.2. Experimental Design, Fertilization and Cultural Practices The field experiment utilized a split-plot design with cultivation methods as main plots (traditional flooding = TF, or system of rice intensification = SRI), and N rates as subplots, all with three replications. The subplots (5.5 m × 4.2 m = 23.1 m2) of the main TF and SRI plots received, respectively, either 0 kg N ha-1, 80 kg N ha-1, 160 kg N ha-1 or 240 kg N ha-1. 60% of the total N ap- plication as basal fertilizer (on May 19) was applied (as urea) one day before transplanting; then 20% of the total N was applied as tillering fertilizer on June 29 and as booting fertilizer on July 29, respectively. Other fertiliz- ers applied were 54 kg P2O5 ha-1 (as calcium phosphate) and 67.5 kg K2O ha-1 (as potassium chloride), incorpo- rated one day before transplanting as basal fertilizer. All plots were surrounded by consolidated bunds lined with plastic sheets installed to a depth of 0.3 m to pre- vent seepage between plots. Land preparation for both TF and SRI was the same, with wet tillage and harrow- ing. Seedlings of 13 days age for SRI and 20 days age for TF were transplanted with one seedling per hill. Transplanting spacing between hills was different: 25 cm × 30 cm for SRI, and 25 cm × 17 cm for TF; plant popu- lations, respectively, were 13.3 and 23.5 m-1. A japonica rice variety was used (Bing 98110) transplanted on 13 May and harvested on 13 October. TF plots were continuously flooded with 2-10 cm wa- ter depth except at the end of the tillering stage, when plots were drained 7 days before harvest. SRI plots were kept saturated the first week after transplanting; thereaf- ter they were maintained in a moist condition without standing water covering the field until 15 days after pa- nicle initiation when a thin layer (2 cm) of water was maintained. Each main plot was irrigated separately, with water supplied every 3-7 days, depending on am- bient temperature affecting evapotranspiration. Irriga- tion water was provided from a tap to a depth of 2 cm each time, as measured by a plastic ruler inserted into the plot. 2.3. Ammonia Sampling and Chemical Analysis Ammonia volatilization from soil in rice field was de- termined by venting method, and the instrument used is shown in Figure 1 [17]. The diameter and height of the Figure 1. Design of instrument for collecting ammonia volatilization from the soil surface. 15 cm 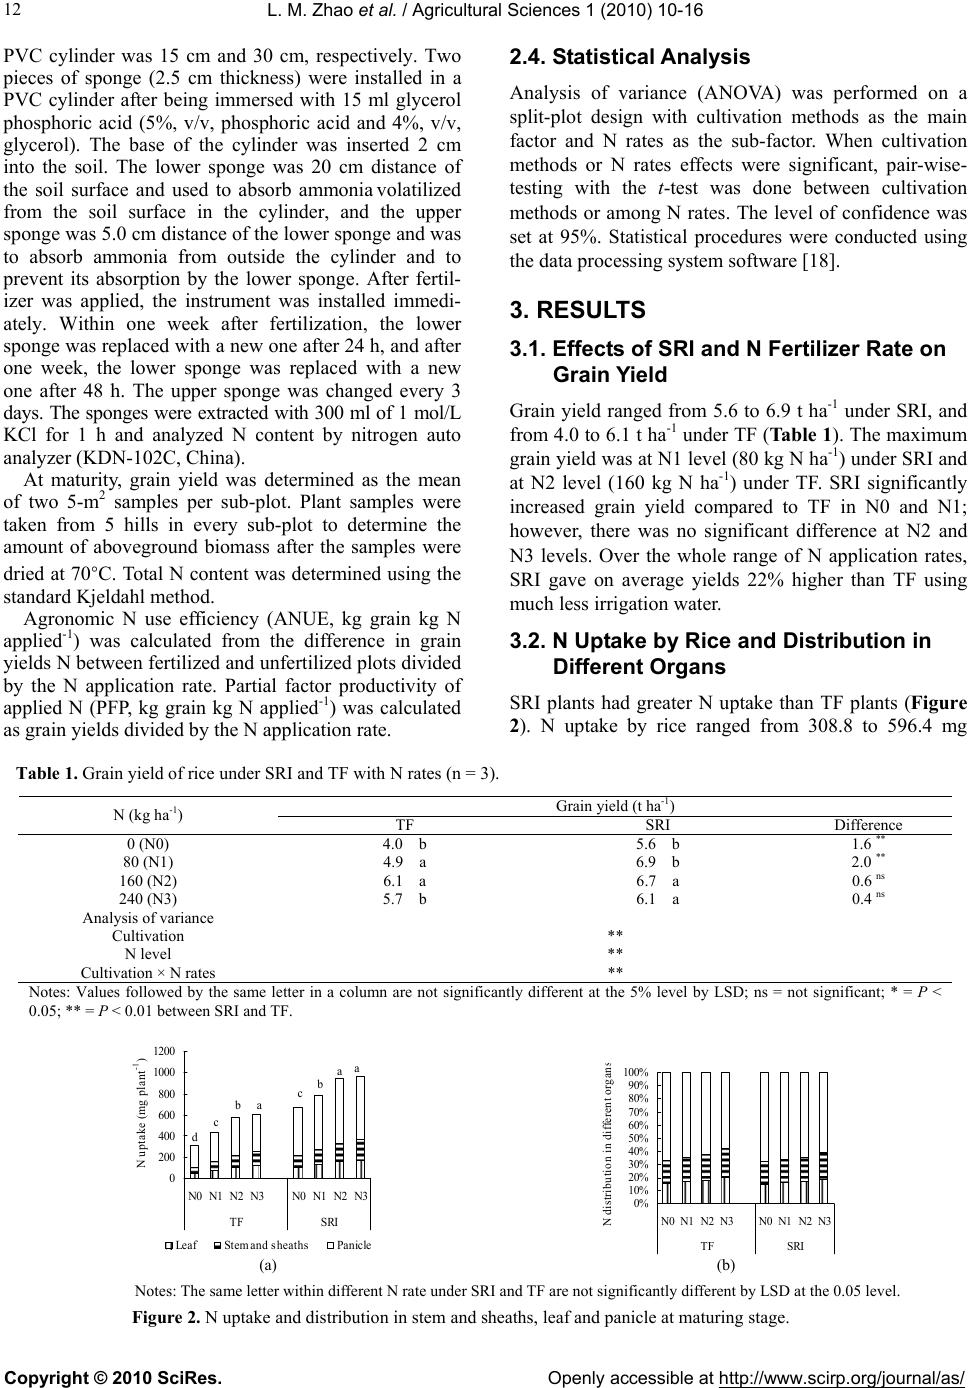 L. M. Zhao et al. / Agricultural Sciences 1 (2010) 10-16 Copyright © 2010 SciRes. Openly accessible at http://www.scirp.org/journal/as/ 12 PVC cylinder was 15 cm and 30 cm, respectively. Two pieces of sponge (2.5 cm thickness) were installed in a PVC cylinder after being immersed with 15 ml glycerol phosphoric acid (5%, v/v, phosphoric acid and 4%, v/v, glycerol). The base of the cylinder was inserted 2 cm into the soil. The lower sponge was 20 cm distance of the soil surface and used to absorb ammonia volatilized from the soil surface in the cylinder, and the upper sponge was 5.0 cm distance of the lower sponge and was to absorb ammonia from outside the cylinder and to prevent its absorption by the lower sponge. After fertil- izer was applied, the instrument was installed immedi- ately. Within one week after fertilization, the lower sponge was replaced with a new one after 24 h, and after one week, the lower sponge was replaced with a new one after 48 h. The upper sponge was changed every 3 days. The sponges were extracted with 300 ml of 1 mol/L KCl for 1 h and analyzed N content by nitrogen auto analyzer (KDN-102C, China). 2.4. Statistical Analysis Analysis of variance (ANOVA) was performed on a split-plot design with cultivation methods as the main factor and N rates as the sub-factor. When cultivation methods or N rates effects were significant, pair-wise- testing with the t-test was done between cultivation methods or among N rates. The level of confidence was set at 95%. Statistical procedures were conducted using the data processing system software [18]. 3. RESULTS 3.1. Effects of SRI and N Fertilizer Rate on Grain Yield Grain yield ranged from 5.6 to 6.9 t ha-1 under SRI, and from 4.0 to 6.1 t ha-1 under TF (Table 1). The maximum grain yield was at N1 level (80 kg N ha-1) under SRI and at N2 level (160 kg N ha-1) under TF. SRI significantly increased grain yield compared to TF in N0 and N1; however, there was no significant difference at N2 and N3 levels. Over the whole range of N application rates, SRI gave on average yields 22% higher than TF using much less irrigation water. At maturity, grain yield was determined as the mean of two 5-m2 samples per sub-plot. Plant samples were taken from 5 hills in every sub-plot to determine the amount of aboveground biomass after the samples were dried at 70◦C. Total N content was determined using the standard Kjeldahl method. Agronomic N use efficiency (ANUE, kg grain kg N applied-1) was calculated from the difference in grain yields N between fertilized and unfertilized plots divided by the N application rate. Partial factor productivity of applied N (PFP, kg grain kg N applied-1) was calculated as grain yields divided by the N application rate. 3.2. N Uptake by Rice and Distribution in Different Organs SRI plants had greater N uptake than TF plants (Figure 2). N uptake by rice ranged from 308.8 to 596.4 mg Table 1. Grain yield of rice under SRI and TF with N rates (n = 3). Grain yield (t ha-1) N (kg ha-1) TF SRI Difference 0 (N0) 4.0 b 5.6 b 1.6 ** 80 (N1) 4.9 a 6.9 b 2.0 ** 160 (N2) 6.1 a 6.7 a 0.6 ns 240 (N3) 5.7 b 6.1 a 0.4 ns ** ** Analysis of variance Cultivation N level Cultivation × N rates ** Notes: Values followed by the same letter in a column are not significantly different at the 5% level by LSD; ns = not significant; * = P < 0.05; ** = P < 0.01 between SRI and TF. 0 200 400 600 800 1000 1200 N0 N1 N2 N3N0 N1 N2 N3 TF SRI N uptake (mg plant -1 ) Leaf Stem and sheathsPanic le a d c ba cb aa 0% 10% 20% 30% 40% 50% 60% 70% 80% 90% 100% N0 N1 N2 N3N0 N1 N2 N3 TF SRI N distribution in different organ s b (a) (b) Notes: The same letter within different N rate under SRI and TF are not significantly different by LSD at the 0.05 level. Figure 2. N uptake and distribution in stem and sheaths, leaf and panicle at maturing stage. 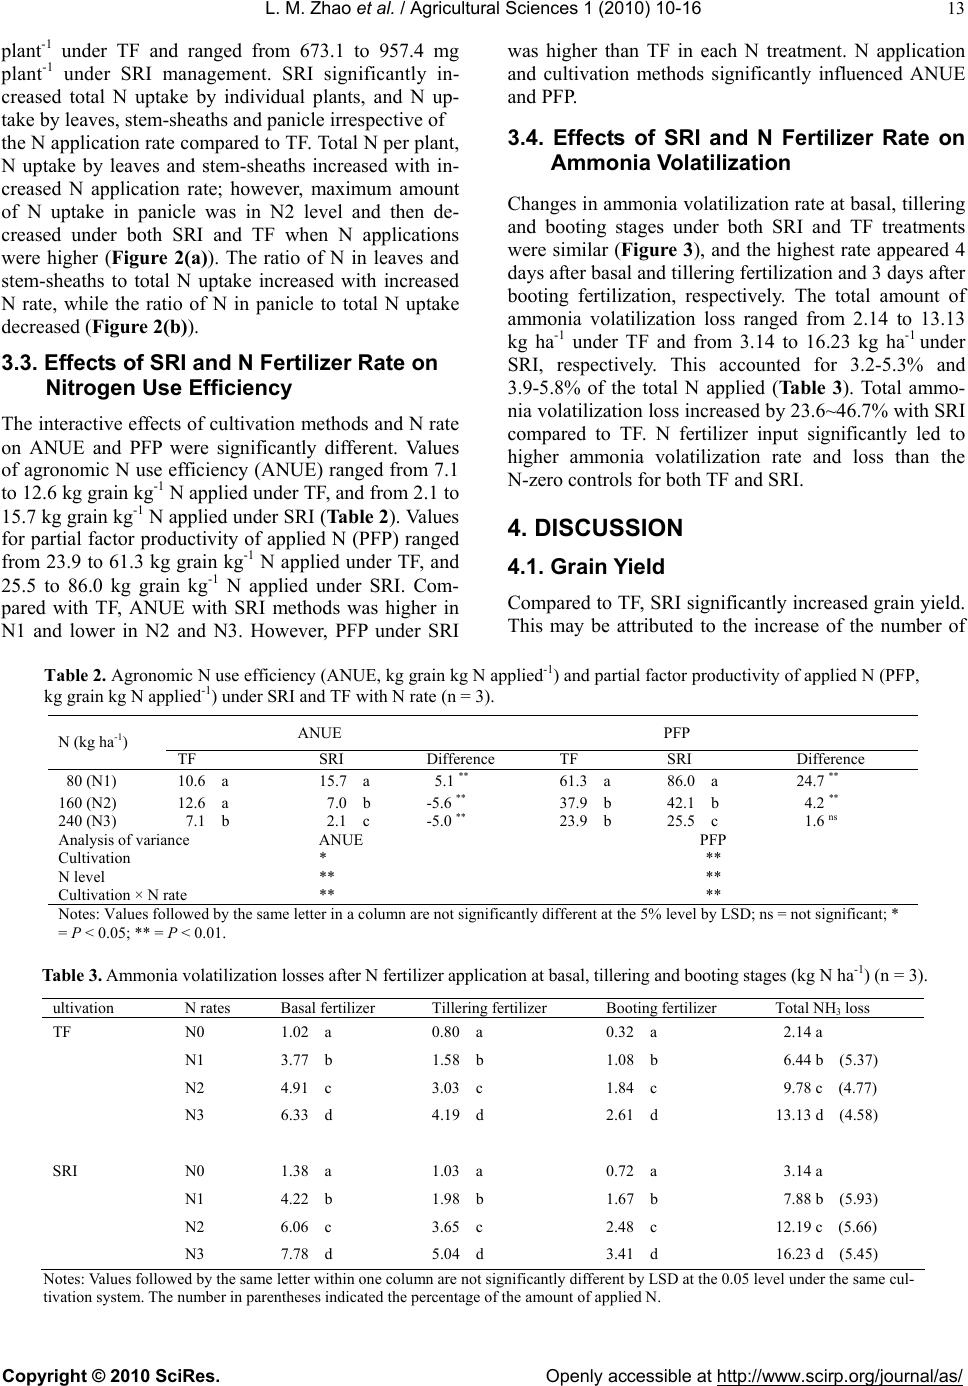 L. M. Zhao et al. / Agricultural Sciences 1 (2010) 10-16 Copyright © 2010 SciRes. Openly accessible at http://www.scirp.org/journal/as/ 13 plant-1 under TF and ranged from 673.1 to 957.4 mg plant-1 under SRI management. SRI significantly in- creased total N uptake by individual plants, and N up- take by leaves, stem-sheaths and panicle irrespective of the N application rate compared to TF. Total N per plant, N uptake by leaves and stem-sheaths increased with in- creased N application rate; however, maximum amount of N uptake in panicle was in N2 level and then de- creased under both SRI and TF when N applications were higher (Figure 2(a)). The ratio of N in leaves and stem-sheaths to total N uptake increased with increased N rate, while the ratio of N in panicle to total N uptake decreased (Figure 2(b)). 3.3. Effects of SRI and N Fertilizer Rate on Nitrogen Use Efficiency The interactive effects of cultivation methods and N rate on ANUE and PFP were significantly different. Values of agronomic N use efficiency (ANUE) ranged from 7.1 to 12.6 kg grain kg-1 N applied under TF, and from 2.1 to 15.7 kg grain kg-1 N applied under SRI (Table 2). Values for partial factor productivity of applied N (PFP) ranged from 23.9 to 61.3 kg grain kg-1 N applied under TF, and 25.5 to 86.0 kg grain kg-1 N applied under SRI. Com- pared with TF, ANUE with SRI methods was higher in N1 and lower in N2 and N3. However, PFP under SRI was higher than TF in each N treatment. N application and cultivation methods significantly influenced ANUE and PFP. 3.4. Effects of SRI and N Fertilizer Rate on Ammonia Volatilization Changes in ammonia volatilization rate at basal, tillering and booting stages under both SRI and TF treatments were similar (Figure 3), and the highest rate appeared 4 days after basal and tillering fertilization and 3 days after booting fertilization, respectively. The total amount of ammonia volatilization loss ranged from 2.14 to 13.13 kg ha-1 under TF and from 3.14 to 16.23 kg ha-1 under SRI, respectively. This accounted for 3.2-5.3% and 3.9-5.8% of the total N applied (Ta b l e 3). Total ammo- nia volatilization loss increased by 23.6~46.7% with SRI compared to TF. N fertilizer input significantly led to higher ammonia volatilization rate and loss than the N-zero controls for both TF and SRI. 4. DISCUSSION 4.1. Grain Yield Compared to TF, SRI significantly increased grain yield. This may be attributed to the increase of the number of Table 2. Agronomic N use efficiency (ANUE, kg grain kg N applied-1) and partial factor productivity of applied N (PFP, kg grain kg N applied-1) under SRI and TF with N rate (n = 3). ANUE PFP N (kg ha-1) TF SRI Difference TF SRI Difference 80 (N1) 10.6 a 15.7 a 5.1 ** 61.3 a 86.0 a 24.7 ** 160 (N2) 12.6 a 7.0 b -5.6 ** 37.9 b 42.1 b 4.2 ** 240 (N3) 7.1 b 2.1 c -5.0 ** 23.9 b 25.5 c 1.6 ns Analysis of variance ANUE PFP Cultivation * ** N level ** ** Cultivation × N rate ** ** Notes: Values followed by the same letter in a column are not significantly different at the 5% level by LSD; ns = not significant; * = P < 0.05; ** = P < 0.01. Table 3. Ammonia volatilization losses after N fertilizer application at basal, tillering and booting stages (kg N ha-1) (n = 3). ultivation N rates Basal fertilizer Tillering fertilizer Booting fertilizer Total NH3 loss TF N0 1.02 a 0.80 a 0.32 a 2.14 a N1 3.77 b 1.58 b 1.08 b 6.44 b (5.37) N2 4.91 c 3.03 c 1.84 c 9.78 c (4.77) N3 6.33 d 4.19 d 2.61 d 13.13 d (4.58) SRI N0 1.38 a 1.03 a 0.72 a 3.14 a N1 4.22 b 1.98 b 1.67 b 7.88 b (5.93) N2 6.06 c 3.65 c 2.48 c 12.19 c (5.66) N3 7.78 d 5.04 d 3.41 d 16.23 d (5.45) Notes: Values followed by the same letter within one column are not significantly different by LSD at the 0.05 level under the same cul- tivation system. The number in parentheses indicated the percentage of the amount of applied N. 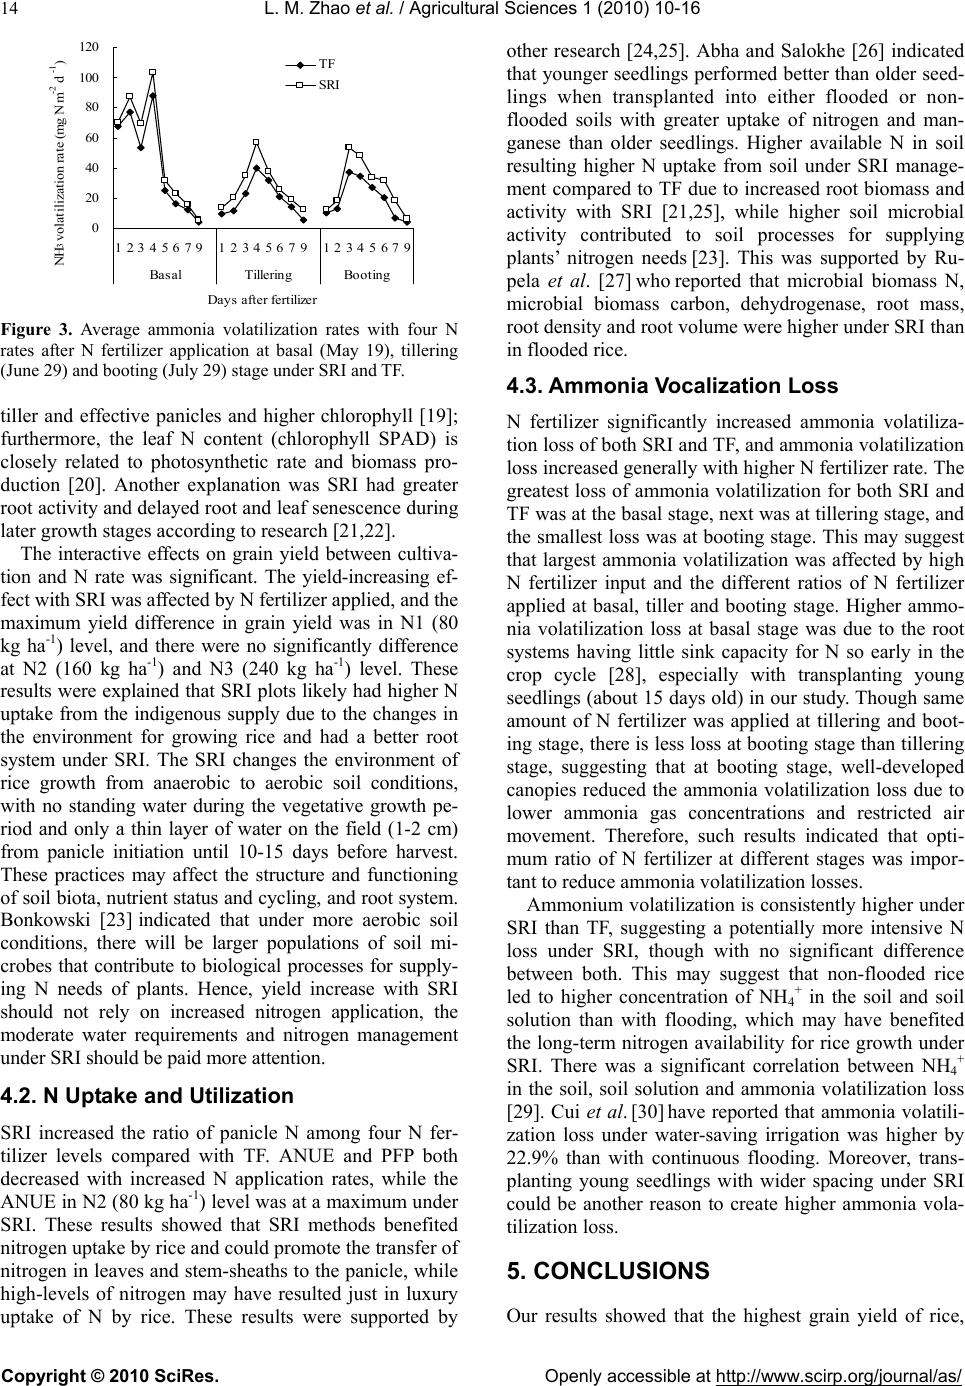 L. M. Zhao et al. / Agricultural Sciences 1 (2010) 10-16 Copyright © 2010 SciRes. Openly accessible at http://www.scirp.org/journal/as/ 14 0 20 40 60 80 100 120 1234567912345679 12345679 Bas alTilleringBoo tin g Days after fertilize r NH 3 volatilization rate (mg N m -2 d -1 ) TF SRI Figure 3. Average ammonia volatilization rates with four N rates after N fertilizer application at basal (May 19), tillering (June 29) and booting (July 29) stage under SRI and TF. tiller and effective panicles and higher chlorophyll [19]; furthermore, the leaf N content (chlorophyll SPAD) is closely related to photosynthetic rate and biomass pro- duction [20]. Another explanation was SRI had greater root activity and delayed root and leaf senescence during later growth stages according to research [21,22]. The interactive effects on grain yield between cultiva- tion and N rate was significant. The yield-increasing ef- fect with SRI was affected by N fertilizer applied, and the maximum yield difference in grain yield was in N1 (80 kg ha-1) level, and there were no significantly difference at N2 (160 kg ha-1) and N3 (240 kg ha-1) level. These results were explained that SRI plots likely had higher N uptake from the indigenous supply due to the changes in the environment for growing rice and had a better root system under SRI. The SRI changes the environment of rice growth from anaerobic to aerobic soil conditions, with no standing water during the vegetative growth pe- riod and only a thin layer of water on the field (1-2 cm) from panicle initiation until 10-15 days before harvest. These practices may affect the structure and functioning of soil biota, nutrient status and cycling, and root system. Bonkowski [23] indicated that under more aerobic soil conditions, there will be larger populations of soil mi- crobes that contribute to biological processes for supply- ing N needs of plants. Hence, yield increase with SRI should not rely on increased nitrogen application, the moderate water requirements and nitrogen management under SRI should be paid more attention. 4.2. N Uptake and Utilization SRI increased the ratio of panicle N among four N fer- tilizer levels compared with TF. ANUE and PFP both decreased with increased N application rates, while the ANUE in N2 (80 kg ha-1) level was at a maximum under SRI. These results showed that SRI methods benefited nitrogen uptake by rice and could promote the transfer of nitrogen in leaves and stem-sheaths to the panicle, while high-levels of nitrogen may have resulted just in luxury uptake of N by rice. These results were supported by other research [24,25]. Abha and Salokhe [26] indicated that younger seedlings performed better than older seed- lings when transplanted into either flooded or non- flooded soils with greater uptake of nitrogen and man- ganese than older seedlings. Higher available N in soil resulting higher N uptake from soil under SRI manage- ment compared to TF due to increased root biomass and activity with SRI [21,25], while higher soil microbial activity contributed to soil processes for supplying plants’ nitrogen needs [23]. This was supported by Ru- pela et al. [27] who reported that microbial biomass N, microbial biomass carbon, dehydrogenase, root mass, root density and root volume were higher under SRI than in flooded rice. 4.3. Ammonia Vocalization Loss N fertilizer significantly increased ammonia volatiliza- tion loss of both SRI and TF, and ammonia volatilization loss increased generally with higher N fertilizer rate. The greatest loss of ammonia volatilization for both SRI and TF was at the basal stage, next was at tillering stage, and the smallest loss was at booting stage. This may suggest that largest ammonia volatilization was affected by high N fertilizer input and the different ratios of N fertilizer applied at basal, tiller and booting stage. Higher ammo- nia volatilization loss at basal stage was due to the root systems having little sink capacity for N so early in the crop cycle [28], especially with transplanting young seedlings (about 15 days old) in our study. Though same amount of N fertilizer was applied at tillering and boot- ing stage, there is less loss at booting stage than tillering stage, suggesting that at booting stage, well-developed canopies reduced the ammonia volatilization loss due to lower ammonia gas concentrations and restricted air movement. Therefore, such results indicated that opti- mum ratio of N fertilizer at different stages was impor- tant to reduce ammonia volatilization losses. Ammonium volatilization is consistently higher under SRI than TF, suggesting a potentially more intensive N loss under SRI, though with no significant difference between both. This may suggest that non-flooded rice led to higher concentration of NH4 + in the soil and soil solution than with flooding, which may have benefited the long-term nitrogen availability for rice growth under SRI. There was a significant correlation between NH4 + in the soil, soil solution and ammonia volatilization loss [29]. Cui et al. [30] have reported that ammonia volatili- zation loss under water-saving irrigation was higher by 22.9% than with continuous flooding. Moreover, trans- planting young seedlings with wider spacing under SRI could be another reason to create higher ammonia vola- tilization loss. 5. CONCLUSIONS Our results showed that the highest grain yield of rice, 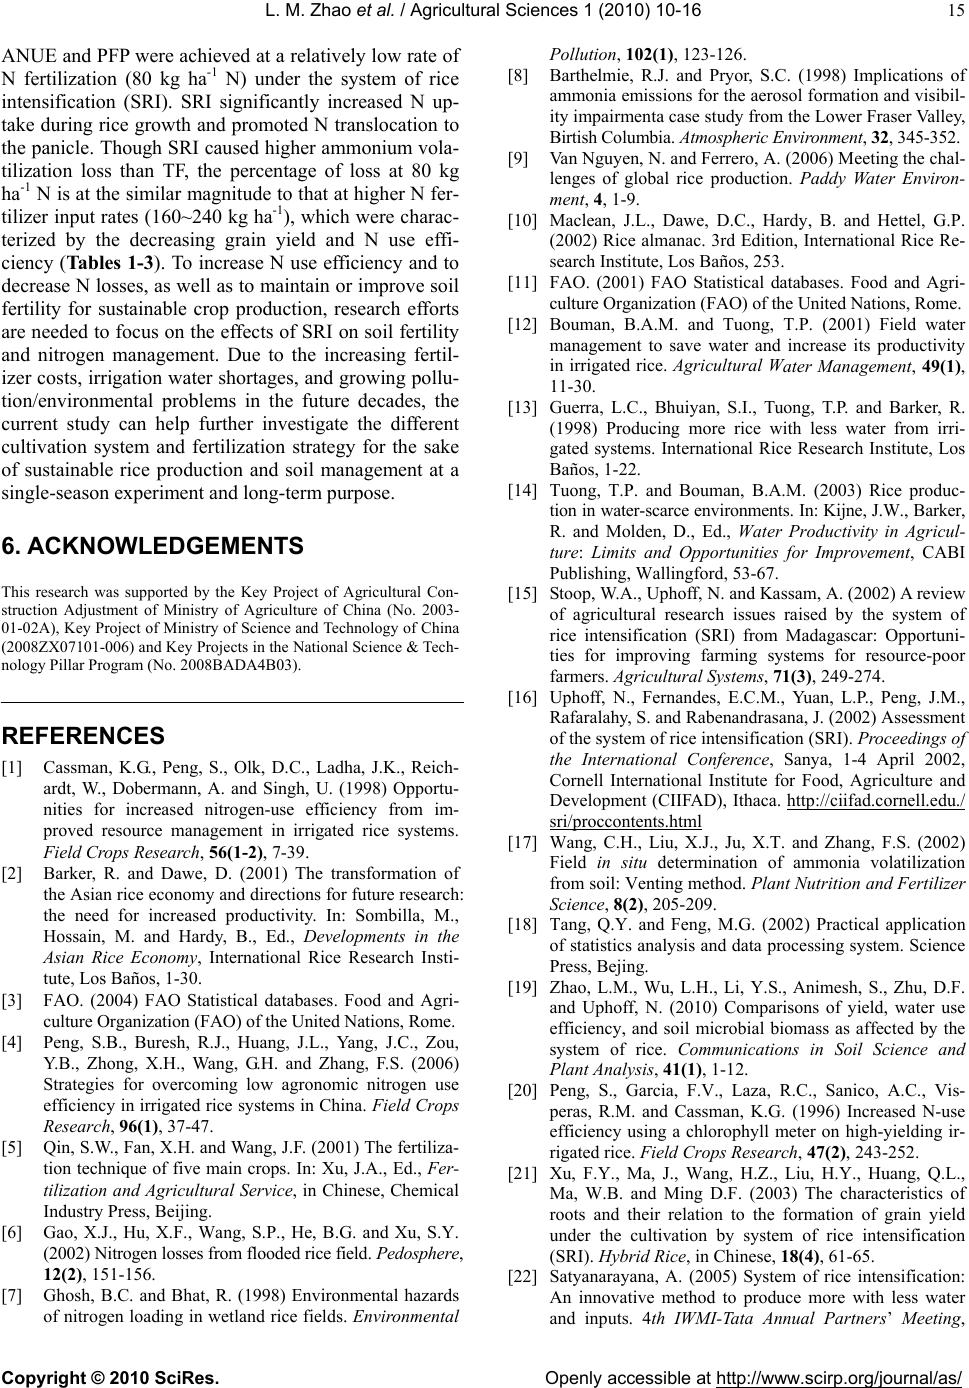 L. M. Zhao et al. / Agricultural Sciences 1 (2010) 10-16 Copyright © 2010 SciRes. Openly accessible at http://www.scirp.org/journal/as/ 15 ANUE and PFP were achieved at a relatively low rate of N fertilization (80 kg ha-1 N) under the system of rice intensification (SRI). SRI significantly increased N up- take during rice growth and promoted N translocation to the panicle. Though SRI caused higher ammonium vola- tilization loss than TF, the percentage of loss at 80 kg ha-1 N is at the similar magnitude to that at higher N fer- tilizer input rates (160~240 kg ha-1), which were charac- terized by the decreasing grain yield and N use effi- ciency (Tables 1-3). To increase N use efficiency and to decrease N losses, as well as to maintain or improve soil fertility for sustainable crop production, research efforts are needed to focus on the effects of SRI on soil fertility and nitrogen management. Due to the increasing fertil- izer costs, irrigation water shortages, and growing pollu- tion/environmental problems in the future decades, the current study can help further investigate the different cultivation system and fertilization strategy for the sake of sustainable rice production and soil management at a single-season experiment and long-term purpose. 6. ACKNOWLEDGEMENTS This research was supported by the Key Project of Agricultural Con- struction Adjustment of Ministry of Agriculture of China (No. 2003- 01-02A), Key Project of Ministry of Science and Technology of China (2008ZX07101-006) and Key Projects in the National Science & Tech- nology Pillar Program (No. 2008BADA4B03). REFERENCES [1] Cassman, K.G., Peng, S., Olk, D.C., Ladha, J.K., Reich- ardt, W., Dobermann, A. and Singh, U. (1998) Opportu- nities for increased nitrogen-use efficiency from im- proved resource management in irrigated rice systems. Field Crops Research, 56(1-2), 7-39. [2] Barker, R. and Dawe, D. (2001) The transformation of the Asian rice economy and directions for future research: the need for increased productivity. In: Sombilla, M., Hossain, M. and Hardy, B., Ed., Developments in the Asian Rice Economy, International Rice Research Insti- tute, Los Baños, 1-30. [3] FAO. (2004) FAO Statistical databases. Food and Agri- culture Organization (FAO) of the United Nations, Rome. [4] Peng, S.B., Buresh, R.J., Huang, J.L., Yang, J.C., Zou, Y.B., Zhong, X.H., Wang, G.H. and Zhang, F.S. (2006) Strategies for overcoming low agronomic nitrogen use efficiency in irrigated rice systems in China. Field Crops Research, 96(1), 37-47. [5] Qin, S.W., Fan, X.H. and Wang, J.F. (2001) The fertiliza- tion technique of five main crops. In: Xu, J.A., Ed., Fer- tilization and Agricultural Service, in Chinese, Chemical Industry Press, Beijing. [6] Gao, X.J., Hu, X.F., Wang, S.P., He, B.G. and Xu, S.Y. (2002) Nitrogen losses from flooded rice field. Pedosphere, 12(2), 151-156. [7] Ghosh, B.C. and Bhat, R. (1998) Environmental hazards of nitrogen loading in wetland rice fields. Environmental Pollution, 102(1), 123-126. [8] Barthelmie, R.J. and Pryor, S.C. (1998) Implications of ammonia emissions for the aerosol formation and visibil- ity impairmenta case study from the Lower Fraser Valley, Birtish Columbia. Atmospheric Environment, 32, 345-352. [9] Van Nguyen, N. and Ferrero, A. (2006) Meeting the chal- lenges of global rice production. Paddy Water Environ- ment, 4, 1-9. [10] Maclean, J.L., Dawe, D.C., Hardy, B. and Hettel, G.P. (2002) Rice almanac. 3rd Edition, International Rice Re- search Institute, Los Baños, 253. [11] FAO. (2001) FAO Statistical databases. Food and Agri- culture Organization (FAO) of the United Nations, Rome. [12] Bouman, B.A.M. and Tuong, T.P. (2001) Field water management to save water and increase its productivity in irrigated rice. Agricultural Water Management, 49(1), 11-30. [13] Guerra, L.C., Bhuiyan, S.I., Tuong, T.P. and Barker, R. (1998) Producing more rice with less water from irri- gated systems. International Rice Research Institute, Los Baños, 1-22. [14] Tuong, T.P. and Bouman, B.A.M. (2003) Rice produc- tion in water-scarce environments. In: Kijne, J.W., Barker, R. and Molden, D., Ed., Water Productivity in Agricul- ture: Limits and Opportunities for Improvement, CABI Publishing, Wallingford, 53-67. [15] Stoop, W.A., Uphoff, N. and Kassam, A. (2002) A review of agricultural research issues raised by the system of rice intensification (SRI) from Madagascar: Opportuni- ties for improving farming systems for resource-poor farmers. Agricultural Systems, 71(3), 249-274. [16] Uphoff, N., Fernandes, E.C.M., Yuan, L.P., Peng, J.M., Rafaralahy, S. and Rabenandrasana, J. (2002) Assessment of the system of rice intensification (SRI). Proceedings of the International Conference, Sanya, 1-4 April 2002, Cornell International Institute for Food, Agriculture and Development (CIIFAD), Ithaca. http://ciifad.cornell.edu./ sri/proccontents.html [17] Wang, C.H., Liu, X.J., Ju, X.T. and Zhang, F.S. (2002) Field in situ determination of ammonia volatilization from soil: Venting method. Plant Nutrition and Fertilizer Science, 8(2), 205-209. [18] Tang, Q.Y. and Feng, M.G. (2002) Practical application of statistics analysis and data processing system. Science Press, Bejing. [19] Zhao, L.M., Wu, L.H., Li, Y.S., Animesh, S., Zhu, D.F. and Uphoff, N. (2010) Comparisons of yield, water use efficiency, and soil microbial biomass as affected by the system of rice. Communications in Soil Science and Plant Analysis, 41(1), 1-12. [20] Peng, S., Garcia, F.V., Laza, R.C., Sanico, A.C., Vis- peras, R.M. and Cassman, K.G. (1996) Increased N-use efficiency using a chlorophyll meter on high-yielding ir- rigated rice. Field Crops Research, 47(2), 243-252. [21] Xu, F.Y., Ma, J., Wang, H.Z., Liu, H.Y., Huang, Q.L., Ma, W.B. and Ming D.F. (2003) The characteristics of roots and their relation to the formation of grain yield under the cultivation by system of rice intensification (SRI). Hybrid Rice, in Chinese, 18(4), 61-65. [22] Satyanarayana, A. (2005) System of rice intensification: An innovative method to produce more with less water and inputs. 4th IWMI-Tata Annual Partners’ Meeting, 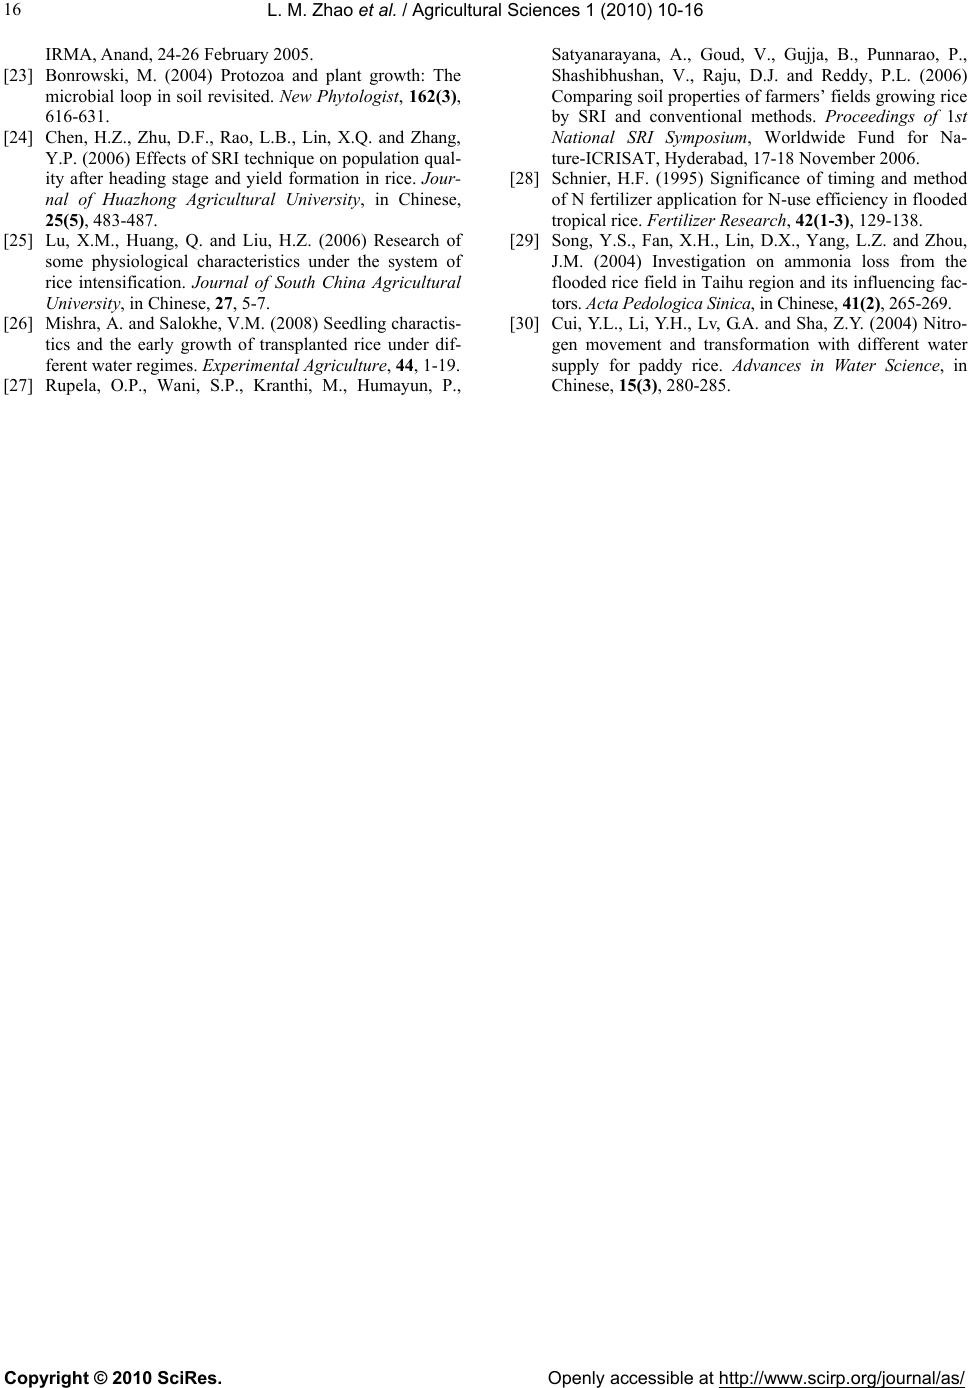 L. M. Zhao et al. / Agricultural Sciences 1 (2010) 10-16 Copyright © 2010 SciRes. Openly accessible at http://www.scirp.org/journal/as/ 16 IRMA, Anand, 24-26 February 2005. [23] Bonrowski, M. (2004) Protozoa and plant growth: The microbial loop in soil revisited. New Phytologist, 162(3), 616-631. [24] Chen, H.Z., Zhu, D.F., Rao, L.B., Lin, X.Q. and Zhang, Y.P. (2006) Effects of SRI technique on population qual- ity after heading stage and yield formation in rice. Jour- nal of Huazhong Agricultural University, in Chinese, 25(5), 483-487. [25] Lu, X.M., Huang, Q. and Liu, H.Z. (2006) Research of some physiological characteristics under the system of rice intensification. Journal of South China Agricultural University, in Chinese, 27, 5-7. [26] Mishra, A. and Salokhe, V.M. (2008) Seedling charactis- tics and the early growth of transplanted rice under dif- ferent water regimes. Experimental Agriculture, 44, 1-19. [27] Rupela, O.P., Wani, S.P., Kranthi, M., Humayun, P., Satyanarayana, A., Goud, V., Gujja, B., Punnarao, P., Shashibhushan, V., Raju, D.J. and Reddy, P.L. (2006) Comparing soil properties of farmers’ fields growing rice by SRI and conventional methods. Proceedings of 1st National SRI Symposium, Worldwide Fund for Na- ture-ICRISAT, Hyderabad, 17-18 November 2006. [28] Schnier, H.F. (1995) Significance of timing and method of N fertilizer application for N-use efficiency in flooded tropical rice. Fertilizer Research, 42(1-3), 129-138. [29] Song, Y.S., Fan, X.H., Lin, D.X., Yang, L.Z. and Zhou, J.M. (2004) Investigation on ammonia loss from the flooded rice field in Taihu region and its influencing fac- tors. Acta Pedologica Sinica, in Chinese, 41(2), 265-269. [30] Cui, Y.L., Li, Y.H., Lv, G.A. and Sha, Z.Y. (2004) Nitro- gen movement and transformation with different water supply for paddy rice. Advances in Water Science, in Chinese, 15(3), 280-285. |