

Paper Menu >>
Journal Menu >>
 Sociology Mind 2012. Vol.2, No.2, 148-152 Published Online April 2012 in SciRes (http://www.SciRP.org/journal/sm) http://dx.doi.org/10.4236/sm.2012.22019 Copyright © 2012 SciRes. 148 Young Child Homicide and Accidental Death Rates in the United States, 1940-2005: Classification Issues in Mutually Exclusive Events Jack E. Riggs1, Gerald R. Hobbs2 1Department of Neurology, West Virginia University, Morgantown, USA 2Department of Stati s tics, West Virginia University, Morgantown, USA Email: [email protected] du Received December 9th, 2011; revised January 10th, 2012; accepte d F e b ru ary 11th, 2012 Events that are mutually exclusive, collectively exhaustive, and have a constant sum must be negatively correlated. This study examined whether non-motor vehicle accidental deaths and homicides in young US children displayed a period of time when this rule governing mutually exclusive events was applicable. Homicide and non-motor vehicle accident mortality rates in boys and girls, aged 1 to 4 years old, in the United States from 1940 to 2005 were analyzed. Homicide mortality rates increased sharply in young boys when the accident mortality rate dropped to about 25/100,000; and in young girls, when the accident mortality dropped to about 18/100,000. This increase in child homicide mortality rates corresponded to a time period when the sum of homicide rates and non-motor vehicle accident rates in these children were relatively constant, making these rates of unnatural deaths mutually exclusive, collectively exhaustive, and having a nearly constant sum. Homicide rates in young US children were relatively stable both before and after this critical constant sum time period. These findings suggest that the increase in homicide rates in young US children appear to have reflected the necessary negative correlation between mutually exclu- sive, collectively exhaustive, and constant sum events, rather than an actual increase in societal violence directed against young children. Keywords: Accidental Death Rates; Child; Classification; Homicide Rates; Mutually Exclusive Events Introduction Unnatural deaths may be classified into four categories; homicide, suicide, motor vehicle accident, and non-motor vehi- cle accident. These four categories are mutually exclusive. That is, the cause of each unnatural death can be attributed to only one of these four categories. Young children, aged 1 to 4 years old, do not commit suicide. Death due to a motor vehicle acci- dent is generally obvious and for classification purposes, rela- tively judgment-independent. Accordingly, for the purpose of this study, young child motor vehicle accident deaths were excluded. In this study, non-motor vehicle accident deaths are referred to as accidental deaths. Therefore, this study examined the rates of two mutually exclusive events; young child homi- cides and young child accidental deaths. Each non-motor vehi- cle accident unnatural young child death must be classified as either a homicide or as an accident; it cannot be both and some mechanism of classifying that death must be exercised in each such young child death. Events that are mutually exclusive, collectively exhaustive, and have a constant sum must be negatively correlated. More- over, the reliability of nominal data (such as whether the un- natural death of a young child was an accident or a homicide) that is based upon judgment can be questioned (Cohen, 1960; Perreault & Leigh, 1989). Indeed, a prerequisite for measuring interobserver agreement on such judgments is that the nominal data categories must be mutually exclusive and exhaustive (Cohen, 1960). The underappreciated rules governing the clas- sification of mutually exclusive events was studied in the classification of unnatural infant deaths as either accidental deaths or homicides (Riggs & Hobbs, 2011). The consequences of classification in those mutually exclusive events have impli- cations for society, the victims, and in the case of homicide, the accused perpetrators. In US infants, homicide rates increased sharply only during the time period when the sum of infant homicide rates and infant non-motor vehicle accidental death rates were relatively constant (Riggs & Hobbs, 2011). During that period, when these two events that are mutually exclusive, collectively exhaustive, and had a relatively constant sum; an increase in the rate of one of those two mutually exclusive events was associated with a corresponding decrease in the rate of the other event. This purpose of this study was to examine whether non-mot or vehicle accidental deaths and homicides in young US children (aged 1 to 4 years) displayed a period of time when this rule governing mutually exclusive, exhaustive, and constant sum events was also applicable. Data This study utilized publicly accessible data provided through the National Center for Health Statistics website (www.cdc.gov/nchs). Young child (defined as a child aged from 1 year old to less than 5 years old) homicide and accident mortality rates (per 100,000) for both boys and girls in the United States for the years 1940 through 2005 are shown in Tables 1 and 2. 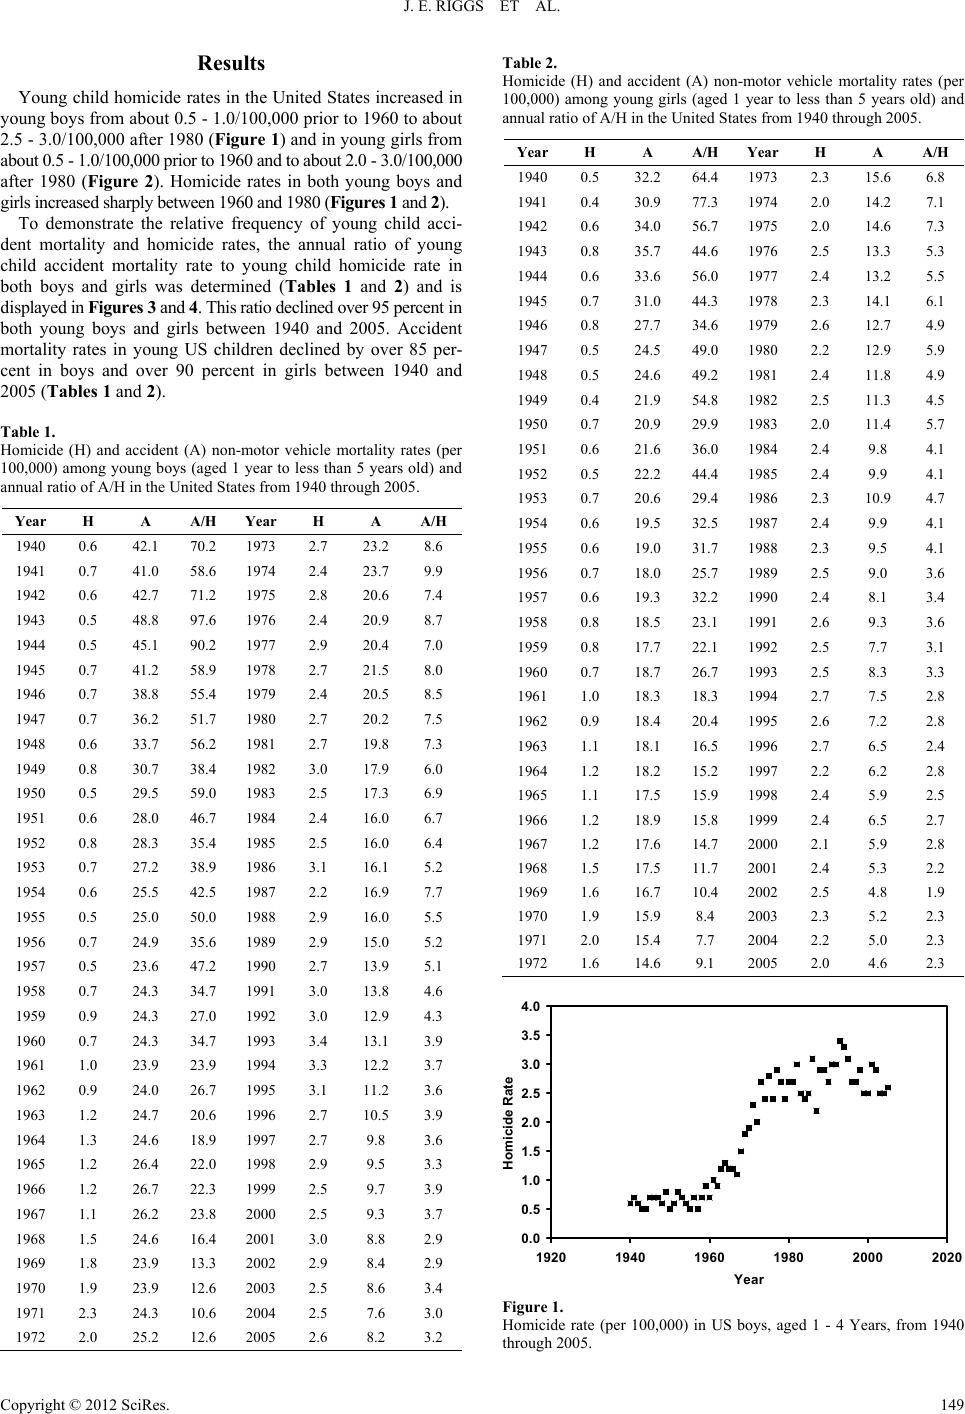 J. E. RIGGS ET AL. Results Young child homicide rates in the United States increased in young boys from about 0.5 - 1.0/100,000 prior to 1960 to about 2.5 - 3.0/100,000 after 1980 (Figure 1) and in young girls from about 0.5 - 1.0/100,000 prior to 1960 and to about 2.0 - 3.0/100,000 after 1980 (Figure 2). Homicide rates in both young boys and girls incr eased s harp ly be tween 1960 and 1980 ( Figures 1 and 2 ). To demonstrate the relative frequency of young child acci- dent mortality and homicide rates, the annual ratio of young child accident mortality rate to young child homicide rate in both boys and girls was determined (Tables 1 and 2) and is displayed in Figures 3 and 4. This ratio declined over 95 percent in both young boys and girls between 1940 and 2005. Accident mortality rates in young US children declined by over 85 per- cent in boys and over 90 percent in girls between 1940 and 2005 (Tables 1 and 2). Table 1. Homicide (H) and accident (A) non-motor vehicle mortality rates (per 100,000) among young boys (aged 1 year to less than 5 years old) and annual ratio of A/H in the United States from 19 40 through 2005. Year H A A/H Year H A A/H 1940 0.6 42.1 70.2 1973 2.7 23.2 8.6 1941 0.7 41.0 58.6 1974 2.4 23.7 9.9 1942 0.6 42.7 71.2 1975 2.8 20.6 7.4 1943 0.5 48.8 97.6 1976 2.4 20.9 8.7 1944 0.5 45.1 90.2 1977 2.9 20.4 7.0 1945 0.7 41.2 58.9 1978 2.7 21.5 8.0 1946 0.7 38.8 55.4 1979 2.4 20.5 8.5 1947 0.7 36.2 51.7 1980 2.7 20.2 7.5 1948 0.6 33.7 56.2 1981 2.7 19.8 7.3 1949 0.8 30.7 38.4 1982 3.0 17.9 6.0 1950 0.5 29.5 59.0 1983 2.5 17.3 6.9 1951 0.6 28.0 46.7 1984 2.4 16.0 6.7 1952 0.8 28.3 35.4 1985 2.5 16.0 6.4 1953 0.7 27.2 38.9 1986 3.1 16.1 5.2 1954 0.6 25.5 42.5 1987 2.2 16.9 7.7 1955 0.5 25.0 50.0 1988 2.9 16.0 5.5 1956 0.7 24.9 35.6 1989 2.9 15.0 5.2 1957 0.5 23.6 47.2 1990 2.7 13.9 5.1 1958 0.7 24.3 34.7 1991 3.0 13.8 4.6 1959 0.9 24.3 27.0 1992 3.0 12.9 4.3 1960 0.7 24.3 34.7 1993 3.4 13.1 3.9 1961 1.0 23.9 23.9 1994 3.3 12.2 3.7 1962 0.9 24.0 26.7 1995 3.1 11.2 3.6 1963 1.2 24.7 20.6 1996 2.7 10.5 3.9 1964 1.3 24.6 18.9 1997 2.7 9.8 3.6 1965 1.2 26.4 22.0 1998 2.9 9.5 3.3 1966 1.2 26.7 22.3 1999 2.5 9.7 3.9 1967 1.1 26.2 23.8 2000 2.5 9.3 3.7 1968 1.5 24.6 16.4 2001 3.0 8.8 2.9 1969 1.8 23.9 13.3 2002 2.9 8.4 2.9 1970 1.9 23.9 12.6 2003 2.5 8.6 3.4 1971 2.3 24.3 10.6 2004 2.5 7.6 3.0 1972 2.0 25.2 12.6 2005 2.6 8.2 3.2 Table 2. Homicide (H) and accident (A) non-motor vehicle mortality rates (per 100,000) among young girls (aged 1 year to less than 5 years old) and annual ratio of A/H in the United States from 19 40 through 2005. YearH A A/H Year H A A/H 19400.5 32.2 64.4 1973 2.3 15.6 6.8 19410.4 30.9 77.3 1974 2.0 14.2 7.1 19420.6 34.0 56.7 1975 2.0 14.6 7.3 19430.8 35.7 44.6 1976 2.5 13.3 5.3 19440.6 33.6 56.0 1977 2.4 13.2 5.5 19450.7 31.0 44.3 1978 2.3 14.1 6.1 19460.8 27.7 34.6 1979 2.6 12.7 4.9 19470.5 24.5 49.0 1980 2.2 12.9 5.9 19480.5 24.6 49.2 1981 2.4 11.8 4.9 19490.4 21.9 54.8 1982 2.5 11.3 4.5 19500.7 20.9 29.9 1983 2.0 11.4 5.7 19510.6 21.6 36.0 1984 2.4 9.8 4.1 19520.5 22.2 44.4 1985 2.4 9.9 4.1 19530.7 20.6 29.4 1986 2.3 10.9 4.7 19540.6 19.5 32.5 1987 2.4 9.9 4.1 19550.6 19.0 31.7 1988 2.3 9.5 4.1 19560.7 18.0 25.7 1989 2.5 9.0 3.6 19570.6 19.3 32.2 1990 2.4 8.1 3.4 19580.8 18.5 23.1 1991 2.6 9.3 3.6 19590.8 17.7 22.1 1992 2.5 7.7 3.1 19600.7 18.7 26.7 1993 2.5 8.3 3.3 19611.0 18.3 18.3 1994 2.7 7.5 2.8 19620.9 18.4 20.4 1995 2.6 7.2 2.8 19631.1 18.1 16.5 1996 2.7 6.5 2.4 19641.2 18.2 15.2 1997 2.2 6.2 2.8 19651.1 17.5 15.9 1998 2.4 5.9 2.5 19661.2 18.9 15.8 1999 2.4 6.5 2.7 19671.2 17.6 14.7 2000 2.1 5.9 2.8 19681.5 17.5 11.7 2001 2.4 5.3 2.2 19691.6 16.7 10.4 2002 2.5 4.8 1.9 19701.9 15.9 8.4 2003 2.3 5.2 2.3 19712.0 15.4 7.7 2004 2.2 5.0 2.3 19721.6 14.6 9.1 2005 2.0 4.6 2.3 0.0 0.5 1.0 1.5 2.0 2.5 3.0 3.5 4.0 1920 1940 1960 1980 2000 2020 Year Homicide Rate Figure 1. Homicide rate (per 100,000) in US boys, aged 1 - 4 Years, from 1940 through 2005. Copyright © 2012 SciRes. 149 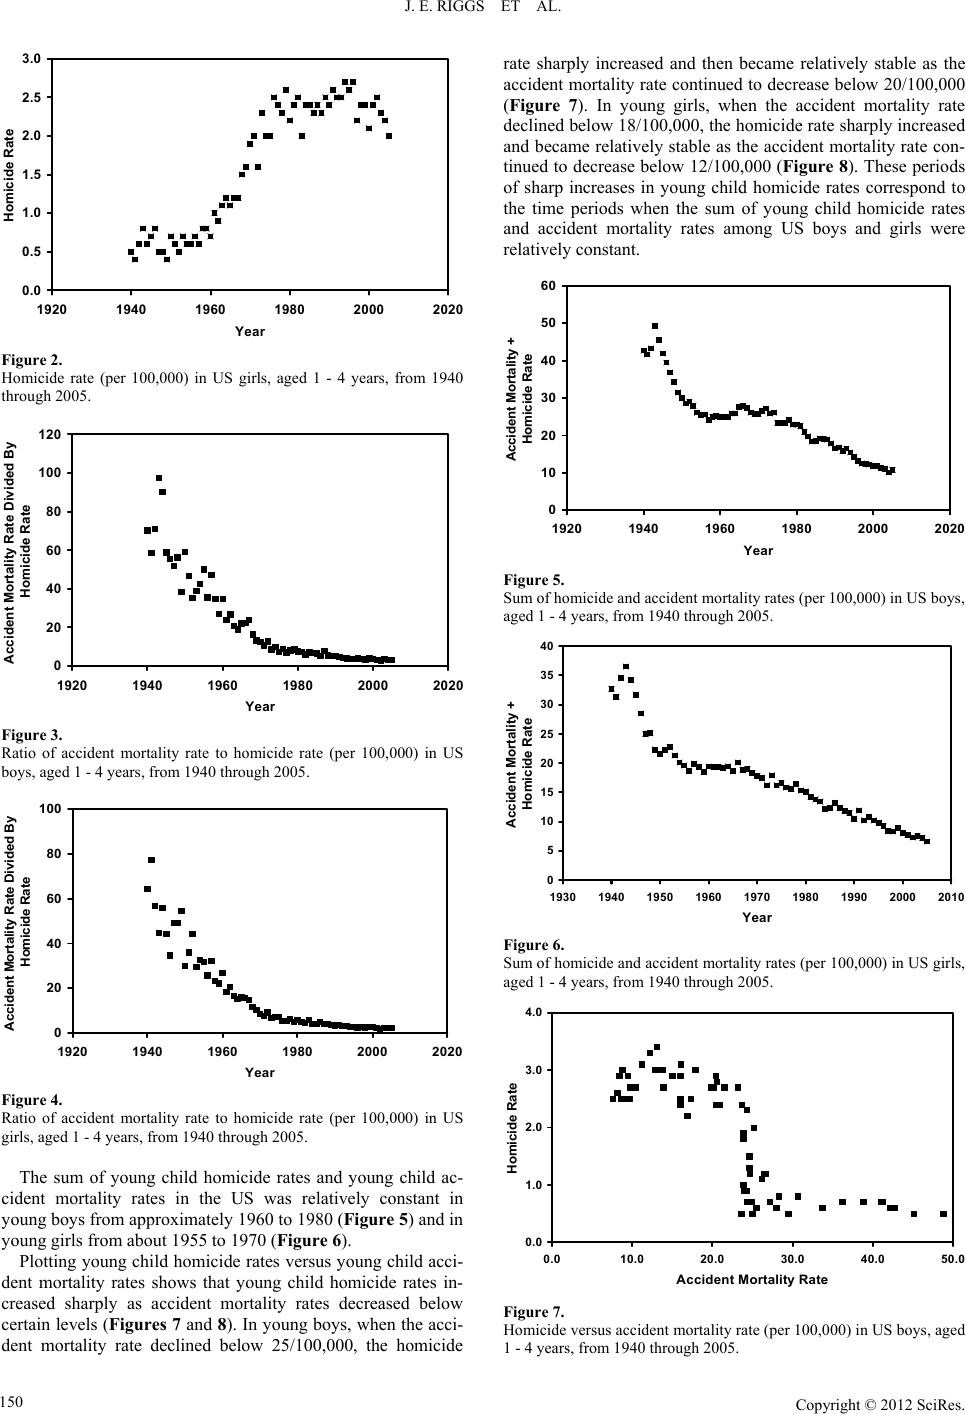 J. E. RIGGS ET AL. 0.0 0.5 1.0 1.5 2.0 2.5 3.0 1920 1940 1960 1980 20002020 Year Homicide Rate Figure 2. Homicide rate (per 100,000) in US girls, aged 1 - 4 years, from 1940 through 2005. 0 20 40 60 80 100 120 1920 1940 1960 1980 2000 2020 Year Accident Mortality Rate Divided By Homicide Rate Figure 3. Ratio of accident mortality rate to homicide rate (per 100,000) in US boys, aged 1 - 4 years, from 1940 through 2005. 0 20 40 60 80 100 1920 1940 1960 1980 2000202 0 Year Accident Mortality Rate Divided By Homicid e R a te Figure 4. Ratio of accident mortality rate to homicide rate (per 100,000) in US girls, aged 1 - 4 years, fr om 1940 through 2005. The sum of young child homicide rates and young child ac- cident mortality rates in the US was relatively constant in young boys from approximately 1960 to 1980 (Figure 5) and in young girls from about 1955 to 1970 (Figure 6). Plotting young child homicide rates versus young child acci- dent mortality rates shows that young child homicide rates in- creased sharply as accident mortality rates decreased below certai n levels (Figures 7 and 8). In young boys, when the acci- dent mortality rate declined below 25/100,000, the homicide rate sharply increased and then became relatively stable as the accident mortality rate continued to decrease below 20/100,000 (Figure 7). In young girls, when the accident mortality rate declined below 18/100,000, the homicide rate sharply increased and became relatively stable as the accident mortality rate con- tinued to decrease below 12/100,000 (Figure 8). These periods of sharp increases in young child homicide rates correspond to the time periods when the sum of young child homicide rates and accident mortality rates among US boys and girls were relatively consta nt . 0 10 20 30 40 50 60 1920 1940 1960 1980 2000 2020 Year Accident Mortality + Homicide Rate Figure 5. Sum of homicide and accid ent mortality rates (per 100,000) i n US boys, aged 1 - 4 years, from 194 0 th rough 2005. 0 5 10 15 20 25 30 35 40 1930 1940 1950 1960 1970 1980 1990 2000 2010 Year Accident Mortality + Homicide Rate Figure 6. Sum of homicide and accident mortality rates (per 100,000) in US girls, aged 1 - 4 years, from 194 0 th rough 2005. 0.0 1.0 2.0 3.0 4.0 0.010.0 20.0 30.0 40.0 50.0 Accident Mortality Rate Homicid e R a t e Figure 7. Homicide versus accident mortality rate (per 100,000) in US boys, aged 1 - 4 years, from 1940 thr ough 2005. Copyright © 2012 SciRes. 150  J. E. RIGGS ET AL. 0.0 1.0 2.0 3.0 0.05.010.0 15.0 20.0 25.0 30.0 35.0 40.0 Accident Mortality Rate Homicide Rate Figure 8. Homicide versus accident mortality rate (per 100,000) in US girls, aged 1 - 4 years, from 1940 thr ough 2005. Discussion Young child homicide is frequently related to child abuse (Jenny & Isaac, 2006) or psychiatric dysfunction in a custodial adult (Friedman et al., 2005; Nielssen et al., 2009). Head inju- ries, drowning, and suffocation are the most frequent causes of death due to homicide in young children (Reece & Sege, 2000; Tung et al., 2006; Vanamo et al., 2001). Investigators have sug- gested that the actual magnitude of fatal child abuse has been underestimated (Crume et al., 2002; Herman-Giddens et al., 1999). Beginning in the 1960’s to the 1980’s, the problem of young child abuse and homicide became the focus of increased societal attention (Adelson, 1961; Christoffel, 1984; Kempe et al., 1962; Jason, 1983). Similar to infants (Riggs & Hobbs, 2011), young child acci- dent mortality rates in both boys and girls decreased over 85 percent in the United States between 1940 and 2005 (Tables 1 and 2, and Figures 3 and 4), reflecting improved societal injury prevention and trauma management. Also similar to infants (Riggs & Hobbs, 2011), young child homicide and accident mortality rates were slightly higher in boys than in girls (Ta- bles 1 and 2). When classifying two mutually exclusive events, their rela- tive natural frequency may be important. For example, if event A and event B are potentially difficult to distinguish and event A is much more frequent, there may be a tendency to bias clas- sification towards event A. However, if event A becomes less frequent and the sensitivity to recognizing event B is increasing, there may be a tendency to bias classification towards event B. This line of reasoning was suggested as contributing to the observed increase in infant homicide rates in the United States after 1980 (Riggs & Hobbs, 2011). In the case of young child homicide, homicide rates in the US increased predominantly during the period of time when the sum of young child homi- cide and accident mortality remained relatively constant (Fig- ures 1, 2, 5-8). This same phenomenon was also observed in US infants. Infant homicide rates in the US increased during the period of time when the sum of infant homicide and accident mortality rates were relatively constant (Riggs & Hobbs, 2011). Moreover, if the ratio of accident mortality to homicide mortal- ity in young children is consistently declining (as shown in Tables 1 and 2, and illustrated in Figures 3 and 4), during the periods when the sum of accident mortality and homicide rates are relatively constant and necessarily n eg a ti ve ly c or re l at ed , th e n homicide rates that must go up. If accident mortality rates where to go up during those periods, then the ratio of accident mortality rates to homicide rates would have also had to in- crease; and that did not occur. These findings suggest that the logic rules governing two mutually exclusive, collectively exhaustive, and relatively con- stant sum events are consistent with and describe the observed increased reported young child homicide rates in US boys and girls. These logic rules may also explain why the influence of declining young child accident mortality and increased societal sensitivity to child abuse were not associated with continued increasing young child homicide rates despite the fact that both of these influences continued to occur after the critical time periods when the sum of the rates of young child homicide and accident mortality rates were relatively constant. Moreover, it seems rather unlikely that societal violence in the United States would have been increased against young children before 1980 (as observed in this study) and would have separately and dis- tinctly increased against infants after 1980 (Riggs & Hobbs, 2011). Epidemiological data is crucial in identifying and monitoring societal problems. Classification mechanisms are routinely used in the production of epidemiological data, and those classifica- tion mechanisms can have significant societal implications and consequences. This study suggests that the logic rules govern- ing mutually exclusive, collectively exhaustive, and constant sum events described the classification process of distinguish- ing young child accidental deaths from homicides, similar to what was observed in US i nfants (Riggs & Hobbs, 2011 ). More- over, these findings suggest that the increase in the homicide rates observed among young US children may have reflected the necessary negative correlation between mutually exclusive, collectively exhaustive, and constant sum events rather than an actual increase in societal violence directed against young chil- dren, similar to the pattern observed after 1980 among US in- fants. These observations illustrate the potential hazard of fo- cusing attention on the measurement of one mutually exclusive event (the homicide rate) without also considering the influence of the other mutually exclusive event (the accident mortality rate). This changing classification propensity, as demonstrated in this study, appears to emerge spontaneously in the epidemi- ological classification process of events that are mutually ex- clusive, collectively exhaustive, and that have a relative con- stant sum. Moreover, this changing classification propensity ap- pears to occur despite the best intentions and expertise of all those individuals who are independently involved in the classi- fication process of each such unnatural death in young children. Child abuse and homicide is a serious societal problem that cannot be tolerated. However, the inaccurate classification of a young child death as a homicide, rather than an accident, also has unacceptable and intolerable consequences. This study only examined unnatural mortality classified and reported as either homicide or non-motor vehicle accident mor- tality. This study did not examine natural mortality due to ill- ness. Consequently, no inferences can, or should, be derived from this study regarding misclassification between natural and unnatural deaths. REFERENCES Adelson, L. (1961). Slaughter of the innocents, a study of forty-six homicides in which the victims were children. New England Journal Copyright © 2012 SciRes. 151  J. E. RIGGS ET AL. Copyright © 2012 SciRes. 152 of Medicine, 264, 1345-1349. doi:10.1056/NEJM196106292642606 Christoffel, K. K. (1984). Homicide in childhood: A public health prob- lem in need of attention. American Journal of Public Health, 74, 68- 70. doi:10.2105/AJPH.74.1.68 Cohen, J. (1960). A coefficient of agreement for nominal scales. Edu- cational and Psychological Measurement, 20, 37-46. doi:10.1177/001316446002000104 Crume, T. L., DiG u isep p i, C., Byers, T., Sirotn ak , A. P., & Garrett, C. J. (2002). Underascertainment of child maltreatment fatalities by death certificates, 1990-1998. Pediatrics, 110, e18. doi:10.1542/peds.110.2.e18 Friedman, S. H., Horwitz, S. M., & Resnick, P. J. (2005). Child murder by mothers: A critical analysis of the current state of knowledge and a research agenda. American Journal of Psychiatry, 162, 1578-1587. doi:10.1176/appi.ajp.162.9.1578 Herman-Giddens, M. C., Bro wn , G., Verb iest, S. , Carlson, P. J., Hooten , E. G., Howell, E., & Butts, J. D. (1999). Underascertainment of child abuse mortality in the United States. Journal of the American Medi- cal Association, 282, 463-467. doi:10.1001/jama.282.5.463 Jason, J. (1983). Child Homicide spectrum. American Journal of Dis- eases of Children, 137, 578-5 81. Jenny, C., & Isaac, R. ( 2006). The relation between child death and child maltreatment. Archives of Disease in Childhood, 91, 265-269. doi:10.1136/adc.2004.066696 Kempe, C. H., Silverman, F. N., Steele, B. F., Droegemueller, W., & Silver, H. K. (1962). The battered-child syndrome. Journal of the American Medical Association, 181, 17-24. doi:10.1001/jama.1962.03050270019004 Nielssen, O. B., Large, M. M., Westmore, B. D., & La ckersteen, S. M. (2009). Child homicide in New South Wales from 1991 to 2005. Medical Journal of Australia, 190, 7-11. Perreault, W. D., & Leigh, L. E. (1989). Reliability of nominal data based on qualitative judgments. Journal of Marketing Research, 26, 135-148. doi:10.2307/3172601 Reece, R. M., & Sege, R. (2000). Childhood head injuries, accidental or inflicted? Archives of Pediatric and Adolescent Medicine, 154, 11-15. Riggs, J. E., & Hobbs, G. R. (2011). Infant homicide and accidental death in the United States, 1940-2005: Ethics and epidemiological classification. Journal of Medical Ethics, 37, 445-448. doi:10.1136/jme.2010.041053 Tung, G. A., Kumar, M., Richardson, R. C., Jenny, C., & Brown, W. D. (2006). Comparison of accidental and nonaccidental head injury in children on noncontrast computed tomography. Pediatrics, 118, 626- 633. doi:10.1542/peds.2006-0130 Vanamo, T., Kauppi, A., Karkola, K., Merikanto, J., & Rasanen, E. (2001). Intra-familial child homicide in Finland 1970-1994: Incidence, causes of death and demographic characteristics. Forensic Science Interna- tional, 117, 199-204. doi:10.1016/S0379-0738(00)00408-4 |