

Paper Menu >>
Journal Menu >>
 Open Journal of Forestry 2012. Vol.2, No.2, 59-64 Published Online April 2012 in SciRes (http://www.SciRP.org/journal/ojf) http://dx.doi.org/10.4236/ojf.2012.22008 Copyright © 2012 SciRes. 59 Rapid Increase in Log Populations in Drought-Stressed Mixed-Conifer and Ponderosa Pine Forests in Northern Arizona Joseph L. Ganey, Scott C. Vojta US Forest Service, Rocky Mountain Research Station, Flagstaff, USA Email: [email protected] Received December 15th, 2011; revised February 23rd, 2012; accepted February 29th, 2012 Down logs provide important ecosystem services in forests and affect surface fuel loads and fire behavior. Amounts and kinds of logs are influenced by factors such as forest type, disturbance regime, forest man- agement, and climate. To quantify potential short-term changes in log populations during a recent global- climate-change type drought, we sampled logs in mixed-conifer and ponderosa pine (Pinus ponderosa) forests in northern Arizona in 2004 and 2009 (n = 53 and 60 1-ha plots in mixed-conifer and ponderosa pine forests, respectively). Over this short time interval, density of logs, log volume, area covered by logs, and total length of logs increased significantly in both forest types. Increases in all log parameters were greater in mixed-conifer than in ponderosa pine forest, and spatial variability was pronounced in both forest types. These results document rapid increases in log populations in mixed-conifer forest, with smaller changes observed in ponderosa pine forest. These increases were driven by climate-mediated tree mortality which created a pulse in log input, rather than by active forest management. The observed in- creases will affect wildlife habitat, surface fuel loads, and other ecosystem processes. These changes are likely to continue if climate change results in increased warmth and aridity as predicted, and may require shifts in management emphasis. Keywords: Climate Change; Fuels; Logs; Mixed-Conifer Forest; Ponderosa Pine Forest; Spatial Variability Introduction Coarse woody debris (CWD), defined as the large-size com- ponent of downed woody material (Harmon et al., 1986), pro- vides important ecosystem services in forest systems (McComb & Lindenmayer, 1999; Butler et al., 2002; Woldendorp & Keenan, 2005), and amounts and types of CWD can affect sur- face fuel loads and fire behavior in these systems (Brown et al., 2003; Brewer, 2008). Much of the volume of CWD in south- western mixed-conifer and ponderosa pine forests consists of logs (defined here as down woody material >20 cm in large-end diameter and ≥2 m in length). For example, logs provided 93% and 85% of total CWD sampled by Ganey and Vojta (2010) in mixed-conifer and ponderosa pine forest, respectively. Logs perform various ecological roles, but are particularly important in providing foraging sites and shelter for many species of wildlife (Bull et al., 1997). Primarily because of their impor- tance to native wildlife, specific guidelines for retention of logs were developed for a number of forest types in the Southwest- ern Region of the US Forest Service (USFS [USDA Forest Service, 1996: pp. 92-93]). Information on abundance of logs in these forest types, as wells as trends in log populations, typi- cally is sparse, however. To quantify potential changes occurring in log populations in two important forest types in northern Arizona, we sampled logs in mixed-conifer and ponderosa pine (Pinus ponderosa) forest in 2004 and 2009. Our specific objectives were to: 1) Estimate trends in various parameters used to describe log populations, including log density, log volume, area covered by logs, and total log length; and 2) evaluate trends in decay-class, size-class, and species composition of log populations. These data document trends in log populations in mixed-conifer and ponderosa pine forest during a period of rapid forest change mediated by climate (Breshears et al., 2005; Allen et al., 2010; Ganey & Vojta, 2011). Results thus may provide a glimpse of trends in log populations likely under future climate in the southwestern United States, which is predicted to be both warmer and drier (Seager et al., 2007; Seager & Vecchi, 2010), and may aid managers in planning for and mitigating the effects of climate change. Study Area The study area encompassed approximately 73,000 ha in two National Forests in north-central Arizona (Figure 1). Within this area, study plots were randomly located in mixed-conifer (n = 53 plots) and ponderosa pine (n = 60 plots) forest. Mixed- conifer forest was dominated by Douglas-fir (Pseudotsuga menziesii), white fir (Abies concolor), and ponderosa pine. Other common species included limber pine (P. flexilis), Gam- bel oak (Quercus gambelii), and quaking aspen (Populus tremuloides). Ponderosa pine forest was dominated by ponder- osa pine, which comprised >90% of trees across all plots. Other relatively common species included Gambel oak and alligator juniper (Juniperus deppeana), with Douglas-fir, quaking aspen, limber pine, pinyon pine (P. edulis), and Utah (J. osteosperma) 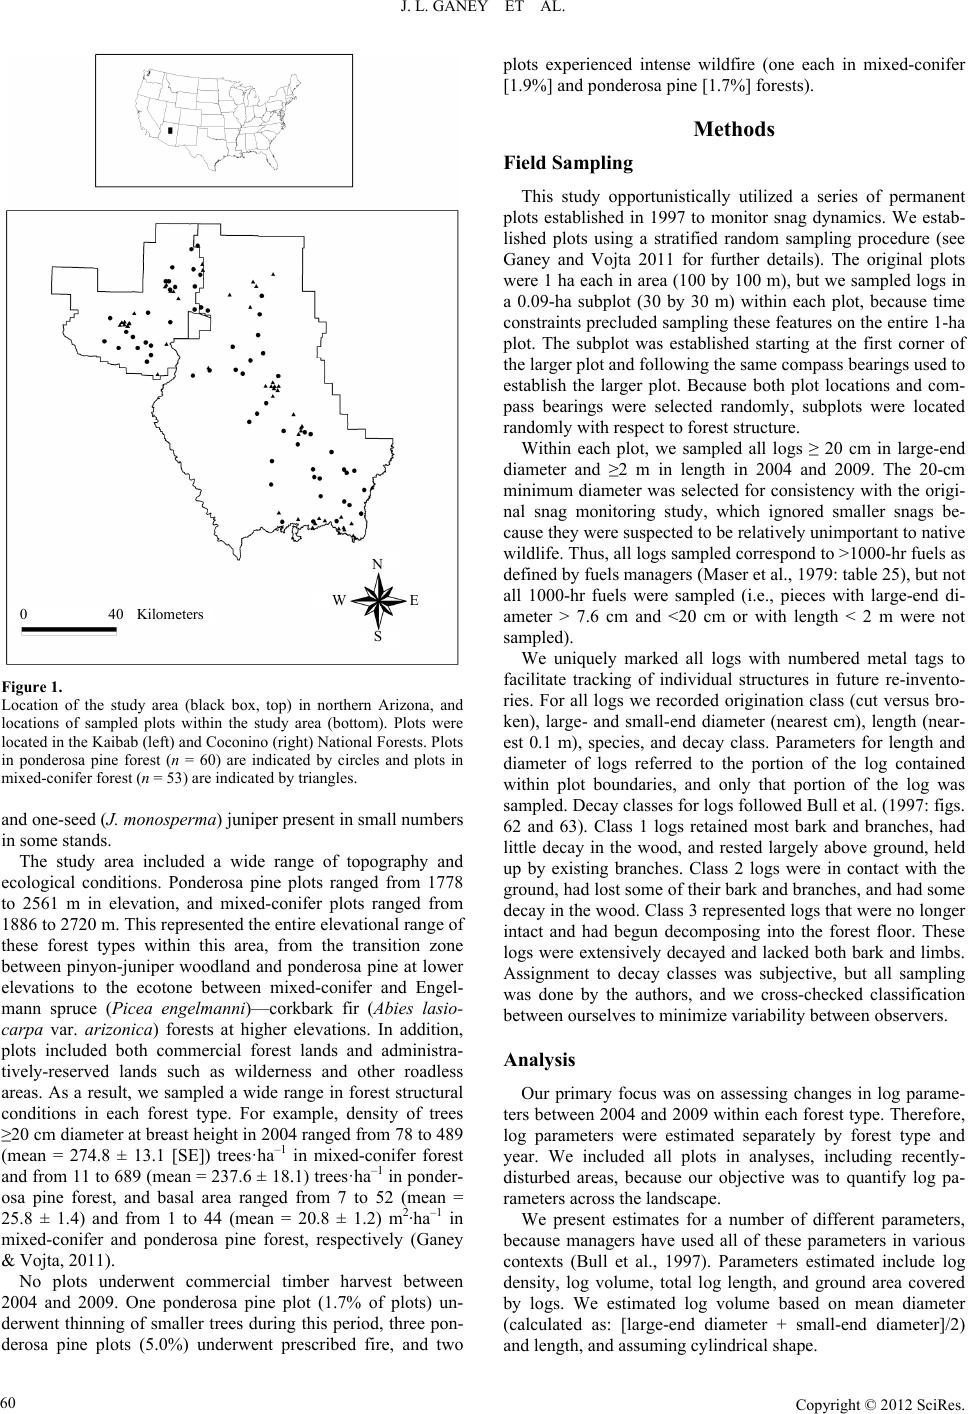 J. L. GANEY ET AL. 0 40 Kilometers N S W E Figure 1. Location of the study area (black box, top) in northern Arizona, and locations of sampled plots within the study area (bottom). Plots were located in the Kaibab (left) and Coconino (right) National Forests. Plots in ponderosa pine forest (n = 60) are indicated by circles and plots in mixed-conifer forest (n = 53) are indicated by triangles. and one-seed (J. monosperma) juniper present in small numbers in some stands. The study area included a wide range of topography and ecological conditions. Ponderosa pine plots ranged from 1778 to 2561 m in elevation, and mixed-conifer plots ranged from 1886 to 2720 m. This represented the entire elevational range of these forest types within this area, from the transition zone between pinyon-juniper woodland and ponderosa pine at lower elevations to the ecotone between mixed-conifer and Engel- mann spruce (Picea engelmanni)—corkbark fir (Abies lasio- carpa var. arizonica) forests at higher elevations. In addition, plots included both commercial forest lands and administra- tively-reserved lands such as wilderness and other roadless areas. As a result, we sampled a wide range in forest structural conditions in each forest type. For example, density of trees ≥20 cm diameter at breast height in 2004 ranged from 78 to 489 (mean = 274.8 ± 13.1 [SE]) trees·ha–1 in mixed-conifer forest and from 11 to 689 (mean = 237.6 ± 18.1) trees·ha–1 in ponder- osa pine forest, and basal area ranged from 7 to 52 (mean = 25.8 ± 1.4) and from 1 to 44 (mean = 20.8 ± 1.2) m2·ha–1 in mixed-conifer and ponderosa pine forest, respectively (Ganey & Vojta, 2011). No plots underwent commercial timber harvest between 2004 and 2009. One ponderosa pine plot (1.7% of plots) un- derwent thinning of smaller trees during this period, three pon- derosa pine plots (5.0%) underwent prescribed fire, and two plots experienced intense wildfire (one each in mixed-conifer [1.9%] and ponderosa pine [1.7%] forests). Methods Field Sampling This study opportunistically utilized a series of permanent plots established in 1997 to monitor snag dynamics. We estab- lished plots using a stratified random sampling procedure (see Ganey and Vojta 2011 for further details). The original plots were 1 ha each in area (100 by 100 m), but we sampled logs in a 0.09-ha subplot (30 by 30 m) within each plot, because time constraints precluded sampling these features on the entire 1-ha plot. The subplot was established starting at the first corner of the larger plot and following the same compass bearings used to establish the larger plot. Because both plot locations and com- pass bearings were selected randomly, subplots were located randomly with respect to forest structure. Within each plot, we sampled all logs ≥ 20 cm in large-end diameter and ≥2 m in length in 2004 and 2009. The 20-cm minimum diameter was selected for consistency with the origi- nal snag monitoring study, which ignored smaller snags be- cause they were suspected to be relatively unimportant to native wildlife. Thus, all logs sampled correspond to >1000-hr fuels as defined by fuels managers (Maser et al., 1979: table 25), but not all 1000-hr fuels were sampled (i.e., pieces with large-end di- ameter > 7.6 cm and <20 cm or with length < 2 m were not sampled). We uniquely marked all logs with numbered metal tags to facilitate tracking of individual structures in future re-invento- ries. For all logs we recorded origination class (cut versus bro- ken), large- and small-end diameter (nearest cm), length (near- est 0.1 m), species, and decay class. Parameters for length and diameter of logs referred to the portion of the log contained within plot boundaries, and only that portion of the log was sampled. Decay classes for logs followed Bull et al. (1997: figs. 62 and 63). Class 1 logs retained most bark and branches, had little decay in the wood, and rested largely above ground, held up by existing branches. Class 2 logs were in contact with the ground, had lost some of their bark and branches, and had some decay in the wood. Class 3 represented logs that were no longer intact and had begun decomposing into the forest floor. These logs were extensively decayed and lacked both bark and limbs. Assignment to decay classes was subjective, but all sampling was done by the authors, and we cross-checked classification between ourselves to minimize variability between observers. Analysis Our primary focus was on assessing changes in log parame- ters between 2004 and 2009 within each forest type. Therefore, log parameters were estimated separately by forest type and year. We included all plots in analyses, including recently- disturbed areas, because our objective was to quantify log pa- rameters across the landscape. We present estimates for a number of different parameters, because managers have used all of these parameters in various contexts (Bull et al., 1997). Parameters estimated include log density, log volume, total log length, and ground area covered by logs. We estimated log volume based on mean diameter (calculated as: [large-end diameter + small-end diameter]/2) and length, and assuming cylindrical shape. Copyright © 2012 SciRes. 60 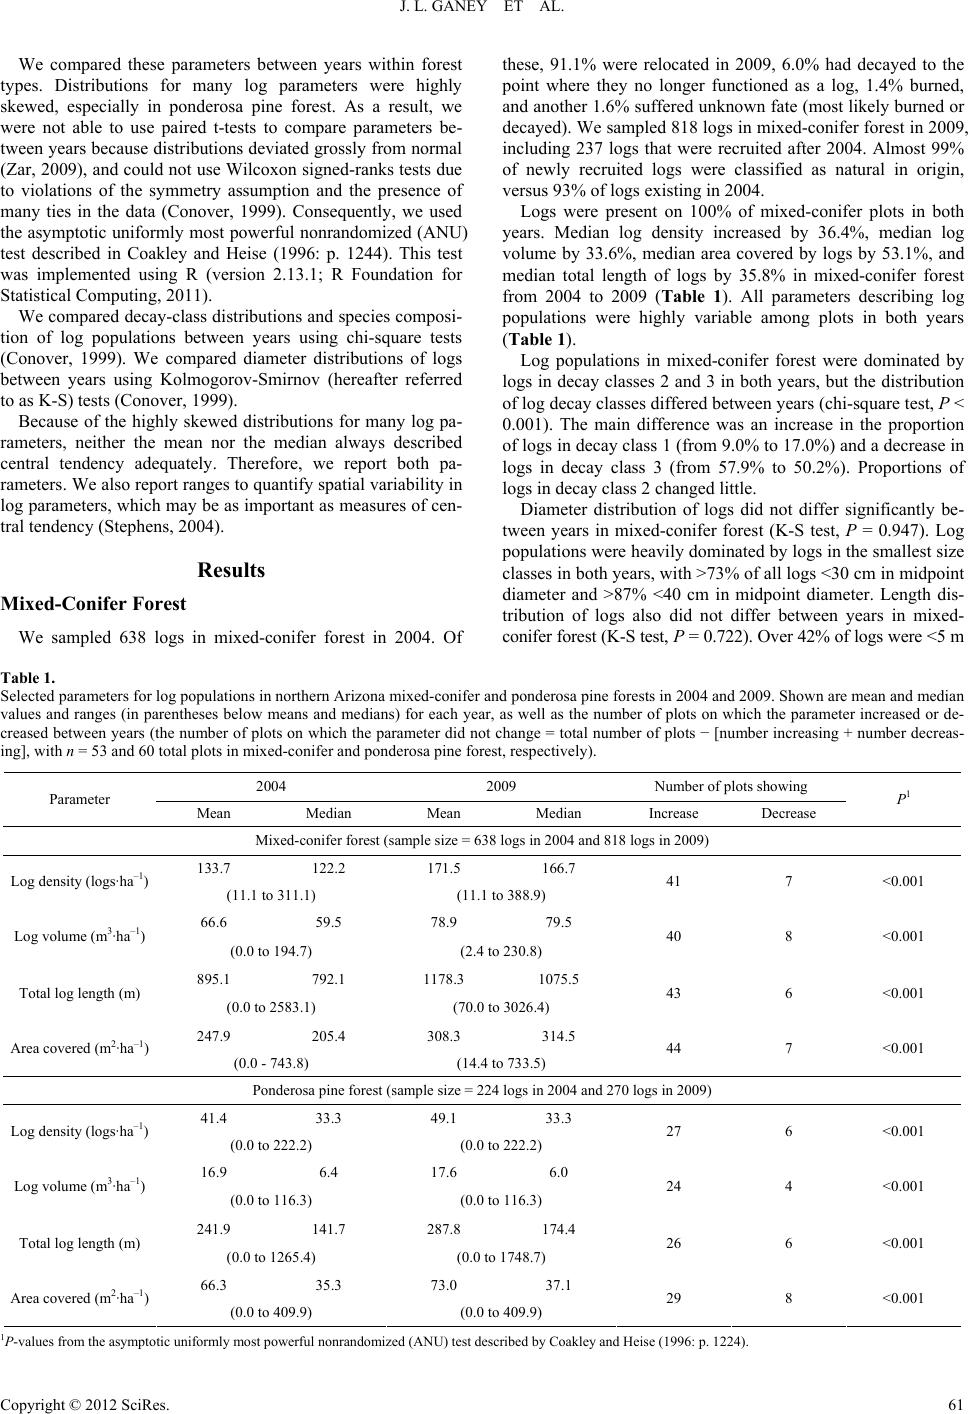 J. L. GANEY ET AL. Copyright © 2012 SciRes. 61 We compared these parameters between years within forest types. Distributions for many log parameters were highly skewed, especially in ponderosa pine forest. As a result, we were not able to use paired t-tests to compare parameters be- tween years because distributions deviated grossly from normal (Zar, 2009), and could not use Wilcoxon signed-ranks tests due to violations of the symmetry assumption and the presence of many ties in the data (Conover, 1999). Consequently, we used the asymptotic uniformly most powerful nonrandomized (ANU) test described in Coakley and Heise (1996: p. 1244). This test was implemented using R (version 2.13.1; R Foundation for Statistical Computing, 2011). We compared decay-class distributions and species composi- tion of log populations between years using chi-square tests (Conover, 1999). We compared diameter distributions of logs between years using Kolmogorov-Smirnov (hereafter referred to as K-S) tests (Conover, 1999). Because of the highly skewed distributions for many log pa- rameters, neither the mean nor the median always described central tendency adequately. Therefore, we report both pa- rameters. We also report ranges to quantify spatial variability in log parameters, which may be as important as measures of cen- tral tendency (Stephens, 2004). Results Mixed-Conifer Forest We sampled 638 logs in mixed-conifer forest in 2004. Of these, 91.1% were relocated in 2009, 6.0% had decayed to the point where they no longer functioned as a log, 1.4% burned, and another 1.6% suffered unknown fate (most likely burned or decayed). We sampled 818 logs in mixed-conifer forest in 2009, including 237 logs that were recruited after 2004. Almost 99% of newly recruited logs were classified as natural in origin, versus 93% of logs existing in 2004. Logs were present on 100% of mixed-conifer plots in both years. Median log density increased by 36.4%, median log volume by 33.6%, median area covered by logs by 53.1%, and median total length of logs by 35.8% in mixed-conifer forest from 2004 to 2009 (Table 1). All parameters describing log populations were highly variable among plots in both years (Table 1). Log populations in mixed-conifer forest were dominated by logs in decay classes 2 and 3 in both years, but the distribution of log decay classes differed between years (chi-square test, P < 0.001). The main difference was an increase in the proportion of logs in decay class 1 (from 9.0% to 17.0%) and a decrease in logs in decay class 3 (from 57.9% to 50.2%). Proportions of logs in decay class 2 changed little. Diameter distribution of logs did not differ significantly be- tween years in mixed-conifer forest (K-S test, P = 0.947). Log populations were heavily dominated by logs in the smallest size classes in both years, with >73% of all logs <30 cm in midpoint diameter and >87% <40 cm in midpoint diameter. Length dis- tribution of logs also did not differ between years in mixed- conifer forest (K-S test, P = 0.722). Over 42% of logs were <5 m Table 1. Selected parameters for log populations in northern Arizona mixed-conifer and ponderosa pine forests in 2004 and 2009. Shown are mean and median values and ranges (in parentheses below means and medians) for each year, as well as the number of plots on which the parameter increased or de- creased between years (the number of plots on which the parameter did not change = total number of plots − [number increasing + number decreas- ing], with n = 53 and 60 total plots in mixed-conifer and ponderosa pine forest, respectively). 2004 2009 Number of plots showing Parameter Mean Median Mean Median Increase Decrease P1 Mixed-conifer forest (sample size = 638 logs in 2004 and 818 logs in 2009) 133.7 122.2 171.5 166.7 Log density (logs·ha–1) (11.1 to 311.1) (11.1 to 388.9) 41 7 <0.001 66.6 59.5 78.9 79.5 Log volume (m3·ha–1) (0.0 to 194.7) (2.4 to 230.8) 40 8 <0.001 895.1 792.1 1178.3 1075.5 Total log length (m) (0.0 to 2583.1) (70.0 to 3026.4) 43 6 <0.001 247.9 205.4 308.3 314.5 Area covered (m2·ha–1) (0.0 - 743.8) (14.4 to 733.5) 44 7 <0.001 Ponderosa pine forest (sample size = 224 logs in 2004 and 270 logs in 2009) 41.4 33.3 49.1 33.3 Log density (logs·ha–1) (0.0 to 222.2) (0.0 to 222.2) 27 6 <0.001 16.9 6.4 17.6 6.0 Log volume (m3·ha–1) (0.0 to 116.3) (0.0 to 116.3) 24 4 <0.001 241.9 141.7 287.8 174.4 Total log length (m) (0.0 to 1265.4) (0.0 to 1748.7) 26 6 <0.001 66.3 35.3 73.0 37.1 Area covered (m2·ha–1) (0.0 to 409.9) (0.0 to 409.9) 29 8 <0.001 1 P-values from the asymptotic uniformly most powerful nonrandomized (ANU) test described by Coakley and Heise (1996: p. 1224).  J. L. GANEY ET AL. in length in both years, and over 75% were <10 m in length. Species composition of log populations did not vary across years in mixed-conifer forest (P > 0.10). In both years, several species were well represented, including white fir (17.6% of logs in 2004 and 23.1% in 2009), ponderosa pine (34.7% in 2004, 31.7% in 2009), Douglas-fir (23.5% in 2004, 21.4% in 2009), and Gambel oak (11.7% in 2004, 11.8% in 2009). Ponderosa Pine Forest We sampled 224 logs in ponderosa pine forest in 2004. Of these, 93.3% were relocated in 2009, 1.3% had decayed to the point where they no longer functioned as a log, and 5.4% burned. We sampled 270 logs in 2009, including 61 logs recruited after 2004. Over 98% of newly recruited logs were classified as natural in origin, versus 80% of logs existing in 2004. Logs were present on 81.7% of ponderosa pine plots in 2004 and 90% in 2009. Median estimates varied little between years for log density and volume, whereas mean log density increased by 18.6% and mean log volume by 4.1% (Table 1). Median total log length increased by 23.1%, and median area covered by logs increased by 5.9% between years in ponderosa pine forest. As in mixed-conifer forest, spatial variability was pro- nounced in all of these parameters (Table 1). Distribution of log decay classes did not differ significantly across years in ponderosa pine forest. Log populations in this forest type were dominated by logs in decay class 3, which comprised >58% of logs in both years. Diameter distribution of log populations did not differ sig- nificantly between years in ponderosa pine forest (K-S test; P = 0.099). Log populations were heavily dominated by logs in the smallest size classes in both years, with >77% of all logs < 30 cm in mean diameter, and 88% <40 cm in mean diameter. Length distribution of logs also did not differ between years in ponderosa pine forest (K-S test, P = 1.000). Over 50% of logs were <5 m in length in both years, and over 85% were <10 m in length. Species composition of log populations also did not differ between 2004 and 2009 in ponderosa pine forest (P > 0.25). In both years, log populations were heavily dominated by ponder- osa pine, which comprised >91% of all logs in both years. Discussion Our results document rapid increases in log numbers and re- lated parameters in mixed-conifer forest. Changes were less pronounced in ponderosa pine forest, but most log parameters still increased significantly over a five-year period in this forest type. In both forest types, most newly-recruited logs were clas- sified as natural in origin rather than cut. Thus, most newly- recruited logs represented structures left when live or dead trees broke and fell. In addition, no logs were lost to fuelwood har- vest in ponderosa pine forest, and only 1.6% of existing logs were unaccounted for and possibly harvested in mixed-conifer forest. Thus, most of the observed change in both forest types was attributable to the balance between creation of logs through natural tree mortality and loss of logs to decay or fire, rather than to active forest management or fuelwood harvest. In both forest types, log populations changed little in terms of diameter or length distribution and species composition, and decay-class distribution did not change between years in pon- derosa pine forest. In contrast, decay-class distribution shifted somewhat in mixed-conifer forest, with greater proportions of logs in decay class 1 and lower proportions in decay class 3. This is consistent with a pulse of new logs into the system, many of which (46.8%) were in decay class 1 when sampled in 2009, as well as with greater decay of logs in decay class 3; 100% of logs lost to decay between 2004 and 2009 in mixed- conifer forest were in decay class 3 in 2004. Changes in decay status can affect fire behavior, with flammability and probabil- ity of ignition generally increasing as logs progress from sound to rotten (Brown et al., 2003). Thus, this large pulse of new logs has implications for fire behavior not only in terms of fuel loads (see below), but also with respect to fuel type. The greater increase in log parameters in mixed-conifer for- est is consistent with patterns of climate-mediated tree mortality documented in this area. Observed mortality from 1997 to 2007 was far greater in mixed-conifer than in ponderosa pine forest (Ganey & Vojta, 2011), and is creating a large pulse in log creation in mixed-conifer forest. Stephens and Ruth (2005) also noted that fuels accumulate more rapidly in productive mixed- conifer forests than in ponderosa pine forests, even though those pine forests typically have missed more fire cycles. This general process has been exacerbated by recent climatic condi- tions, with the result that logs are accumulating rapidly in mixed-conifer forest (i.e., changes ranging from approximately 30 to >50% in various parameters over a 5-yr period; Table 1). The implications of observed changes in log populations are not entirely clear at this time. Several studies have documented positive associations between down wood and various species of small mammals in southwestern mixed-conifer (Ward 2001) and ponderosa pine forests (Goodwin & Hungerford, 1979; Block et al., 2005, 2011; Converse et al., 2006). Thus, the ob- served increase in down wood may result in improved habitat quality for some small mammals, at least in the short term. The changes documented here represent only the initial changes resulting from a drought-mediated pulse in tree mortal- ity (Ganey & Vojta, 2011), however, because many of the dead trees are still standing. As these trees fall, we anticipate greater increases in log abundance and related parameters in both forest types (Ganey & Vojta, 2010; Hoffman et al., 2011; Stevens- Rumann et al., 2012). At some point, this may result in reduced habitat quality for small mammals. For example, Manning and Edge (2004) documented curvilinear associations between sur- vival and amount of down wood for two species of small mammals in Oregon, with survival reaching a maximum at intermediate levels of down wood and declining with further increases of down wood. They speculated that this reflected tradeoffs between amount of down wood and food supply. At low levels of down wood cover, increases in woody cover re- sulted in improved nesting habitat and hiding cover, but herba- ceous food resources likely declined as woody cover increased beyond an optimal level. Ward (2001) also reported possible nonlinear associations between Mexican woodrats (Neotoma mexicana) and down wood in a New Mexico mixed-conifer forest, but it was unclear if a similar mechanism was involved. The observed increases in log populations also reflect changes in surface fuel loads that affect fire behavior. Brown et al. (2003) provided recommendations for optimal ranges of CWD in warm dry coniferous forests, based on factors such as resistance of fires to control, fire duration, soil heating, wildlife values, and historical ranges. Recent studies by Hoffman et al. (2011) and Stevens-Rumann et al. (2012) documented increases Copyright © 2012 SciRes. 62  J. L. GANEY ET AL. in surface fuel loads in ponderosa pine forests following dis- turbance by bark beetles and wildfire, respectively. Loadings of 1000-hr fuels exceeded recommended ranges for dry coniferous forests in 20% of plots sampled by Hoffman et al. (2011) five years after a bark beetle outbreak, and they expected other plots to exceed those ranges as remaining snags fall. Similarly, areas suffering high mortality from wildfire exceeded recommended levels for CWD by up to 28% by 10 yrs postfire (Stevens-Ru- mann et al., 2012). In contrast, Passovoy and Fulé (2006) did not observe levels of CWD exceeding recommended levels in a 27-yr chronosequence of postfire ponderosa pine forests. Fuel loads in our sample plots also will continue to increase in the short term as dead trees fall (Ganey & Vojta, 2010; Hoffman et al., 2011; Stevens-Rumann et al., 2012). Increasing loads of surface fuels may pose challenges for fuels managers in this region, particularly because tree densities in many pon- derosa pine and mixed-conifer stands fall significantly outside of the natural range of variability for these forest types (Cov- ington & Moore, 1994; Fulé et al., 2009). These high tree den- sities can interact with surface fuel loads to create high fire hazard even when fuel loads are within normal ranges (Brewer, 2008). Drought-mediated tree mortality is simultaneously reducing the tree densities and canopy fuels that interact with surface fuel loads, however (Passovoy & Fulé, 2006; Hoffman et al., 2011; Stevens-Rumann et al., 2012). Ultimately, fire risk in these stands will represent the interplay between these factors (surface fuel loads and canopy fuels), as well as other aspects of forest structure such as fuel ladders that permit fire to reach the forest canopy. The high spatial variability observed in both surface fuels (this study) and tree mortality (Ganey & Vojta, 2011) suggests that the outcome of this interplay also will ex- hibit high spatial variability across the landscape. Conclusion Climate change has been implicated in recent large-scale tree mortality events throughout the world (Allen et al., 2010), and studies in the southwestern US have documented increases in CWD levels due to climate-related disturbances such as bark beetle outbreaks and wildfire (Hoffman et al., 2011; Stevens- Rumann et al., 2012). This study extends those findings by documenting rapid climate-driven increases in log populations across the general landscape, including areas not subject to bark beetle outbreaks and wildfire. These findings suggest that managers should plan for increased fuel loads where climate models predict increasing warmth and aridity. Acknowledgements We thank J. Jenness, G. Martinez, M. Stoddard, B. Stroh- meyer, R. White, and especially A. and J. Iníguez for their as- sistance in establishing plots, and D. and N. Ganey for assis- tance with sampling plots. For assistance with initial plot selec- tion, we thank J. Ellenwood, B. Higgins, K. Menasco, C. Nel- son, G. Sheppard (Kaibab National Forest), and C. Beyerhelm, A. Brown, H. Green, T. Randall-Parker, C. Taylor, and M. Whitney (Coconino National Forest). L. S. Baggett provided general advice on statistical analyses, and L. S. Baggett and A. Casas conducted the ANU tests described in the text. Com- ments by J. Iníguez, C. H. Sieg, and an anonymous reviewer improved earlier versions of this paper. REFERENCES Allen, C. D., Macalady, A. K., Chenchouni, H., Bachelet, D., McDow- ell, N., Vennetier, M., Kitzberger, T., Rigling, A., Breshears, D. D., Hogg, E. H., Gonzalez, P., Fensham, R., Zhang, Z., Castro, J., Demi- dova, N., Lim, J.-H., Allard, G., Running, S. W., Semerci, A., & Cobb, N. (2010). A global overview of drought and heat-induced tree mortality reveals emerging climate change risks for forests. Forest Ecology and Management, 259, 660-684. doi:10.1016/j.foreco.2009.09.001 Block, W. M., Ganey, J. L., Scott, P. E., & King, R. M. (2005). Prey ecology of the Mexican spotted owl in ponderosa pine-Gambel oak forests of northern Arizona. Journal of Wildlife Management, 69, 618-629. doi:10.2193/0022-541X(2005)069[0618:PEOMSO]2.0.CO;2 Block, W. M., Russell, R. E., & Ganey, J. L. (2011). Occupancy and habitat associations of four species of sciurids in northern Arizona ponderosa pine—Gambel oak forest. Southwestern Naturalist, 56, 193-203. doi:10.1894/F08-JKF-13.1 Breshears, D. D., Cobb, N. S., Rich, P. M., Price, K. P., Allen, C. D., Balice, R. G., Rommé, W. H., Kastens, J. H., Floyd, M. L., Belknap, J., Anderson, J. J., Myers, O. B., & Meyer, C. W. (2005). Regional vegetation die-off in response to global-change-type drought. Pro- ceedings of the National Academy of Sciences USA, 102, 15144- 15148. doi:10.1073/pnas.0505734102 Brewer, D. (2008). Managing coarse woody debris in fire-adapted southwestern forests. Working Papers in Southwestern Ponderosa Pine Forest Restoration, no. 21. Flagstaff, AZ: Northern Arizona University. Brown, J. K., Reinhardt, E. D., & Kramer, K. A. (2003). Coarse woody debris: Managing benefits and fire hazard in the recovering forest. USDA Forest Service General Technical Report RMRS-GTR-105. Bull, E. L., Parks, C. G., & Torgersen, T. R. (1997). Trees and logs important to wildlife in the interior Columbia River Basin. USDA Forest Service General Technical Report PNW-GTR-391. Butler, J., Alexander, K., & Green, T. (2002). Decaying wood: An overview of its status and ecology in the United Kingdom and Conti- nental Europe. In: USDA Forest Service General Technical Report PSW-GTR-181. Albany, CA: Pacific Southwest Research Station. Coakley, C. W., & Heise, M. A. (1996). Versions of the sign test in the presence of ties. Biometrics, 52, 1242-1251. doi:10.2307/2532840 Conover, W. J. (1999). Practical nonparametric statistics (3rd ed.). New York, NY: John Wiley & Sons. Converse, S. J., White, G. C., & Block, W. M. (2006). Small mammal responses to thinning and wildfire in ponderosa pine-dominated for- ests of the southwestern United States. Journal of Wildlife Manage- ment, 70, 1711-1722. doi:10.2193/0022-541X(2006)70[1711:SMRTTA]2.0.CO;2 Covington, W. W., & Moore, M. M. (1994). Postsettlement changes in natural fire regimes and forest structure: Ecological restoration of old growth ponderosa pine forests. Journal of Sustainable Forestry, 2, 153-181. doi:10.1300/J091v02n01_07 Fulé, P. Z., Korb, J. E., & Wu, R. (2009). Changes in forest structure of a mixed-conifer forest, southwestern Colorado, USA. Forest Ecology and Management, 258, 1200-1210. doi:10.1016/j.foreco.2009.06.015 Ganey, J. L., & Vojta, S. C. (2010). Coarse woody debris assay in northern Arizona mixed-conifer and ponderosa pine forests. USDA Forest Service Research Paper RMRS-RP-80WWW. Ganey, J. L., & Vojta, S. C. (2011). Tree mortality in drought-stressed mixed-conifer and ponderosa pine forests, Arizona. Forest Ecology and Management, 261, 162-168. doi:10.1016/j.foreco.2010.09.048 Goodwin, J. G. Jr., & Hungerford, C. R. (1979). Rodent population densities and food habits in Arizona ponderosa pine forests. USDA Forest Service Research Paper RM-214. Harmon, M. E., Franklin, J. F., Swanson, F. J., Sollins, P., Gregory, S. V., Lattin, J. D., Anderson, N. H., Cline, S. P., Aumen, N. G., Sedell, J. R., Lienkamper, G. W., Cromack, K. Jr., & Cummins, K. W. (1986). Ecology of coarse woody debris in temperate ecosystems. Advances in Ecological Research, 15, 133-302. doi:10.1016/S0065-2504(08)60121-X Copyright © 2012 SciRes. 63  J. L. GANEY ET AL. Copyright © 2012 SciRes. 64 Hoffman, C. M., Sieg, C. H., McMillin, J. D., & Fulé, P. Z. (2011). Fuel loadings five years after a bark beetle outbreak in southwestern USA ponderosa pine forests. International Journal of Wildland Fire. doi:10.1071/WF11019 Manning, J. A., & Edge, W. D. (2004). Small mammal survival and downed wood at multiple scales in managed forests. Journal of Mammalogy, 85, 87-96. doi:10.1644/1545-1542(2004)085<0087:SMSADW>2.0.CO;2 Maser, C., Anderson, R. G., Cromack, K. Jr., Williams, J. T., & Martin, R. E. (1979). Dead and down woody material. In J. W. Thomas (Ed.), Wildlife habitats in managed forests: The blue mountains of Oregon and Washington (pp. 78-95). Portland: USDA. McComb, W., & Lindenmayer, D. (1999). Dying, dead, and down trees. In Maintaining biodiversity in forest ecosystems (pp. 335-372). Cam- bridge: Cambridge University Press. Passovoy, M. D., & Fulé, P. Z. (2006). Snag and woody debris dynam- ics following severe wildfires in northern Arizona ponderosa pine forests. Forest Ecology and Manag ement, 223, 237-246. doi:10.1016/j.foreco.2005.11.016 Seager, R., Ting, M. F., Held, I. M., Kushmir, Y., Lu, J., Vecchi, G., Huang, H., Harnick, N., Leetmaa, A., Lau, N., Li, C., Velez, J., & Naik, N. (2007). Model projections of an imminent transition to a more arid climate in southwestern United States. Science, 316, 1181- 1184. doi:10.1126/science.1139601 Seager, R., & Vecchi, G. A. (2010). Greenhouse warming and the 21st century hydroclimate of southwestern North America. Proceedings of the National Academy of Sciences USA, 107, 21277-21282. doi:10.1073/pnas.0910856107 Stephens, S. L. (2004). Fuel loads, snag abundance, and snag recruit- ment in an unmanaged Jeffrey pine-mixed-conifer forest in north- western Mexico. Forest Ecology and Management, 199, 103-113. doi:10.1016/j.foreco.2004.04.017 Stephens, S. L., & Ruth, L. W. (2005). Federal forest-fire policy in the United States. Ecological Applications, 15, 532-542. doi:10.1890/04-0545 Stevens-Rumann, C. S., Sieg, C. H., & Hunter, M. E. (2012). Ten years after wildfires: How does varying tree mortality impact fire hazard and forest resiliency? Forest Ecology and Management, 267, 199- 208. doi:10.1016/j.foreco.2011.12.003 USDA Forest Service (1996). Record of decision for amendment of forest plans: Arizona and New Mexico. MB-R3-16-6. Albuquerque, NM: USDA Forest Service. Ward, J. P. Jr. (2001). Ecological responses by Mexican spotted owls to environmental variation in the Sacramento Mountains, New Mexico. Ph.D. Thesis, Fort Collins: Colorado State University. Woldendorp, G., & Keenan, R. J. (2005). Coarse woody debris in Aus- tralian forest ecosystems: A review. Austral Ecology, 30, 834-843. doi:10.1111/j.1442-9993.2005.01526.x Zar, J. H. (2009). Biostatistical analysis (5th ed.). Upper Saddle River, New Jersey: Prentice Hall. |