

Paper Menu >>
Journal Menu >>
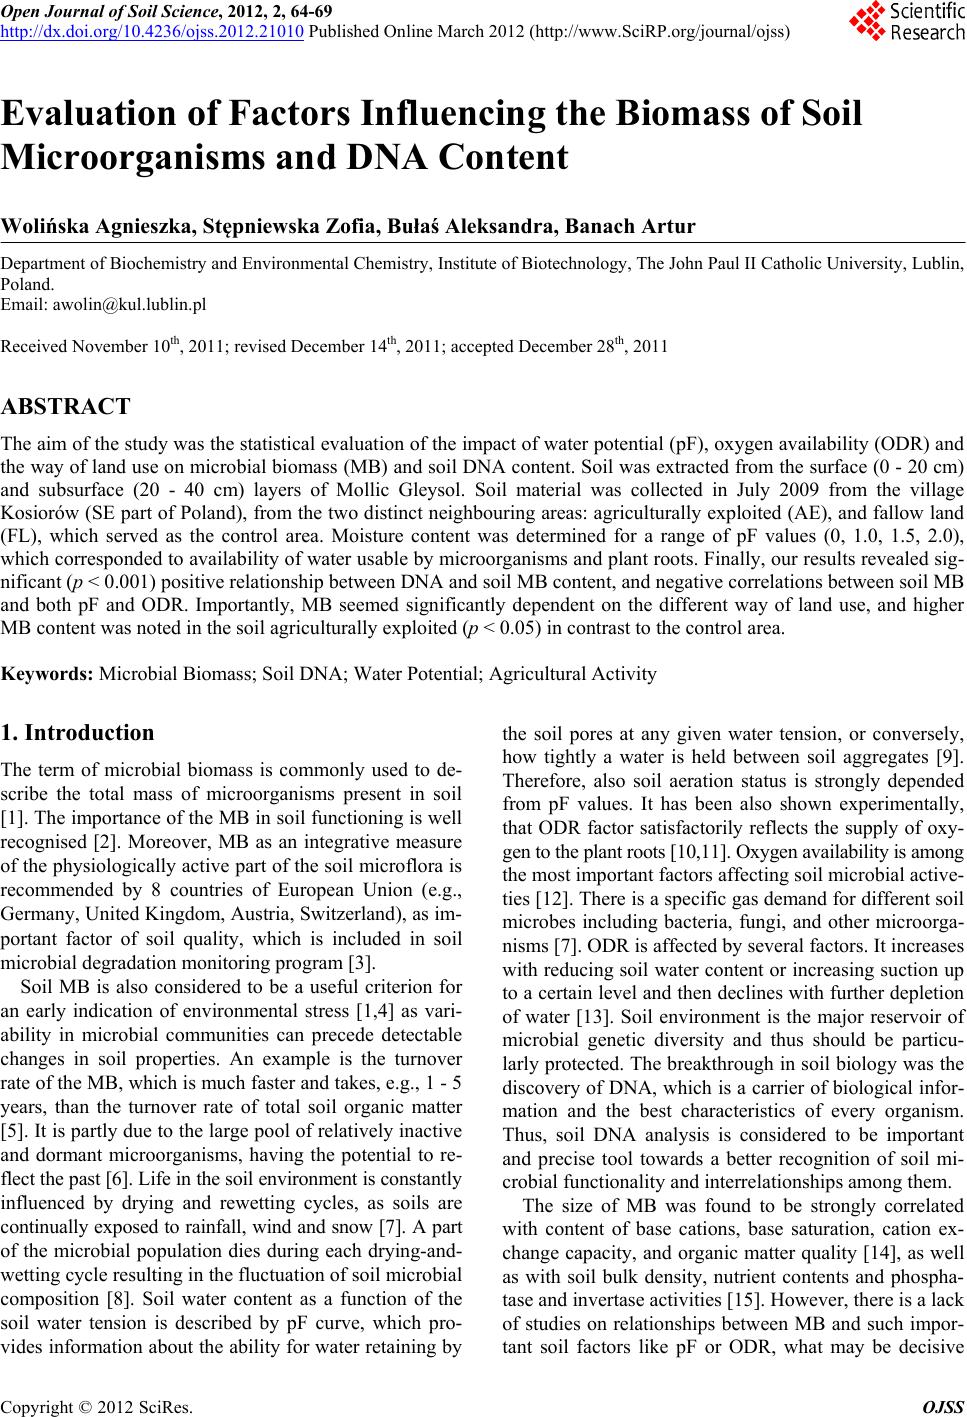 Open Journal of Soil Science, 2012, 2, 64-69 http://dx.doi.org/10.4236/ojss.2012.21010 Published Online March 2012 (http://www.SciRP.org/journal/ojss) Evaluation of Factors Influencing the Biomass of Soil Microorganisms and DNA Content Wolińska Agnieszka, Stępniewska Zofia, Bułaś Aleksandra, Banach Artur Department of Biochemistry and Environmental Chemistry, Institute of Biotechnology, The John Paul II Catholic University, Lublin, Poland. Email: [email protected] Received November 10th, 2011; revised December 14th, 2011; accepted December 28th, 2011 ABSTRACT The aim of the study was the statistical evaluation of the impact of water potential (pF), oxygen availability (ODR) and the way of land use on microbial biomass (MB) and soil DNA content. Soil was extracted from the surface (0 - 20 cm) and subsurface (20 - 40 cm) layers of Mollic Gleysol. Soil material was collected in July 2009 from the village Kosiorów (SE part of Poland), from the two distinct neighbouring areas: agriculturally exploited (AE), and fallow land (FL), which served as the control area. Moisture content was determined for a range of pF values (0, 1.0, 1.5, 2.0), which corresponded to availability of water usable by microorganisms and plant roots. Finally, our results revealed sig- nificant (p < 0.001) positive relationship between DNA and soil MB content, and negative correlations between soil MB and both pF and ODR. Importantly, MB seemed significantly dependent on the different way of land use, and higher MB content was noted in the soil agriculturally exploited (p < 0.05) in contrast to the control area. Keywords: Microbial Biomass; Soil DNA; Water Potential; Agricultural Activity 1. Introduction The term of microbial biomass is commonly used to de- scribe the total mass of microorganisms present in soil [1]. The importance of the MB in soil functioning is well recognised [2]. Moreover, MB as an integrative measure of the physiologically active part of the soil microflora is recommended by 8 countries of European Union (e.g., Germany, United Kingdom, Austria, Switzerland), as im- portant factor of soil quality, which is included in soil microbial degradation monitoring program [3]. Soil MB is also considered to be a useful criterion for an early indication of environmental stress [1,4] as vari- ability in microbial communities can precede detectable changes in soil properties. An example is the turnover rate of the MB, which is much faster and takes, e.g., 1 - 5 years, than the turnover rate of total soil organic matter [5]. It is partly due to the large pool of relatively inactive and dormant microorganisms, having the potential to re- flect the past [6]. Life in the soil environment is constantly influenced by drying and rewetting cycles, as soils are continually exposed to rainfall, wind and snow [7]. A part of the microbial population dies during each drying-and- wetting cycle resulting in the fluctuation of soil microbial composition [8]. Soil water content as a function of the soil water tension is described by pF curve, which pro- vides information about the ability for water retaining by the soil pores at any given water tension, or conversely, how tightly a water is held between soil aggregates [9]. Therefore, also soil aeration status is strongly depended from pF values. It has been also shown experimentally, that ODR factor satisfactorily reflects the supply of oxy- gen to the plant roots [10,11]. Oxygen availability is among the most important factors affecting soil microbial active- ties [12]. There is a specific gas demand for different soil microbes including bacteria, fungi, and other microorga- nisms [7]. ODR is affected by several factors. It increases with reducing soil water content or increasing suction up to a certain level and then declines with further depletion of water [13]. Soil environment is the major reservoir of microbial genetic diversity and thus should be particu- larly protected. The breakthrough in soil biology was the discovery of DNA, which is a carrier of biological infor- mation and the best characteristics of every organism. Thus, soil DNA analysis is considered to be important and precise tool towards a better recognition of soil mi- crobial functionality and interrelationships among them. The size of MB was found to be strongly correlated with content of base cations, base saturation, cation ex- change capacity, and organic matter quality [14], as well as with soil bulk density, nutrient contents and phospha- tase and invertase activities [15]. However, there is a lack of studies on relationships between MB and such impor- tant soil factors like pF or ODR, what may be decisive Copyright © 2012 SciRes. OJSS  Evaluation of Factors Influencing the Biomass of Soil Microorganisms and DNA Content 65 for the course of processes responsible for plant devel- opment, and soil fertility. Investigation of the effect of human agricultural activity on MB content is also inter- esting part of the current study. Thus, the aim of the work was the statistical description of the impact of pF, ODR, and human agricultural activities on MB and DNA con- tent in soil. 2. Material and Method 2.1. Soil and Investigated Area Description The soil used in the experiment was Mollic Gleysol (Ta- ble 1). Soil was sampled in July 2009 from the village Kosiorów, situated in the Wilków community (SE part of Poland) from depths of 0 - 20 and 20 - 40 cm. To make possible an estimation of the effect of different way of land use on MB, soil samples were collected from two neighbouring plots: one of them was agriculturally exploit- ed with systematic fertilization and pasturage (under hu- man activity), whilst the other one was classified as fal- low land and used as a control area (without any human impact). 2.2. Assaying of Soil Retention Curves The instrument used for determining water retention cur- ves was a steel pressure chamber, inside of which a po- rous plate saturated with water was located. At the bot- tom, soil samples, continuously exposed to atmospheric pressure, make the hydraulic contact with the porous plate [16]. The chamber was closed and the desired air pres- sure P was applied, driving away the soil water retained at pressures below P, until equilibrium was reached [16]. Soil samples were collected using plastic containers and placed in an airtight chamber (for 10 days), part of a la- boratory set LAB o12 (Soil Moisture Equipment Compa- ny, USA), before a pressure was applied. The moisture content was determined via the drying process, for the range of water potentials (0, 1.0, 1.5 and 2.0 pF), corre- sponding to availability of water usable by microorgan- isms and plant roots. 2.3. ODR Measurement After determination of proper pF values, ODR was mea- sured by ODR-meter manufactured by the Institute of Agrophysics, Polish Academy of Soil Sciences (Lublin), using Malicki and Bieganowski [17] method. The ODR technique consists of the measurement of the electric cur- rent intensity corresponding to the reduction of oxygen on a platinum cathode placed in the soil and negatively polarized with respect to the reference electrode (calomel). As oxygen is consumed at the microelectrode, more oxy- gen needs to diffuse radially to the electrode in response to the accumulated gradient. This is analogous to oxygen consumption by respiration of root surface or by micro- bial respiration. Four platinum wire electrodes (0.5 mm × 4 mm) were placed at the depth of 2 cm and polarized to –0.65 V versus saturated calomel electrode for 4 min. The data were recorded in three replicates, for each sample. 2.4. Microbial Biomass Soil MB was determined by a fumigation-extraction me- thod using CHCl3 as an agent responsible for the cellular death of microorganisms, according to Joregensen [18] procedure. Concentration of head-space CO2 released by microorganisms which survived incubation with CHCl3 was measured by a gas chromatograph (Varian CP-3800, equipped with a TCD detector). 2.5. DNA Extraction Soil DNA was extracted from samples at pF 0 (full water capacity conditions) and pF 2.0 (field capacity conditions), using the GeneMatrix soil DNA isolation kit (EURx 1.4, Poland), according to the manufacturer’s instructions. This kit was designed specifically for the rapid isolation of pure, humic-free microbial DNA from soil samples, and guaranteed the proper DNA isolation procedure. Con- centration of DNA was determined spectrophotometri- cally at 260 nm (Shimadzu, UV-1800, Japan). 2.6. Data Analyses Statistical analyses were performed by means of Statis- tica 8.0 software (STATSOFT, USA). One-way ANOVA test was used to investigate significant (p < 0.05) effect of pF, ODR, DNA content on soil MB quantity. Results of the significance differences analyses are presented in Table 2 only. In Figures 1-4 the average values with stan- dard deviations are demonstrated. Table 1. Basic characteristics of the soil. Granulometric composition (%, dia in mm) Place Depth (cm) 1 - 0.1 0.1 - 0.02 0.02 - 0.002 <0.002 pH (H2O) TOC (%) 0 - 20 87 8 3 2 6.7 22.5 Agriculturally exploited (AE) 20 - 40 90 7 2 1 6.4 1.4 0 - 20 91 6 3 0 6.2 20.1 Fallow land (FL) 20 - 40 95 3 2 0 6.5 1.3 Copyright © 2012 SciRes. OJSS  Evaluation of Factors Influencing the Biomass of Soil Microorganisms and DNA Content 66 Table 2. Statistically significant relationships between MB and analyzed parameters, N = 12. Object investigated Depth (cm) pF ODR c DNA 0 - 20 –0.68* –0.20 n.s. 0.97** AE 20 - 40 –0.53* –0.52 n.s. 0.99*** 0 - 20 –0.94*** –0.83*** 0.86* FL 20 - 40 –0.74** –0.59* 0.89* *, **, ***—indicate significance at the p < 0.05, p < 0.01, and p < 0.001, respectively; n.s.—not significant difference. Figure 1. The relationship between soil water content (% v/v) and pF values. The curves are related to two depths (0 - 20; 20 - 40 cm) of the investigated soil areas. Figure 2. Variability of ODR values as an effect of water potential at two depths of the investigated soil areas. Aver- age values with standard deviations are presented. microorganisms microorganisms Figure 3. Variability of MB levels as an effect of water po- tential at two depths of the investigated soil areas. Average values with standard deviations are presented. Figure 4. DNA content at two depths of the investigated soil areas as an effect of water potential. Average values with standard deviations are presented. 3. Results and Discuss 3.1. Soil Retention Abilities An incubation of the soil samples under different control- led moisture conditions altered significantly ODR, MB and DNA concentration. The relationships between soil water content (%, v/v) and pF for the two layers of Mol- lic Gleysol, for both tested areas (AE and FL) are pre- sented in Figure 1. Copyright © 2012 SciRes. OJSS  Evaluation of Factors Influencing the Biomass of Soil Microorganisms and DNA Content 67 Generally, the investigated soils demonstrated similar abilities to retain water, even though soil from the control area (FL) displayed slightly higher (c.a. 3% more than soil agriculturally exploited) capacity for water keeping. This might be connected with beginning of decay process on AE object, what resulted in looseness of soil structure and higher intensity of mineralization and humification of the soil organic compounds. Moreover, higher ability of holding water in the subsurface layers were noted, and equalled 34% - 47% v/v and 41% - 50% v/v in AE and FL objects, respectively. Similar capability of Mollic Gley- sol for water maintaining was also indicated [19]. The soil-water interactions are greatly or extremely important to soil fertility and therefore are the subject of interest to agricultural engineers and farmers. Furthermore, infor- mation about water holding capacity is important for agronomic and hydrologic characteristic of soils. It ex- presses, how much water can be stored in the soil for plant use during periods without rain or irrigation [20]. This provides an indication of soil sensitivity to drou- ght and could be used to calculate the probability of oc- currence of deep drainage or groundwater recharge proc- ess. It was also reported that macropore continuity is very important to the aeration status of the soil, thus the effect of soil compaction on other aeration properties de- pends on soil hydro-physical status [13,21]. 3.2. Oxygen Availability in AE and FL Objects Based on the performed measurements it was found, that pF constitutes a significant factor (p < 0.001) determin- ing ODR levels in the soil environment. Soil desiccation, occurring in the direction from pF 0 to pF 2.0, was the reason of stimulation of ODR (Figure 2). The oxygen availability in relation to the soil water potential indicates, that ODR values at surface layer of AL object fluctuated from 50 to 233 μg O2/(m2·s) at pF 0 and pF 2.0, respectively. At deeper layer (20 - 40 cm) of agriculturally exploited Mollic Gleysol ODR ranged be- tween 26 till to 240 μg O2/(m2·s), for as follows pF 0 and pF 2.0. Stronger variety of ODR values in the FL object was observed, we noted values between 60 and 266 μg O2/(m2·s) as in the surface layer, whilst in the subsurface 80% decrease of ODR was found and registered values oscillated from 23 to 81 μg O2/(m2·s), for pF 0 and pF 2.0, respectively. We assume that way of land use and sys- tematically applied ploughing at AE object may be the reason of higher ODR level as well in surface as in sub- surface layer. FL on the other hand, despite the fact of comparable level of ODR in surface layer, in the sub- sur- face was characterized by rapid reduction of oxygen availability, below 35 μg O2/(m2·s), which is the minimum level of ODR necessary for proper root growth [11,22]. This might be caused by lack of human agricultural ac- tivities, as e.g. ploughing may contribute in soil ventila- tion improvement. On the contrary, [19] Walczak et al. (2001) noted tendency for higher oxygen availability in the deeper layers, rather than in surface of the Mollic Gleysol, whereas [23] Stępniewska et al. (2003) observed analogous trend in the Eutric Cambisol. It may be caused either by methodical limitations, as the water barriers or water films present on the surface of electrode could be broken off [9], or by the differences in granulometric composition of analyzed soil samples (Ta- ble 1), as the fact, that large granulation favourable for forming of aeration pores was noted in the subsurface layers. 3.3. Soil Microbial Biomass Soil MB content was also strongly influenced by pF con- ditions and the way of land use (Figure 3). The signifi- cantly higher values (0.0077 and 0.0058 g/g of soil) were stated in the surface layers at full water capacity condi- tions (pF 0) for AL and FL objects, respectively, as com- pared to the deeper layers of soil. In subsurface layers the reduction of MB content, c.a. 5 times, was observed. The highest values of MB estimations in AE object were undoubtedly connected with total organic carbon (TOC) content, what favoured the microorganisms’ abundance by supplying sources of energy necessary for activity of soil biota and growing crops. This observation is consis- tent with other studies [24-26]. Registered almost 85% reduction of MB in the subsurface layers come out of distribution of microorganisms in the soil profile, since microorganisms are mostly confined to the surface soil layer owing to better aeration and greater nutrient avail- ability. Anthropogenic activities and soil management in particular, are mostly responsible for disturbing the che- mico-physical and biological equilibrium of soil [27]. A particularly serious problem is the decrease in the orga- nic matter content of agricultural soils, which may endan- ger soil fertility and enhance erosion. The MB, as a small fraction of soil organic matter, is a source and sink of nutrients and controls soil organic matter mineralization [27,28] Fisk and Fahey (2001), analogically at current study noted higher content of MB (by 20% - 30%) at ag- ricultural areas in response to fertilization, than at fallow ones. Also, other findings pointed out a distinct relation- ship between soil fertility and soil MB, suggesting that MB measurements provide a valid estimate of soil qual- ity [14,29]. 3.4. DNA Content Similarly to MB distribution of DNA concentrations in surface layers were 2 times higher in AE object (Figure 4), than in control soil (not under cultivation) at pF 0. Even more differentiation in subsurface layers were stated, where DNA level reached 12 fold higher values in AE, in Copyright © 2012 SciRes. OJSS  Evaluation of Factors Influencing the Biomass of Soil Microorganisms and DNA Content 68 relation to FL area. The usage of GeneMatrix soil DNA isolation kit let us to receive 0.4 - 1.8 µg/g and 0.5 - 1.2 µg/g of soil DNA concentrations in AE and FL objects, respectively and revealed that the quality (fragment size and purity) of the extracted DNA was generally very good. However, one should always realize that extraction of DNA from soil samples is never 100% efficient and can vary from a few µg to almost 200 µg DNA per g dry weight of soil. Most of authors, however, reported that the obtained values ranged from 1 to about 50 µg of total DNA per g dry weight of soil depending on the method applied and soil sample studied [30,31]. 3.5. Statistical Relationships between Parameters Analyzed Statistical relationships between MB and investigated pa- rameters (pF, ODR, DNA content, way of land use) de- scribed by correlations coefficient (r) are presented in Table 2. Significant influence (p < 0.05) of tested para- meters on MB was found. The positive relationships be- tween MB and DNA content, and negative correlations between MB and soil physical factors like pF and ODR were revealed. Both our and other studies demonstrated that MB can be highly sensitive to environmental factors. Although, study by [32] Singh and Yadava (2006) confirmed nega- tive correlation between MB and soil moisture, even so prior to our study, rather little attention has been paid to the influence of pF, ODR, DNA content and way of land use on soil MB. Therefore, our work was focused on the- se relationships and determination of statistical correla- tions. The positive relationships between MB and DNA content suggest the domination of intercellular DNA form at both AE and FL objects, and MB is considered to be a good factor relating to the total mass of microorganisms present in soil. Our results are supported by the findings of [33] Blagodatskaya et al. (2003), who noted that DNA content correlated strongly with the total MB in Paleosol soils from Southern Urals (R2 = 0.97), as well as by work of [34] Hartmann et al. (2005), who described analogical correlation (r = 0.91***). Nevertheless, the interpretation of our results has been challenging because of the lack of enough publications in available literature concerning the determination of r coefficients as a goodness of fit be- tween investigated soil factors and MB. However, deter- mined relationships demand further investigations and selection of the other soil types, for better explanation and confirmation of the obtained correlations. 4. Conclusion Importantly, the way of land use significantly (p < 0.05) influenced on MB and DNA content, and higher content of MB and DNA concentration were noted in the AE (p < 0.05), in contrast to the FL area. Significant (p < 0.05) positive relationships between soil MB and DNA con- centration were revealed, whereas pF and ODR were ne- gatively correlated to MB. Oxygen availability values of 30 - 255 μg O2/(m2·s) and 20 - 80 μg O2/(m2·s) in the AE and FL objects, respectively, suggested higher oxygen availability in the subsurface layer of AE area (p < 0.05), what might be connected with human agricultural prac- tices, e.g. traditional regular ploughing, which signifi- cantly improves soil aeration status. 5. Acknowledgements This work was supported by the IUVENTUS PLUS grant (No IP 2010 001070). REFERENCES [1] K. Broos, M. L. Macdonald, D. A. Heemsbergen, M. B. Barnes, M. Bell and M. J. McLaughlin, “Limitations of Soil Microbial Biomass Carbon as an Indicator of soil Pollution in the Field,” Soil Biology and Biochemistry, Vol. 39, No. 10, 2007, pp. 2693-2695. doi:10.1016/j.soilbio.2007.05.014 [2] E. A. Stockdale and P. C. Brookes, “Detection and Quan- tification of the Soil Microbial Biomass-Impacts on the Management of Agricultural Soils,” The Journal of Agri- culture Sciences, Vol. 144, No. 4, 2006, pp. 285-302. doi:10.1017/S0021859606006228 [3] A. Winding, K. Hund-Rinke and M. Rutgers, “The use of Microorganisms in Ecological Soil Classification and As- sessment Concepts,” Ecotoxicology and Environmental Safety, Vol. 62, No. 2, 2005, pp. 230-248. [4] M. Schloter, O. Dilly and J. C. Munch, “Indicators for Evaluating Soil Quality,” Agriculture, Ecosystems and En - vironment, Vol. 98, No. 1-3, 2003, pp. 255-262. doi:10.1016/S0167-8809(03)00085-9 [5] M. R. Carter, E. G. Gregorich, D. A. Angers, M. H. Beare, G. P. Sparling, D. A. Wardle and R. P. Voroney, “Inter- pretation of Microbial Biomass Measurements for soil Quality Assessment in Humid Temperate Regions,” Ca- nadian Journal of Soil Science, Vol. 79, No. 4, 1999, pp. 507-520. doi:10.4141/S99-012 [6] L. Ranjard, F. Poly and S. Nazaret, “Monitoring complex Bacterial Communities Using Culture-Independent Mo- lecular Techniques: Application to Soil Environment,” Research in Microbiology, Vol. 151, No. 3, 2000, pp. 167- 177. doi:10.1016/S0923-2508(00)00136-4 [7] A. Wolińska and Z. Stępniewska, “Microorganisms Abun- dance and Dehydrogenase Activity as a Consequence of Soil Reoxidation Process,” In: M. Miransari, Ed., Soil Till- age and Microbial Activities, Research Singpost Publisher, Kerala, 2011, pp. 111-143. [8] R. Daniel, “The Metagenomics of Soil,” Nature Reviews Microbiology, Vol. 3, No. 6, 2005, pp. 470-478. [9] A. Wolińska and R. P. Bennicelli, “Dehydrogenase Activ- ity Response to Soil Reoxidation Process Described as Varied Conditions of Water Potential, Air Porosity and Copyright © 2012 SciRes. OJSS  Evaluation of Factors Influencing the Biomass of Soil Microorganisms and DNA Content Copyright © 2012 SciRes. OJSS 69 Oxygen Availability,” Polish Journal of Environmental Studies, Vol. 19, No. 3, 2010, pp. 651-657. [10] J. Gliński, W. Stępniewski, Z. Stępniewska, T. Włodarczyk and M. Brzezińska, “Characteristics of Aeration Properties of Selected Soil Profiles from Central Europe,” Interna- tional Agrophysics, Vol. 14, No. 1, 2000, pp. 17-31. [11] W. Stępniewski, Z. Stępniewska, J. Gliński, M. Brzeziń- ska, T. Włodarczyk, G. Przywara, G. Varallay and K. Ra- jkai, “Dehydrogenase Activity of Some Hungarian Soils as Related to Their Water and Aeration Status,” Interna- tional Agrophysics, Vol. 14, No. 3, 2000, pp. 341-354. [12] G. L. Hutchinson, “Biosphere-Atmosphere Exchange of Gaseous N Oxides,” In: R. Lal, J. Kimble, E. Levine and B. A. Steward, Eds., Soil and Global Change, CRC Lewis Publisher, Boca Raton, 1995, pp. 219-236. [13] M. Brzezińska, T. Włodarczyk, W. Stępniewski and G. Przywara, “Soil Aeration Status and Catalase Activity,” Acta Agrophysica, Vol. 5, No. 3, 2005, pp. 555-565. [14] J. Zwoliński, “Microbial Biomass versus Soil Fertility in Forest Sites,” Polish Journal of Ecology, Vol. 52, No. 4, 2004, pp. 5553-5561. [15] Z. Z. Jin, J. Q. Lei, X. W. Xu, J. L. Fan, S. F. Zhao, H. W. Zhou and F. Gu, “Relationships of Soil Microbial Bio- mass with Soil Environmental Factors in Tarim Desert Highway Shelter-Forest,” in Chinese, Chinese Journal of Applied Ecology, Vol. 20, No. 1, 2009, pp. 51-57. [16] L. F. Pires, O. O. S. Bacchi and K. Reichardt, “Soil Water Retention Curve Determined by Gamma-Ray Beam At- tenuation,” Soil and Tillage Re search, Vol. 82, No. 1, 2005, pp. 89-97. doi:10.1016/j.still.2004.06.003 [17] M. A. Malicki and A. Bieganowski, “Chronovoltammet- ric Determination of Oxygen Flux Density in the Soil,” International Agrophysics, Vol. 13, No. 3, 1999, pp. 273- 281. [18] R. G. Joergensen, “The Fumigation-Extraction Method to Estimate Soil Microbial Biomass: Calibration of the kEN Value,” Soil Biology and Biochemistry, Vol. 28, No. 1, 1996, pp. 25-31. doi:10.1016/0038-0717(95)00101-8 [19] R. Walczak, B. Witkowska-Walczak and C. Sławiński, “Water Retention and Conductivity of Polish Mollic Gley- sols,” in Polish, Acta Agrophysica, Vol. 53, No. 2, 2001, pp. 211- 223. [20] J. Brouver and H. Anderson, “Water Holding Capacity of Ironstone Gravel in a Typical Plinthoxeralf in Southeast Australia,” Soil Science Society of America Journal, Vol. 64, No. 5, 2000, pp. 1603-1608. doi:10.2136/sssaj2000.6451603x [21] R. Walczak, E. Rovdan and B. Witkowska-Walczak, “Wa- ter Retention Characteristics of Peat and Sand Mixtures,” International Agrophysics, Vol. 16, No. 2, 2002, pp. 161- 165. [22] T. Włodarczyk, W. Stępniewski, M. Brzezińska and G. Przywara, “Impact of Different Aeration Conditions on the Content of Extractable Nutrients in Soil,” International Agrophysics, Vol. 22, No. 4, 2008, pp. 371-375. [23] Z. Stępniewska, A. Wolińska and R. P. Bennicelli, “In- fluence of Soil Water Potential on Microdiffusion of Oxy- gen in the Eutric Cambisol,” Acta Agrophysica, Vol. 84, No. 1, 2003, pp. 145-152. [24] A. M. Gajda, “Effect of Different Tillage Systems on Some Microbiological Properties of Soils under Winter Wheat,” International Agrophysics, Vol. 22, No. 1, 2008, pp. 201- 208. [25] A. M. Gajda, “Microbial Activity and Particulate Organic Matter Content in Soils with Different Tillage System Use,” International Agrophysics, Vol. 24, No. 2, 2010, pp. 129- 137. [26] N. Jedidi, “Microbial Biomass in a Soil Amended with Different Types of Organic Wastes,” Waste Management Research, Vol. 22, No. 2, 2004, pp. 293-299. doi:10.1177/0734242X04043930 [27] P. Nannipieri, L. Badalucco, L. Landi and G. Pietramel- lara, “Measurements in Assessing the Risk of Chemicals to the Soil Ecosystem,” In: J. T. Zelikoff, Ed., Ecotoxi- cology: Responses, Biomarkers and Risk Assessment, SOS Publications, New York, 1997, pp. 507-534. [28] M. C. Fisk and T. J. Fahey, “Microbial Biomass and Ni- trogen Cycling Responses to Fertilization and Litter Re- moval in Young Northern Hardwood Forests,” Biogeo- chemistry, Vol. 53, No. 2, 2001, pp. 201-223. doi:10.1023/A:1010693614196 [29] K. Mohammadi, “Soil Microbial Activity and Biomass as Influenced by Tillage and Fertilization in Wheat Produc- tion,” American-Eurasian Journal of Agriculture and En- vironmental Sciences, Vol. 10, No. 3, 2011, pp. 330-337. [30] S. Lerat, L. England, J. Klironomos, P. Pauls, C. Swanton and J. T. Trevors, “Real-Time Polymerase Chain Reac- tion Detection of the Transgenes for Roundup Ready Corn and Soybean in Soil Samples,” Journal of Agricultural and Food Chemistry, Vol. 53, No. 5, 2005, pp. 1337-1342. doi:10.1021/jf048830+ [31] L. Sagova-Mareckova, L. Cermak, J. Novotna, K. Plhack- ova, J. Forstova and J. Kopecky, “Innovative Methods for Soil DNA Purification Tested in Soils with Widely Dif- fering Characteristics,” Applied and Environmental Mi- crobiology, Vol. 74, No. 9, 2008, pp. 2902-2907. doi:10.1128/AEM.02161-07 [32] L. I. Singh and P. S. Yadava, “Spatial Distribution of Microbial Biomass in Relation to Land-Use in Subtropi- cal Systems of North-East India,” Tropical Ecology, Vol. 47, No. 1, 2006, pp. 63-70. [33] E. V. Blagodatskaya, O. S. Khokhlova and S. A. Blago- datskii, “Extractable Microbial DNA Pool and Microbial Activity in Paleosols of Southern Urals,” Microbiology, Vol. 72, No. 6, 2003, pp. 750-755. doi:10.1023/B:MICI.0000008380.57233.9e [34] M. Hartmann, B. Frey, R. Kölliker and F. Widmer, “Semi- Automated Genetic Analyses of Soil Microbial Commu- nities: Comparison of T-RFLP and RISA Based on De- scriptive and Discriminative Statistical Approaches,” Jour- nal of Microbiological Methods, Vol. 61, No. 3, 2005, pp. 349-360. doi:10.1016/j.mimet.2004.12.011 |