

Paper Menu >>
Journal Menu >>
 Vol.2, No.5, 504-510 (2010) doi:10.4236/health.2010.25075 Copyright © 2010 SciRes. http://www.scirp.org/journal/HEALTH/ Health Openly accessible at Estimating the effect of early discharge policy on readmission rate. An instrumental variable approach Eugenia Amporfu Kwame Nkrumah University of Science and Technology, Kumasi, Ghana; [email protected] Received 23 January 2010; revised 7 February 2010; accepted 8 February 2010. ABSTRACT* Early discharge policy, common in the devel- oped countries, refers to the reduction of hos- pital length of stay as a way of reducing the cost of care. The effect of the policy on quality of care has received a lot of attention in the litera- ture. Some of the earlier papers have ignored the endogeneity of length of stay in the read- mission equation, an approach that could lead to inconsistent estimation. This study develops a statistical technique for the consistent estima- tion of the effect of the early discharge policy. An instrument that can be used extensively across different diagnostic groups is provided, hence solving the difficult problem of finding an in- strument for length of stay. The exogeneity test in Gorgger (1990), the test for weak instruments in Staiger and Stock (1997) as well as the Hensen (1982) for over identification confirmed respec- tively that length of stay is endogenous the in- strument is strong and the valid. Keywords: Instrument; Length of Stay; Early Discharge; Endogeneity; Instrumental Variable Estimation 1. INTRODUCTION Instrumental variable estimation is a two stage estima- tion technique that first purges endogenous regressors, and hence exogenizes them before including them as regressors in a regression equation for estimation. An important reason why instrumental variable estimation is becoming less popular is the difficulty of finding an in- strument. This difficulty is encountered in models that measure the impact of early discharge policy on quality of care. Many studies have thus ignored the need for instrumental variable estimation and hence the consis- tency of their estimated impact of the policy is ques- tionable. The objective of this paper is to develop a sta- tistical technique for consistent estimation of the impact of early discharge on quality of care regardless of the diagnostic group used. The British Columbia (Canada) Ministry of Health and Center for Health Services and Policy Research linked database provided the maternity data used for the study. The models that measured the impact of the early discharge policy on quality of care used readmission and mortality rates as proxies for quality of care with length of stay as one of the independent variables. Length of stay, because it is correlated with an unobservable vari- able, the severity of illness, is endogenous in the regres- sion equation. Severity of illness is unobservable to the researcher but observable to the patient (or doctor) and a severely ill patient is likely to stay long in the hospital and be readmitted. Ignoring the endogeneity of length of stay then can lead to inconsistent estimation and hence unreliable conclusions. Examples of papers that ignored the endogeneity of length of stay in the readmission eq- uation can be cited [1]. Consistent estimation of the impact of early discharge policy on quality of care is important because the policy is implemented extensively across North America and Europe (e.g., Sweden, Norway in the 1990s), as a cost containment strategy. In the United States the policy was induced by the introduction of prospective payment [2] and capitation [3] in the 1980s. In Canada, the policy was introduced by provincial governments in the 1990s (example, 1994 in British Columbia and Alberta) and was often accompanied by home visits implemented thr- ough public health nursing programs. In general, the early discharge policy has raised concern about its im- pact on quality of care and has attracted a lot of studies in the area [2,4]. Information on the impact of the policy on quality of care will serve as an important guide to policy makers on the extent to which the policy is able to reduce the cost of care. Inconsistent estimation of the impact then can lead to misleading results and hence mislead policy makers on the efficiency of the allocation of health care *Data used for this study was provided by British Columbia (Canada) Ministry of Health and Center for Health Services and Policy Research linked database.  E. Amporfu / HEALTH 2 (2010) 504-510 Copyright © 2010 SciRes. http://www.scirp.org/journal/HEALTH/ 505 505 Openly accessible at resources. The endogeneity problem can be solved if severity of illness can be accurately measured and in- cluded in the regression equation. This requires clinical information from medical records [5]. Such an approach is however not used in the literature because it is ex- tremely costly to gather the information [6]. Some studies such as [7] used the cost weight of pa- tients diagnostic group, hospital entry type (i.e., whether it was emergency or elective) and whether the diagnostic group was a surgical or non surgical type as proxies for severity of illness. These variables are reasonable prox- ies for the study’s data: all elderly patients across differ- ent diagnostic groups. Such variables however cannot pass as proxies for all diagnostic groups especially ma- ternity data. This is because for maternity, an emergency entry usually implies advancement in labor but does not necessarily imply severity of illness. Caesarean section could occur by choice, or as a result of the woman’s pel- vic or birth canal or for medical reasons. Thus a woman who undergoes caesarean section is not necessarily ill. Hence surgical delivery cannot be an indicator of sever- ity of illness for a maternity patient and the difficulty of finding a proxy for the severity of illness remains. Find- ing an appropriate instrument for length of stay then would lead to a consistent estimation of the policy’s im- pact on quality of care and nullify the need to find a proxy for severity of illness. The first to alert of the endogeneity problem with length of stay and the need to use instrumental variables to ensure consistent estimation did not come till 2000 [8]. However, [8] used time of delivery and the method of delivery as instruments for length of stay. While these instruments might have produced consistent estimates, the instruments chosen are only restricted to the data set used, newborns, and so cannot be applied to other diag- nostic groups. It is not surprising that more recent papers [1] that did not use infant data ignored the endogeneity problem. What is needed then is an instrument that is highly correlated with length of stay but uncorrelated with severity of illness regardless of the diagnostic group used for the analysis of effect of the early discharge pol- icy. Such an instrument is very important because the early discharge policy is widely implemented for differ- ent diagnostic groups. One such variable in this context is a policy instru- ment for the early discharge policy: the average number of patients per bed in a given year for a given hospital. To implement the early discharge policy hospitals may have to increase the number of patients per bed that is allocated to the diagnostic group targeted by the policy. This could be done by either increasing the size of the population served by the hospital through the closure of other hospitals or by reducing the number of beds in the hospital or both. Because some hospitals are likely to attract the severely ill patients the average number of patients per bed in the hospital of delivery could be cor- related with the severity of illness. Thus for each obser- vation (patient) I computed the average number patients per bed whether or not it was the choice hospital. The number of patients per bed is a better instrument than the year of policy used in an earlier work [9] because year of policy is only valid as an instrument if no other policy that could affect readmission rate was implemented in the years of and after the policy. Weak instrument test was used to test for the strength of the instrument [10]. The paper is organized as follows. Section 2 describes the model, its estimation and various tests performed. Section 3 describes the data while Section 4 reports the results and Section 5 discusses the results. 2. METHODS 2.1. The Model The model for the analysis has two regression equations, an OLS regression Eq.1, and a discrete time duration hazard Eq.2: ii LOSZ u (1) ˆ it it yLOSZ (2) where LOS represents length of stay in days, is a vector of the instruments, the annual average number of patients per bed for each hospital; Z represents the ob- servable characteristics of the patient: age, income, me- thod of delivery, complications, Indian status, education and birth rate of patient’s neighborhood; ui is the unob- served characteristic, severity of illness, of the patient that affects length of stay. Complications is a dummy variable indicating whether the patient’s diagnostic short list falls between 147 and 151 which includes hemor- rhage of pregnancy, care during pregnancy as well as complications in labor, delivery and pueperium. Note that complication is observable and it differs from sever- ity of illness in that two patients may both have hemor- rhage but differ in severity. In (2), yit is a binary variable indicating whether or not patient i is readmitted t days (t is from 1 to ninety) after discharge. Thus yit = 1 if the patient is readmitted and zero otherwise. Even though the body takes about 60 days to return to its pre-pregnancy state, when psycho- logical adjustment is taken into account, the woman needs at least 90 days to adjust. Thus 90 days is long enough for any impact of the early discharge policy to be found. The error term it = it it v it , where vit is the severity of illness component of and εit is identi- cally and independently distributed. Thus it is assumed that apart from the severity of illness the error term, it , is identically and independently distributed. The pres- ence of severity of illness means that vit is correlated 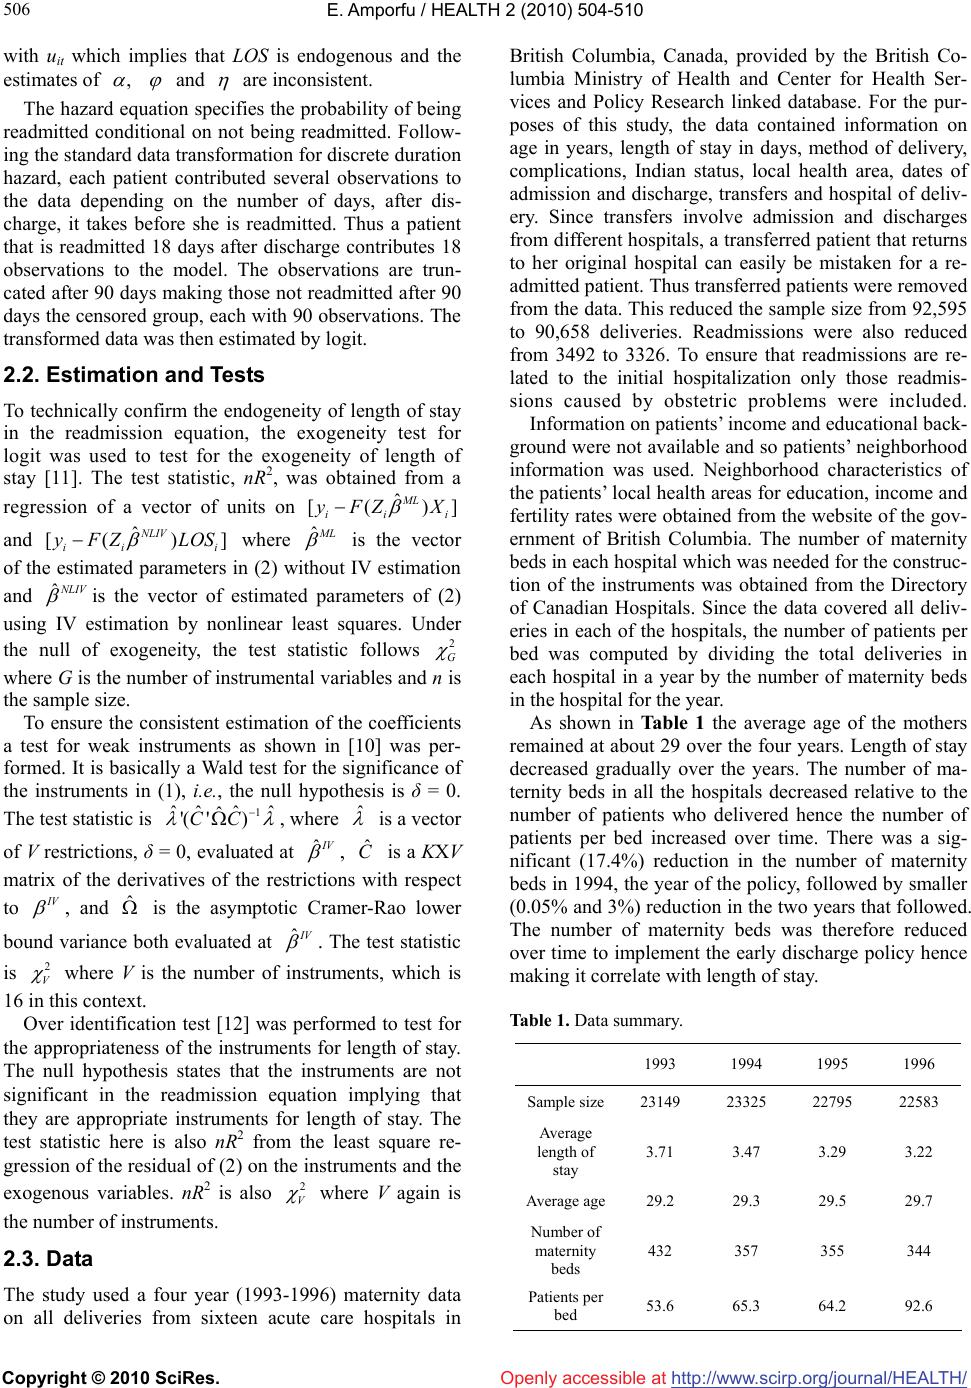 E. Amporfu / HEALTH 2 (2010) 504-510 Copyright © 2010 SciRes. http://www.scirp.org/journal/HEALTH/ 506 Openly accessible at with uit which implies that LOS is endogenous and the estimates of , and are inconsistent. The hazard equation specifies the probability of being readmitted conditional on not being readmitted. Follow- ing the standard data transformation for discrete duration hazard, each patient contributed several observations to the data depending on the number of days, after dis- charge, it takes before she is readmitted. Thus a patient that is readmitted 18 days after discharge contributes 18 observations to the model. The observations are trun- cated after 90 days making those not readmitted after 90 days the censored group, each with 90 observations. The transformed data was then estimated by logit. 2.2. Estimation and Tests To technically confirm the endogeneity of length of stay in the readmission equation, the exogeneity test for logit was used to test for the exogeneity of length of stay [11]. The test statistic, nR2, was obtained from a regression of a vector of units on ˆ [() ML ii ] i y FZ X and ˆ ii [( ) NLIV y FZ LO] i S where ˆ M L is the vector of the estimated parameters in (2) without IV estimation and is the vector of estimated parameters of (2) using IV estimation by nonlinear least squares. Under the null of exogeneity, the test statistic follows ˆNLIV 2 G where G is the number of instrumental variables and n is the sample size. To ensure the consistent estimation of the coefficients a test for weak instruments as shown in [10] was per- formed. It is basically a Wald test for the significance of the instruments in (1), i.e. , the null hypothesis is δ = 0. The test statistic is 1 ˆˆˆ ˆ '( ') ˆ CC , where ˆ is a vector of V restrictions, δ = 0, evaluated at ˆ I V , is a KXV matrix of the derivatives of the restrictions with respect to ˆ C I V , and is the asymptotic Cramer-Rao lower bound variance both evaluated at ˆ ˆ I V . The test statistic is 2 V where V is the number of instruments, which is 16 in this context. Over identification test [12] was performed to test for the appropriateness of the instruments for length of stay. The null hypothesis states that the instruments are not significant in the readmission equation implying that they are appropriate instruments for length of stay. The test statistic here is also nR2 from the least square re- gression of the residual of (2) on the instruments and the exogenous variables. nR2 is also 2 V where V again is the number of instruments. 2.3. Data The study used a four year (1993-1996) maternity data on all deliveries from sixteen acute care hospitals in British Columbia, Canada, provided by the British Co- lumbia Ministry of Health and Center for Health Ser- vices and Policy Research linked database. For the pur- poses of this study, the data contained information on age in years, length of stay in days, method of delivery, complications, Indian status, local health area, dates of admission and discharge, transfers and hospital of deliv- ery. Since transfers involve admission and discharges from different hospitals, a transferred patient that returns to her original hospital can easily be mistaken for a re- admitted patient. Thus transferred patients were removed from the data. This reduced the sample size from 92,595 to 90,658 deliveries. Readmissions were also reduced from 3492 to 3326. To ensure that readmissions are re- lated to the initial hospitalization only those readmis- sions caused by obstetric problems were included. Information on patients’ income and educational back- ground were not available and so patients’ neighborhood information was used. Neighborhood characteristics of the patients’ local health areas for education, income and fertility rates were obtained from the website of the gov- ernment of British Columbia. The number of maternity beds in each hospital which was needed for the construc- tion of the instruments was obtained from the Directory of Canadian Hospitals. Since the data covered all deliv- eries in each of the hospitals, the number of patients per bed was computed by dividing the total deliveries in each hospital in a year by the number of maternity beds in the hospital for the year. As shown in Table 1 the average age of the mothers remained at about 29 over the four years. Length of stay decreased gradually over the years. The number of ma- ternity beds in all the hospitals decreased relative to the number of patients who delivered hence the number of patients per bed increased over time. There was a sig- nificant (17.4%) reduction in the number of maternity beds in 1994, the year of the policy, followed by smaller (0.05% and 3%) reduction in the two years that followed. The number of maternity beds was therefore reduced over time to implement the early discharge policy hence making it correlate with length of stay. Table 1. Data summary. 1993 1994 1995 1996 Sample size23149 23325 22795 22583 Average length of stay 3.71 3.47 3.29 3.22 Average age29.2 29.3 29.5 29.7 Number of maternity beds 432 357 355 344 Patients per bed 53.6 65.3 64.2 92.6 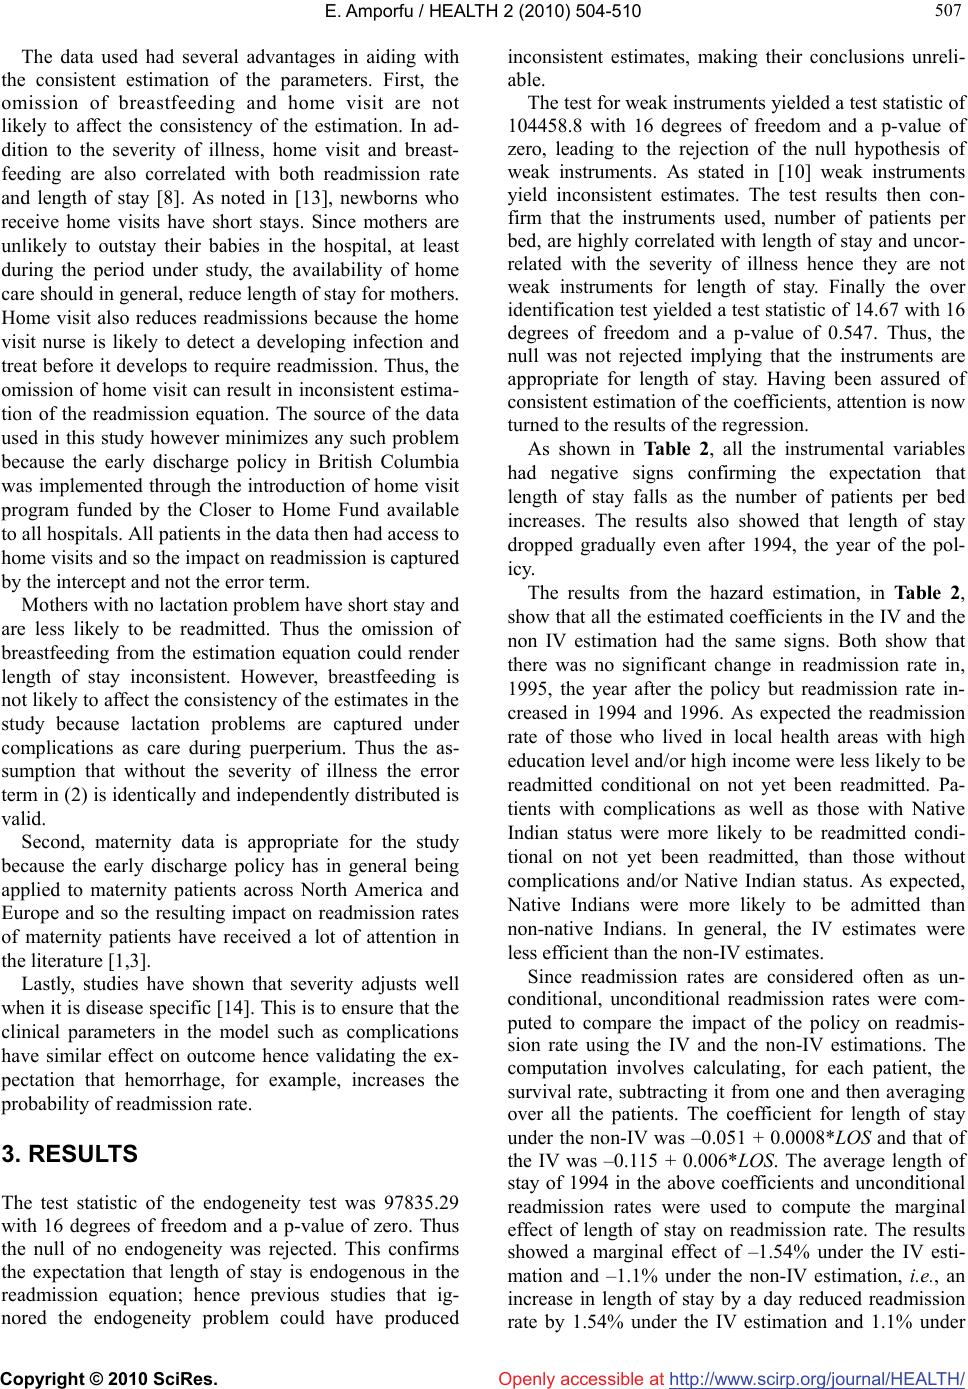 E. Amporfu / HEALTH 2 (2010) 504-510 Copyright © 2010 SciRes. http://www.scirp.org/journal/HEALTH/Openly accessible at 507 507 The data used had several advantages in aiding with the consistent estimation of the parameters. First, the omission of breastfeeding and home visit are not likely to affect the consistency of the estimation. In ad- dition to the severity of illness, home visit and breast- feeding are also correlated with both readmission rate and length of stay [8]. As noted in [13], newborns who receive home visits have short stays. Since mothers are unlikely to outstay their babies in the hospital, at least during the period under study, the availability of home care should in general, reduce length of stay for mothers. Home visit also reduces readmissions because the home visit nurse is likely to detect a developing infection and treat before it develops to require readmission. Thus, the omission of home visit can result in inconsistent estima- tion of the readmission equation. The source of the data used in this study however minimizes any such problem because the early discharge policy in British Columbia was implemented through the introduction of home visit program funded by the Closer to Home Fund available to all hospitals. All patients in the data then had access to home visits and so the impact on readmission is captured by the intercept and not the error term. Mothers with no lactation problem have short stay and are less likely to be readmitted. Thus the omission of breastfeeding from the estimation equation could render length of stay inconsistent. However, breastfeeding is not likely to affect the consistency of the estimates in the study because lactation problems are captured under complications as care during puerperium. Thus the as- sumption that without the severity of illness the error term in (2) is identically and independently distributed is valid. Second, maternity data is appropriate for the study because the early discharge policy has in general being applied to maternity patients across North America and Europe and so the resulting impact on readmission rates of maternity patients have received a lot of attention in the literature [1,3]. Lastly, studies have shown that severity adjusts well when it is disease specific [14]. This is to ensure that the clinical parameters in the model such as complications have similar effect on outcome hence validating the ex- pectation that hemorrhage, for example, increases the probability of readmission rate. 3. RESULTS The test statistic of the endogeneity test was 97835.29 with 16 degrees of freedom and a p-value of zero. Thus the null of no endogeneity was rejected. This confirms the expectation that length of stay is endogenous in the readmission equation; hence previous studies that ig- nored the endogeneity problem could have produced inconsistent estimates, making their conclusions unreli- able. The test for weak instruments yielded a test statistic of 104458.8 with 16 degrees of freedom and a p-value of zero, leading to the rejection of the null hypothesis of weak instruments. As stated in [10] weak instruments yield inconsistent estimates. The test results then con- firm that the instruments used, number of patients per bed, are highly correlated with length of stay and uncor- related with the severity of illness hence they are not weak instruments for length of stay. Finally the over identification test yielded a test statistic of 14.67 with 16 degrees of freedom and a p-value of 0.547. Thus, the null was not rejected implying that the instruments are appropriate for length of stay. Having been assured of consistent estimation of the coefficients, attention is now turned to the results of the regression. As shown in Table 2, all the instrumental variables had negative signs confirming the expectation that length of stay falls as the number of patients per bed increases. The results also showed that length of stay dropped gradually even after 1994, the year of the pol- icy. The results from the hazard estimation, in Table 2, show that all the estimated coefficients in the IV and the non IV estimation had the same signs. Both show that there was no significant change in readmission rate in, 1995, the year after the policy but readmission rate in- creased in 1994 and 1996. As expected the readmission rate of those who lived in local health areas with high education level and/or high income were less likely to be readmitted conditional on not yet been readmitted. Pa- tients with complications as well as those with Native Indian status were more likely to be readmitted condi- tional on not yet been readmitted, than those without complications and/or Native Indian status. As expected, Native Indians were more likely to be admitted than non-native Indians. In general, the IV estimates were less efficient than the non-IV estimates. Since readmission rates are considered often as un- conditional, unconditional readmission rates were com- puted to compare the impact of the policy on readmis- sion rate using the IV and the non-IV estimations. The computation involves calculating, for each patient, the survival rate, subtracting it from one and then averaging over all the patients. The coefficient for length of stay under the non-IV was –0.051 + 0.0008*LOS and that of the IV was –0.115 + 0.006*LOS. The average length of stay of 1994 in the above coefficients and unconditional readmission rates were used to compute the marginal effect of length of stay on readmission rate. The results showed a marginal effect of –1.54% under the IV esti- mation and –1.1% under the non-IV estimation, i.e., an increase in length of stay by a day reduced readmission rate by 1.54% under the IV estimation and 1.1% under 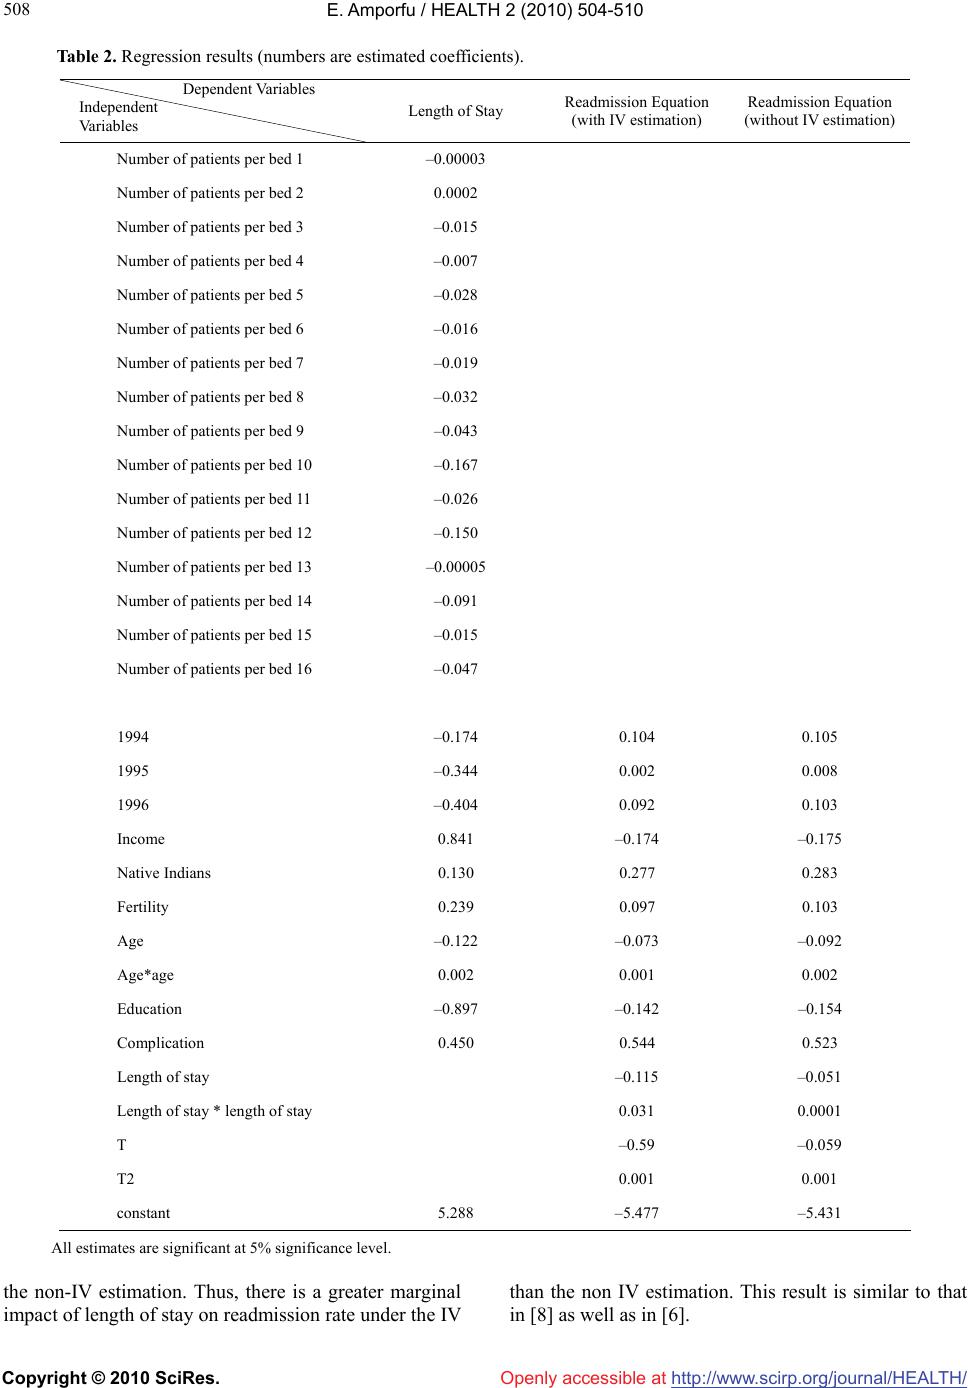 E. Amporfu / HEALTH 2 (2010) 504-510 Copyright © 2010 SciRes. http://www.scirp.org/journal/HEALTH/Openly accessible at 508 Table 2. Regression results (numbers are estimated coefficients). Dependent Variables Independent Va ri a bl e s Length of Stay Readmission Equation (with IV estimation) Readmission Equation (without IV estimation) Number of patients per bed 1 –0.00003 Number of patients per bed 2 0.0002 Number of patients per bed 3 –0.015 Number of patients per bed 4 –0.007 Number of patients per bed 5 –0.028 Number of patients per bed 6 –0.016 Number of patients per bed 7 –0.019 Number of patients per bed 8 –0.032 Number of patients per bed 9 –0.043 Number of patients per bed 10 –0.167 Number of patients per bed 11 –0.026 Number of patients per bed 12 –0.150 Number of patients per bed 13 –0.00005 Number of patients per bed 14 –0.091 Number of patients per bed 15 –0.015 Number of patients per bed 16 –0.047 1994 –0.174 0.104 0.105 1995 –0.344 0.002 0.008 1996 –0.404 0.092 0.103 Income 0.841 –0.174 –0.175 Native Indians 0.130 0.277 0.283 Fertility 0.239 0.097 0.103 Age –0.122 –0.073 –0.092 Age*age 0.002 0.001 0.002 Education –0.897 –0.142 –0.154 Complication 0.450 0.544 0.523 Length of stay –0.115 –0.051 Length of stay * length of stay 0.031 0.0001 T –0.59 –0.059 T2 0.001 0.001 constant 5.288 –5.477 –5.431 All estimates are significant at 5% significance level. the non-IV estimation. Thus, there is a greater marginal impact of length of stay on readmission rate under the IV than the non IV estimation. This result is similar to that in [8] as well as in [6]. 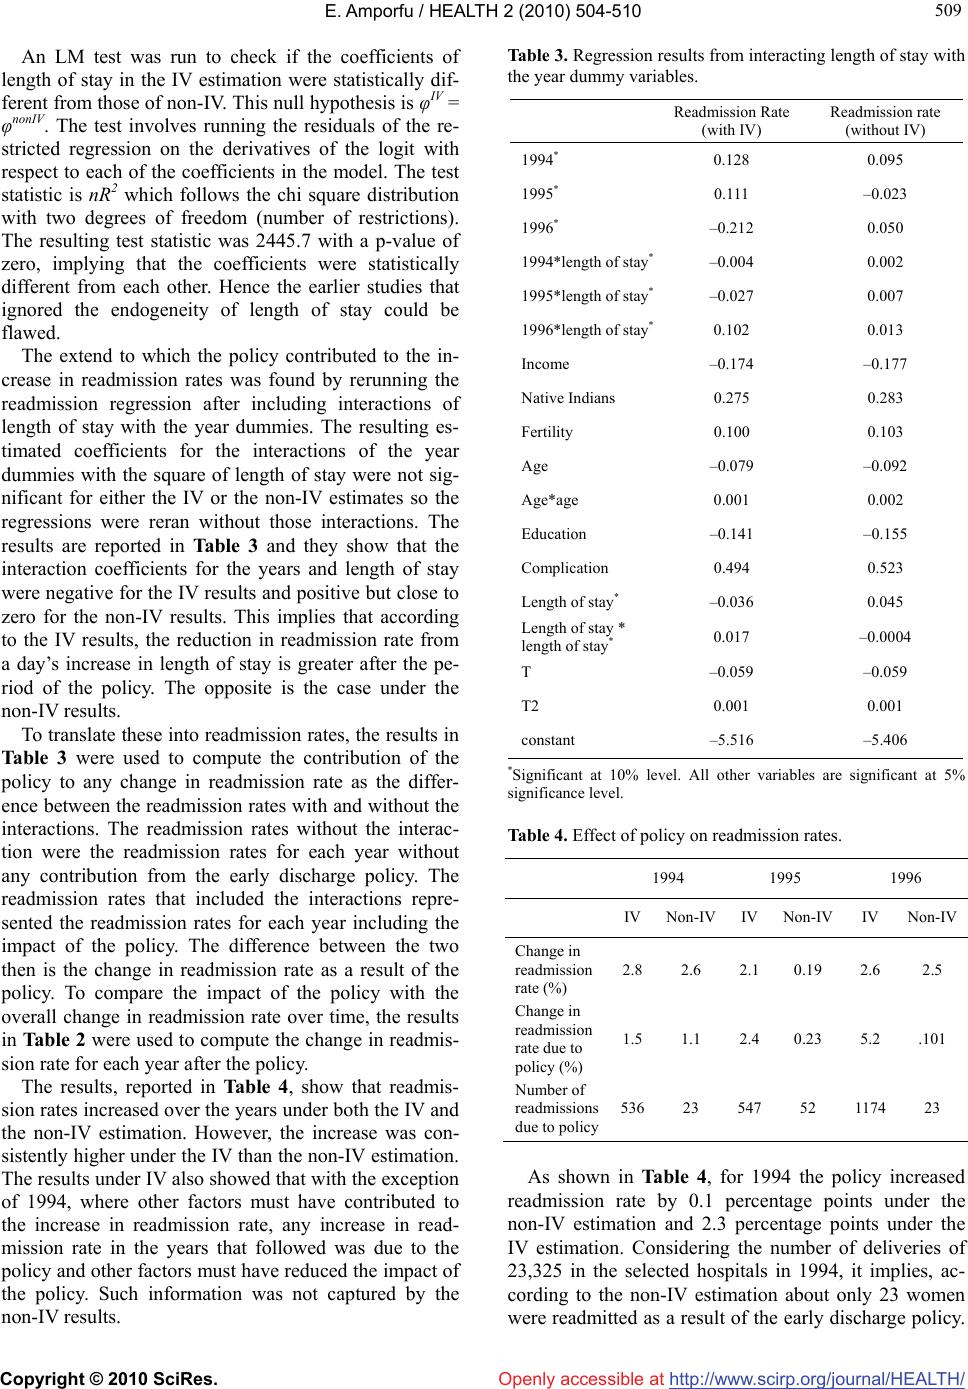 E. Amporfu / HEALTH 2 (2010) 504-510 Copyright © 2010 SciRes. http://www.scirp.org/journal/HEALTH/Openly accessible at 509 509 An LM test was run to check if the coefficients of length of stay in the IV estimation were statistically dif- ferent from those of non-IV. This null hypothesis is φIV = φnonIV. The test involves running the residuals of the re- stricted regression on the derivatives of the logit with respect to each of the coefficients in the model. The test statistic is nR2 which follows the chi square distribution with two degrees of freedom (number of restrictions). The resulting test statistic was 2445.7 with a p-value of zero, implying that the coefficients were statistically different from each other. Hence the earlier studies that ignored the endogeneity of length of stay could be flawed. The extend to which the policy contributed to the in- crease in readmission rates was found by rerunning the readmission regression after including interactions of length of stay with the year dummies. The resulting es- timated coefficients for the interactions of the year dummies with the square of length of stay were not sig- nificant for either the IV or the non-IV estimates so the regressions were reran without those interactions. The results are reported in Table 3 and they show that the interaction coefficients for the years and length of stay were negative for the IV results and positive but close to zero for the non-IV results. This implies that according to the IV results, the reduction in readmission rate from a day’s increase in length of stay is greater after the pe- riod of the policy. The opposite is the case under the non-IV results. To translate these into readmission rates, the results in Table 3 were used to compute the contribution of the policy to any change in readmission rate as the differ- ence between the readmission rates with and without the interactions. The readmission rates without the interac- tion were the readmission rates for each year without any contribution from the early discharge policy. The readmission rates that included the interactions repre- sented the readmission rates for each year including the impact of the policy. The difference between the two then is the change in readmission rate as a result of the policy. To compare the impact of the policy with the overall change in readmission rate over time, the results in Table 2 were used to compute the change in readmis- sion rate for each year after the policy. The results, reported in Table 4, show that readmis- sion rates increased over the years under both the IV and the non-IV estimation. However, the increase was con- sistently higher under the IV than the non-IV estimation. The results under IV also showed that with the exception of 1994, where other factors must have contributed to the increase in readmission rate, any increase in read- mission rate in the years that followed was due to the policy and other factors must have reduced the impact of the policy. Such information was not captured by the non-IV results. Table 3. Regression results from interacting length of stay with the year dummy variables. Readmission Rate (with IV) Readmission rate (without IV) 1994* 0.128 0.095 1995* 0.111 –0.023 1996* –0.212 0.050 1994*length of stay*–0.004 0.002 1995*length of stay*–0.027 0.007 1996*length of stay*0.102 0.013 Income –0.174 –0.177 Native Indians 0.275 0.283 Fertility 0.100 0.103 Age –0.079 –0.092 Age*age 0.001 0.002 Education –0.141 –0.155 Complication 0.494 0.523 Length of stay* –0.036 0.045 Length of stay * length of stay* 0.017 –0.0004 T –0.059 –0.059 T2 0.001 0.001 constant –5.516 –5.406 *Significant at 10% level. All other variables are significant at 5% significance level. Table 4. Effect of policy on readmission rates. 1994 1995 1996 IVNon-IVIV Non-IV IV Non-IV Change in readmission rate (%) 2.8 2.6 2.1 0.19 2.6 2.5 Change in readmission rate due to policy (%) 1.5 1.1 2.4 0.23 5.2 .101 Number of readmissions due to policy 53623 547 52 1174 23 As shown in Table 4, for 1994 the policy increased readmission rate by 0.1 percentage points under the non-IV estimation and 2.3 percentage points under the IV estimation. Considering the number of deliveries of 23,325 in the selected hospitals in 1994, it implies, ac- cording to the non-IV estimation about only 23 women were readmitted as a result of the early discharge policy. 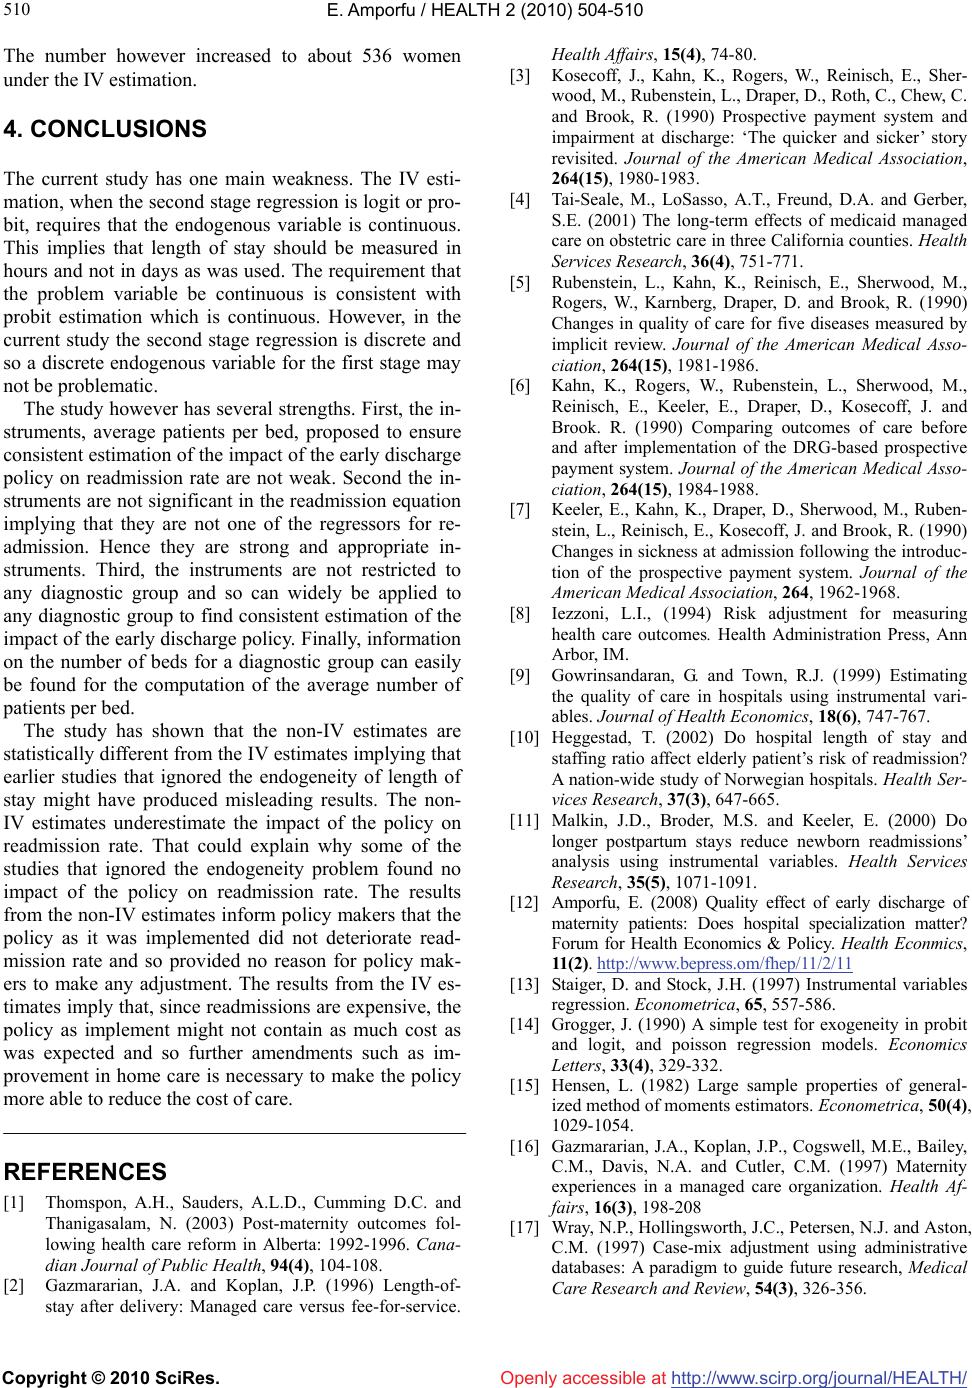 E. Amporfu / HEALTH 2 (2010) 504-510 Copyright © 2010 SciRes. http://www.scirp.org/journal/HEALTH/ 510 The number however increased to about 536 women under the IV estimation. Openly accessible at 4. CONCLUSIONS The current study has one main weakness. The IV esti- mation, when the second stage regression is logit or pro- bit, requires that the endogenous variable is continuous. This implies that length of stay should be measured in hours and not in days as was used. The requirement that the problem variable be continuous is consistent with probit estimation which is continuous. However, in the current study the second stage regression is discrete and so a discrete endogenous variable for the first stage may not be problematic. The study however has several strengths. First, the in- struments, average patients per bed, proposed to ensure consistent estimation of the impact of the early discharge policy on readmission rate are not weak. Second the in- struments are not significant in the readmission equation implying that they are not one of the regressors for re- admission. Hence they are strong and appropriate in- struments. Third, the instruments are not restricted to any diagnostic group and so can widely be applied to any diagnostic group to find consistent estimation of the impact of the early discharge policy. Finally, information on the number of beds for a diagnostic group can easily be found for the computation of the average number of patients per bed. The study has shown that the non-IV estimates are statistically different from the IV estimates implying that earlier studies that ignored the endogeneity of length of stay might have produced misleading results. The non- IV estimates underestimate the impact of the policy on readmission rate. That could explain why some of the studies that ignored the endogeneity problem found no impact of the policy on readmission rate. The results from the non-IV estimates inform policy makers that the policy as it was implemented did not deteriorate read- mission rate and so provided no reason for policy mak- ers to make any adjustment. The results from the IV es- timates imply that, since readmissions are expensive, the policy as implement might not contain as much cost as was expected and so further amendments such as im- provement in home care is necessary to make the policy more able to reduce the cost of care. REFERENCES [1] Thomspon, A.H., Sauders, A.L.D., Cumming D.C. and Thanigasalam, N. (2003) Post-maternity outcomes fol- lowing health care reform in Alberta: 1992-1996. Cana- dian Journal of Public Health, 94(4), 104-108. [2] Gazmararian, J.A. and Koplan, J.P. (1996) Length-of- stay after delivery: Managed care versus fee-for-service. Health Affairs, 15(4), 74-80. [3] Kosecoff, J., Kahn, K., Rogers, W., Reinisch, E., Sher- wood, M., Rubenstein, L., Draper, D., Roth, C., Chew, C. and Brook, R. (1990) Prospective payment system and impairment at discharge: ‘The quicker and sicker’ story revisited. Journal of the American Medical Association, 264(15), 1980-1983. [4] Tai-Seale, M., LoSasso, A.T., Freund, D.A. and Gerber, S.E. (2001) The long-term effects of medicaid managed care on obstetric care in three California counties. Health Services Research, 36(4), 751-771. [5] Rubenstein, L., Kahn, K., Reinisch, E., Sherwood, M., Rogers, W., Karnberg, Draper, D. and Brook, R. (1990) Changes in quality of care for five diseases measured by implicit review. Journal of the American Medical Asso- ciation, 264(15), 1981-1986. [6] Kahn, K., Rogers, W., Rubenstein, L., Sherwood, M., Reinisch, E., Keeler, E., Draper, D., Kosecoff, J. and Brook. R. (1990) Comparing outcomes of care before and after implementation of the DRG-based prospective payment system. Journal of the American Medical Asso- ciation, 264(15), 1984-1988. [7] Keeler, E., Kahn, K., Draper, D., Sherwood, M., Ruben- stein, L., Reinisch, E., Kosecoff, J. and Brook, R. (1990) Changes in sickness at admission following the introduc- tion of the prospective payment system. Journal of the American Medical Association, 264, 1962-1968. [8] Iezzoni, L.I., (1994) Risk adjustment for measuring health care outcomes. Health Administration Press, Ann Arbor, IM. [9] Gowrinsandaran, G. and Town, R.J. (1999) Estimating the quality of care in hospitals using instrumental vari- ables. Journal of Health Economics, 18(6), 747-767. [10] Heggestad, T. (2002) Do hospital length of stay and staffing ratio affect elderly patient’s risk of readmission? A nation-wide study of Norwegian hospitals. Health Ser- vices Research, 37(3), 647-665. [11] Malkin, J.D., Broder, M.S. and Keeler, E. (2000) Do longer postpartum stays reduce newborn readmissions’ analysis using instrumental variables. Health Services Research, 35(5), 1071-1091. [12] Amporfu, E. (2008) Quality effect of early discharge of maternity patients: Does hospital specialization matter? Forum for Health Economics & Policy. Health Econmics, 11(2). http://www.bep ress.om/f he p/11/2/11 [13] Staiger, D. and Stock, J.H. (1997) Instrumental variables regression. Econometrica, 65, 557-586. [14] Grogger, J. (1990) A simple test for exogeneity in probit and logit, and poisson regression models. Economics Letters, 33(4), 329-332. [15] Hensen, L. (1982) Large sample properties of general- ized method of moments estimators. Econometrica, 50(4), 1029-1054. [16] Gazmararian, J.A., Koplan, J.P., Cogswell, M.E., Bailey, C.M., Davis, N.A. and Cutler, C.M. (1997) Maternity experiences in a managed care organization. Health Af- fairs, 16(3), 198-208 [17] Wray, N.P., Hollingsworth, J.C., Petersen, N.J. and Aston, C.M. (1997) Case-mix adjustment using administrative databases: A paradigm to guide future research, Medical Care Research and Review, 54(3), 326-356. |