

Paper Menu >>
Journal Menu >>
 Vol.2, No.5, 477-483 (2010) doi:10.4236/health.2010.25071 Copyright © 2010 SciRes. Openly accessible at http://www.scirp.org/journal/HEALTH/ Health Responses of the perfused liver of neonatal type 2 diabetic rats to gluconeogenic and ammoniogenic substrates Mirian Carvalho-Martini, Fumie Suzuki-Kemmelmeier, Denise Silva de Oliveira, Jurandir Fernando Comar, Adelar Bracht* Department of Biochemistry, University of Maringá, Maringá, Brazil; *Corresponding Author: [email protected] Received 23 December 2009; revised 6 February 2010; accepted 8 February 2010. ABSTRACT The responses of livers from rats with type 2 diabetes to alanine (gluconeogenesis and am- monia detoxification) and other gluconeogenic substrates were investigated. The experimental system was the isolated perfused rat liver. Neonatal type 2 diabetes was induced with streptozotocin. Ammoniogenesis from endoge- nous substrates was 610% higher in livers from diabetic rats when compared to the control condition. Alanine (2.5 mM) ammoniogenesis was 285% higher in livers of diabetic rats. Glu- coneogenesis from the following substrates was smaller in the liver of diabetic rats: Alanine (43.5%), lactate (28.3%) and glycerol (30.5%). Pyruvate gluconeogenesis was normal. The high rate of ammoniogenesis explains the mod- erate hyperammonemia of type 2 diabetic rats. The enzymatic machinery of the gluconeo- genic pathway of type 2 diabetic rats seems to be adapted to low rates of glucose removal by extrahepatic tissues. A significant contribution of gluconeogenesis to the fasting hyperglycemia can be expected only by short-term up-regulation mechanisms. Keywords: Type 2 Diabetes; Gluconeogenesis; Ammoniogenesis; Alanine; Lactate 1. INTRODUCTION Increased hepatic glucose production is characteristic of type 1 diabetes mellitus [1,2]. Particularly in the fasted state, elevated hepatic gluconeogenesis seems to be the main cause for the hyperglycemic condition in type 1 diabetes [3]. If the hyperglycemic condition in type 2 diabetes is also at least partly dependent on enhanced gluconeogenesis is not clear. There are reports claiming that this dependence is more accentuated in severely hyperglycemic patients and that it tends to diminish or even vanish in moderately hyperglycemic patients [4]. There are also studies in which no enhanced gluconeo- genesis was found in type 2 diabetic patients [5]. It is generally believed that the enhanced gluconeogenesis is caused by an increased efficiency of the gluconeogenic pathway in combination with an augmented mobilization of glucose precursors to the liver [6,7]. Although gluconeogenesis can be measured in vivo using appropriate tracer techniques [4,8,9] it is of inter- est to reproduce the increased hepatic gluconeogenesis in isolated cell systems because this allows conclusions about its mechanisms. In the isolated perfused rat liver for example, the gluconeogenic activity reflects the en- zymatic capacities. These, in turn, reflect the medium- and long-term effects of the circulating hormones on the expression of enzymes and other factors. For type 1 dia- betes mellitus, increased gluconeogenesis in isolated hepatocytes or the isolated perfused liver from a variety of substrates has been found [10-15]. When alanine was the substrate, enhanced gluconeogenesis was found in the fasted state, combined with increased rates of urea production and increased rates of alanine incorporation into proteins [11]. These observations with alanine are consistent with the increased rates of mobilization of this amino acid in type 1 diabetes [6]. All these data reveal that short-term regulation operates most probably as a secondary mechanism for the enhanced gluconeogenesis in type 1 diabetes, the medium and long-term expression of key enzymes playing the decisive role [16]. Experiments in which gluconeogenesis was measured in the liver of rats with type 2 diabetes have not been done until now. They are of interest, however, because they will provide the same information about the enzy- matic machinery that is already available for type 1 dia- betes. The hypothesis that can be formulated is that en- This work was sponsored by the Conselho Nacional de Desenvolvimento Científico e Tecnológico (CNPq) and Programa Nacional de Núcleos de Excelência (PRONEX, Fundação Araucária-CNPq).  M. Carvalho-Martini et al. / HEALTH 2 (2010) 477-483 Copyright © 2010 SciRes. http://www.scirp.org/journal/HEALTH/Openly accessible at 478 hanced gluconeogenesis should be detectable in the iso- lated rat liver of type 2 diabetic rats in the same way as it was detected in livers from type 1 diabetic animals. En- hanced gluconeogenesis in the isolated organ would be reflecting mainly medium- and long-term effects of the circulating hormones on enzyme expression. With this hypothesis in mind, in the present work experiments were conducted with livers of type 2 diabetic rats. The neonatal streptozotocin-induced rat model of type 2 dia- betes mellitus was used. It has been praised as a good model for type 2 diabetes in humans because it presents several of its characteristics [17]. In addition to glu- coneogenesis, nitrogen metabolism from alanine was also measured. Evaluation of nitrogen metabolism is of interest because, in addition to hyperglycemia, type 2 diabetic rats also present moderate hyperammonemia [18]. For comparative purposes other gluconeogenic precursors, such as lactate and pyruvate, were also in- vestigated. 2. MATERIALS AND METHODS The liver perfusion apparatus was built in the workshops of the University of Maringá. Enzymes and coenzymes used in the assay procedures and streptozotocin were purchased from Sigma Chemical Co. (St. Louis, USA). All other chemicals were from the best available grade. Neonatal type 2 diabetes mellitus was induced as pre- viously described [19,20]. Male newborn (2 days old) Wistar rats were injected intraperitoneally with strepto- zotocin (160 mg/kg) dissolved in citrate buffer. Control rats were injected with citrate buffer. Seven weeks later, diabetes was confirmed by blood glucose levels (8-10 mM), glucose appearance in urine and 24 hours urinary vol- ume (generally 500% above normal). After seven weeks the mean weights of the control and diabetic rats were 220 2.8 and 203.2 5.2 g, respectively. All animal experiments were done according to the universally ac- cepted standards for animal experimentation. Rats were fed ad libitum with a standard laboratory diet (Purina), but food was withdrawn 24 hours prior to the perfusion experiments. For the surgical procedure, rats were anesthetized by intraperitoneal injection of sodium pentobarbital (50 mg/kg). Hemoglobin-free, non-recirculating perfusion was undertaken according to the technique described elsewhere [21,22]. After cannu- lation of the portal and cava veins the liver was posi- tioned in a plexiglass chamber. The hepatic artery was closed (monovascular perfusion) and the bile duct was left open. The flow was maintained constant by a peri- staltic pump (Minipuls 3, Gilson, France) and was ad- justed to between 30 and 35 ml min1, depending on the liver weight. The perfusion fluid was Krebs-Henseleit- bicarbonate buffer (pH 7.4), saturated with a mixture of oxygen and carbon dioxide (95:5) by means of a mem- brane oxygenator with simultaneous temperature adjust- ment at 37oC. The composition of the Krebs-Henseleit- bicarbonate buffer is: 115 mM NaCl, 25 mM NaHCO3, 5.8 mM KCl, 1.2 mM Na2SO4, 1.18 mM MgCl2, 1.2 mM NaH2PO4 and 2.5 mM CaCl2. L-Alanine (2.5 mM), lac- tate (2.5 mM), pyruvate (1 mM) or glycerol (2 mM) were dissolved in the perfusion fluid. Samples of the effluent perfusion fluid were collected at 4 minute intervals and analyzed for their metabolite content. The following compounds were assayed by means of standard enzy- matic procedures [23]: lactate, pyruvate, glucose, urea, ammonia, glutamine and glutamate. The oxygen con- centration in the outflowing perfusate was monitored polarographically employing a teflon-shielded platinum electrode adequately positioned in a plexiglass chamber at the exit of the perfusate [22]. Rats after a 24-hours’ fast were used because this minimizes interference of endogenous glycogen [24]. As shown by previous work the fasting glycogen levels of control and type 2 diabetic rats are very low when com- pared to the fed state [18]. Basal rates (absence of substrates) as well as incre- ments caused by substrates (L-alanine, lactate, pyruvate or glycerol) were evaluated. The latter were calculated by subtracting the basal rates (before substrate infusion) from the steady-state rates found at the end of the sub- strate infusion period. The error parameters presented in graphs and tables are standard errors of the means. Dif- ferences between pairs of means were analyzed by means of Student’s t test. The 5% level (p < 0.05) was adopted as a criterion of significance. 3. RESULTS Table 1 lists the basal rates of metabolite release of liv- ers from 24-hours fasted rats perfused with substrate- free medium. Under such conditions the livers are de- pendent solely on endogenous sources. The rates were referred to the wet liver weights which were not different in control and diabetic rats, namely 3.31 0.09 and 3.53 0.13 g per 100 g body weight, respectively. As re- vealed by Table 1 most basal rates were low. This did not occur with oxygen uptake and it should be noted that it was 13.6% lower in the liver of diabetic rats. Ammonia production, however, was 610% higher in the diabetic condition. All other parameters were similar in both the control and the diabetic condition. Figure 1 illustrates the experimental protocol that was employed in the present study as well as the time course of the changes in three selected parameters. Sampling of the effluent perfusate for metabolite determination was always initiated after oxygen uptake stabilization (zero time). Alanine infusion was initiated at 12 minutes in the time scale of Figure 1. The time courses of the changes 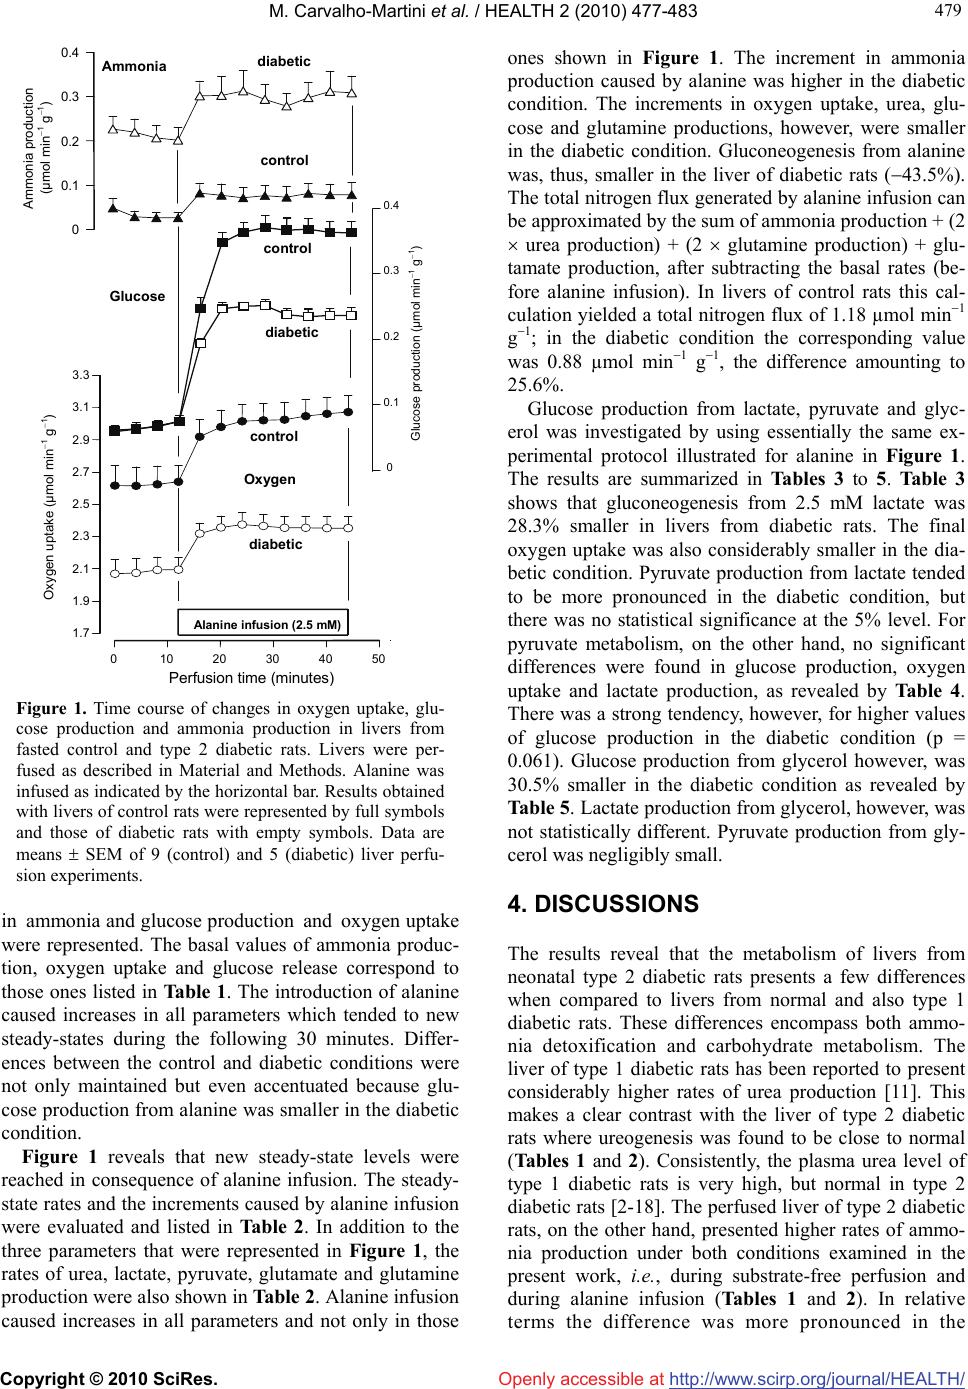 M. Carvalho-Martini et al. / HEALTH 2 (2010) 477-483 Copyright © 2010 SciRes. http://www.scirp.org/journal/HEALTH/ 479 479 Openly accessible at 0 0.1 0.2 0.3 0.4 Ammonia production (µmol min 1 g 1 ) Ammonia diabetic control 0 0.1 0.2 0.3 0.4 Glucose production (µmol min1 g1) Glucose control diabetic 1.7 1.9 2.1 2.3 2.5 2.7 2.9 3.1 3.3 Oxygen uptake (µmol min 1 g 1 ) 0 10 20 30 40 50 Perfusion time ( minutes ) Alanine infusion (2.5 mM) Oxygen control diabetic Figure 1. Time course of changes in oxygen uptake, glu- cose production and ammonia production in livers from fasted control and type 2 diabetic rats. Livers were per- fused as described in Material and Methods. Alanine was infused as indicated by the horizontal bar. Results obtained with livers of control rats were represented by full symbols and those of diabetic rats with empty symbols. Data are means SEM of 9 (control) and 5 (diabetic) liver perfu- sion experiments. in ammonia and glucose production and oxygen uptake were represented. The basal values of ammonia produc- tion, oxygen uptake and glucose release correspond to those ones listed in Table 1. The introduction of alanine caused increases in all parameters which tended to new steady-states during the following 30 minutes. Differ- ences between the control and diabetic conditions were not only maintained but even accentuated because glu- cose production from alanine was smaller in the diabetic condition. Figure 1 reveals that new steady-state levels were reached in consequence of alanine infusion. The steady- state rates and the increments caused by alanine infusion were evaluated and listed in Table 2. In addition to the three parameters that were represented in Figure 1, the rates of urea, lactate, pyruvate, glutamate and glutamine production were also shown in Table 2. Alanine infusion caused increases in all parameters and not only in those ones shown in Figure 1. The increment in ammonia production caused by alanine was higher in the diabetic condition. The increments in oxygen uptake, urea, glu- cose and glutamine productions, however, were smaller in the diabetic condition. Gluconeogenesis from alanine was, thus, smaller in the liver of diabetic rats (43.5%). The total nitrogen flux generated by alanine infusion can be approximated by the sum of ammonia production + (2 urea production) + (2 glutamine production) + glu- tamate production, after subtracting the basal rates (be- fore alanine infusion). In livers of control rats this cal- culation yielded a total nitrogen flux of 1.18 µmol min1 g1; in the diabetic condition the corresponding value was 0.88 µmol min1 g 1, the difference amounting to 25.6%. Glucose production from lactate, pyruvate and glyc- erol was investigated by using essentially the same ex- perimental protocol illustrated for alanine in Figure 1. The results are summarized in Tables 3 to 5. Table 3 shows that gluconeogenesis from 2.5 mM lactate was 28.3% smaller in livers from diabetic rats. The final oxygen uptake was also considerably smaller in the dia- betic condition. Pyruvate production from lactate tended to be more pronounced in the diabetic condition, but there was no statistical significance at the 5% level. For pyruvate metabolism, on the other hand, no significant differences were found in glucose production, oxygen uptake and lactate production, as revealed by Table 4. There was a strong tendency, however, for higher values of glucose production in the diabetic condition (p = 0.061). Glucose production from glycerol however, was 30.5% smaller in the diabetic condition as revealed by Table 5. Lactate production from glycerol, however, was not statistically different. Pyruvate production from gly- cerol was negligibly small. 4. DISCUSSIONS The results reveal that the metabolism of livers from neonatal type 2 diabetic rats presents a few differences when compared to livers from normal and also type 1 diabetic rats. These differences encompass both ammo- nia detoxification and carbohydrate metabolism. The liver of type 1 diabetic rats has been reported to present considerably higher rates of urea production [11]. This makes a clear contrast with the liver of type 2 diabetic rats where ureogenesis was found to be close to normal (Tables 1 and 2). Consistently, the plasma urea level of type 1 diabetic rats is very high, but normal in type 2 diabetic rats [2-18]. The perfused liver of type 2 diabetic rats, on the other hand, presented higher rates of ammo- nia production under both conditions examined in the present work, i.e., during substrate-free perfusion and during alanine infusion (Tables 1 and 2). In relative terms the difference was more pronounced in the 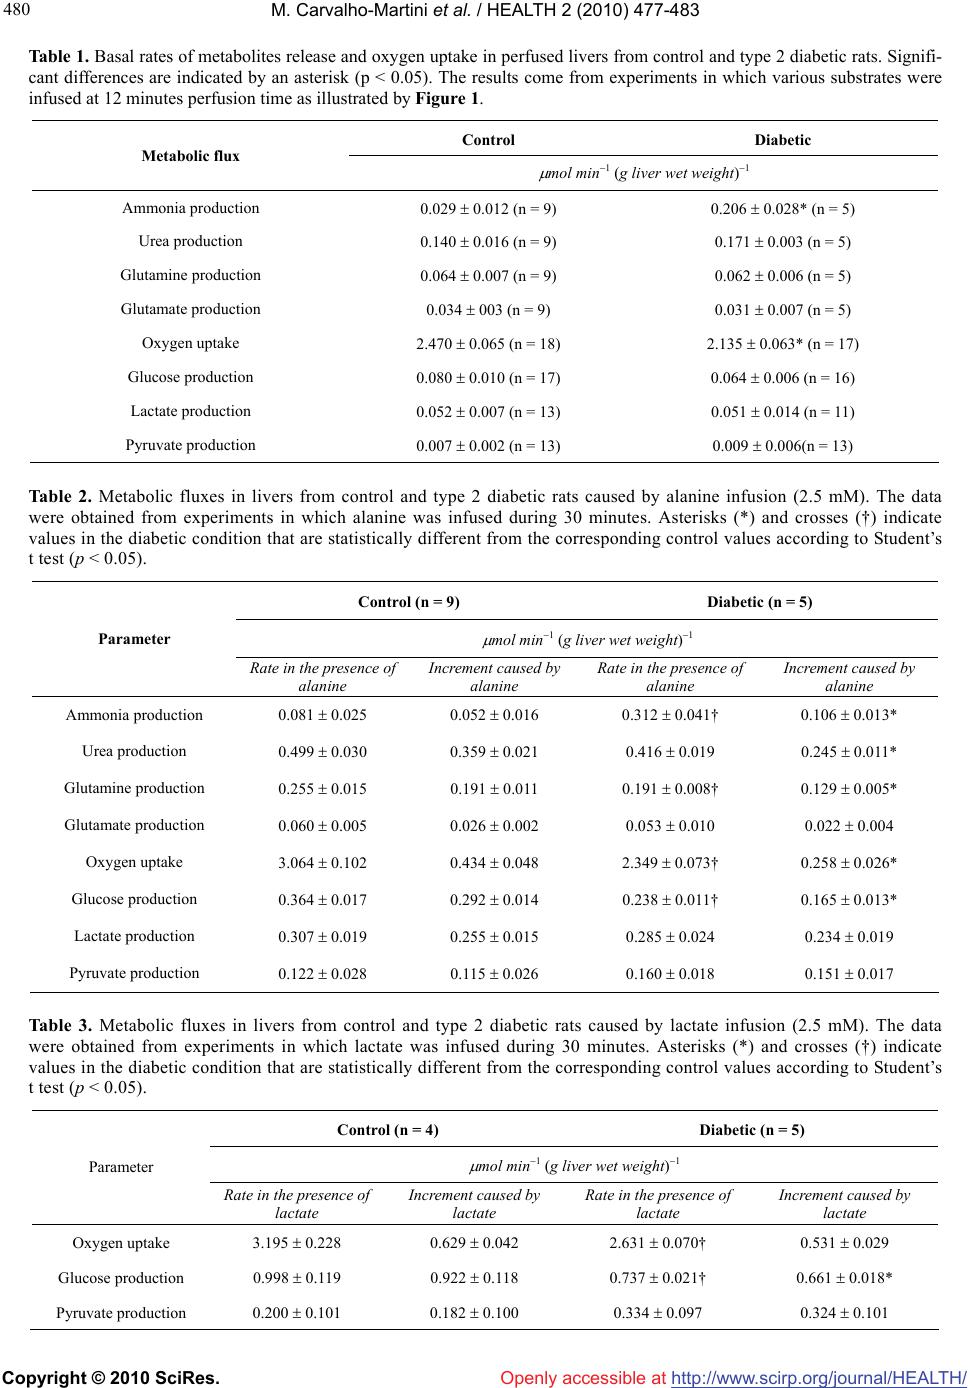 M. Carvalho-Martini et al. / HEALTH 2 (2010) 477-483 Copyright © 2010 SciRes. http://www.scirp.org/journal/HEALTH/Openly accessible at 480 Table 1. Basal rates of metabolites release and oxygen uptake in perfused livers from control and type 2 diabetic rats. Signifi- cant differences are indicated by an asterisk (p < 0.05). The results come from experiments in which various substrates were infused at 12 minutes perfusion time as illustrated by Figure 1. Control Diabetic Metabolic flux mol min1 (g liver wet weight)1 Ammonia production 0.029 0.012 (n = 9) 0.206 0.028* (n = 5) Urea production 0.140 0.016 (n = 9) 0.171 0.003 (n = 5) Glutamine production 0.064 0.007 (n = 9) 0.062 0.006 (n = 5) Glutamate production 0.034 003 (n = 9) 0.031 0.007 (n = 5) Oxygen uptake 2.470 0.065 (n = 18) 2.135 0.063* (n = 17) Glucose production 0.080 0.010 (n = 17) 0.064 0.006 (n = 16) Lactate production 0.052 0.007 (n = 13) 0.051 0.014 (n = 11) Pyruvate production 0.007 0.002 (n = 13) 0.009 0.006(n = 13) Table 2. Metabolic fluxes in livers from control and type 2 diabetic rats caused by alanine infusion (2.5 mM). The data were obtained from experiments in which alanine was infused during 30 minutes. Asterisks (*) and crosses (†) indicate values in the diabetic condition that are statistically different from the corresponding control values according to Student’s t test (p < 0.05). Control (n = 9) Diabetic (n = 5) mol min1 (g liver wet weight)1 Parameter Rate in the presence of alanine Increment caused by alanine Rate in the presence of alanine Increment caused by alanine Ammonia production 0.081 0.025 0.052 0.016 0.312 0.041† 0.106 0.013* Urea production 0.499 0.030 0.359 0.021 0.416 0.019 0.245 0.011* Glutamine production 0.255 0.015 0.191 0.011 0.191 0.008† 0.129 0.005* Glutamate production 0.060 0.005 0.026 0.002 0.053 0.010 0.022 0.004 Oxygen uptake 3.064 0.102 0.434 0.048 2.349 0.073† 0.258 0.026* Glucose production 0.364 0.017 0.292 0.014 0.238 0.011† 0.165 0.013* Lactate production 0.307 0.019 0.255 0.015 0.285 0.024 0.234 0.019 Pyruvate production 0.122 0.028 0.115 0.026 0.160 0.018 0.151 0.017 Table 3. Metabolic fluxes in livers from control and type 2 diabetic rats caused by lactate infusion (2.5 mM). The data were obtained from experiments in which lactate was infused during 30 minutes. Asterisks (*) and crosses (†) indicate values in the diabetic condition that are statistically different from the corresponding control values according to Student’s t test (p < 0.05). Control (n = 4) Diabetic (n = 5) mol min1 (g liver wet weight)1 Parameter Rate in the presence of lactate Increment caused by lactate Rate in the presence of lactate Increment caused by lactate Oxygen uptake 3.195 0.228 0.629 0.042 2.631 0.070† 0.531 0.029 Glucose production 0.998 0.119 0.922 0.118 0.737 0.021† 0.661 0.018* Pyruvate production 0.200 0.101 0.182 0.100 0.334 0.097 0.324 0.101 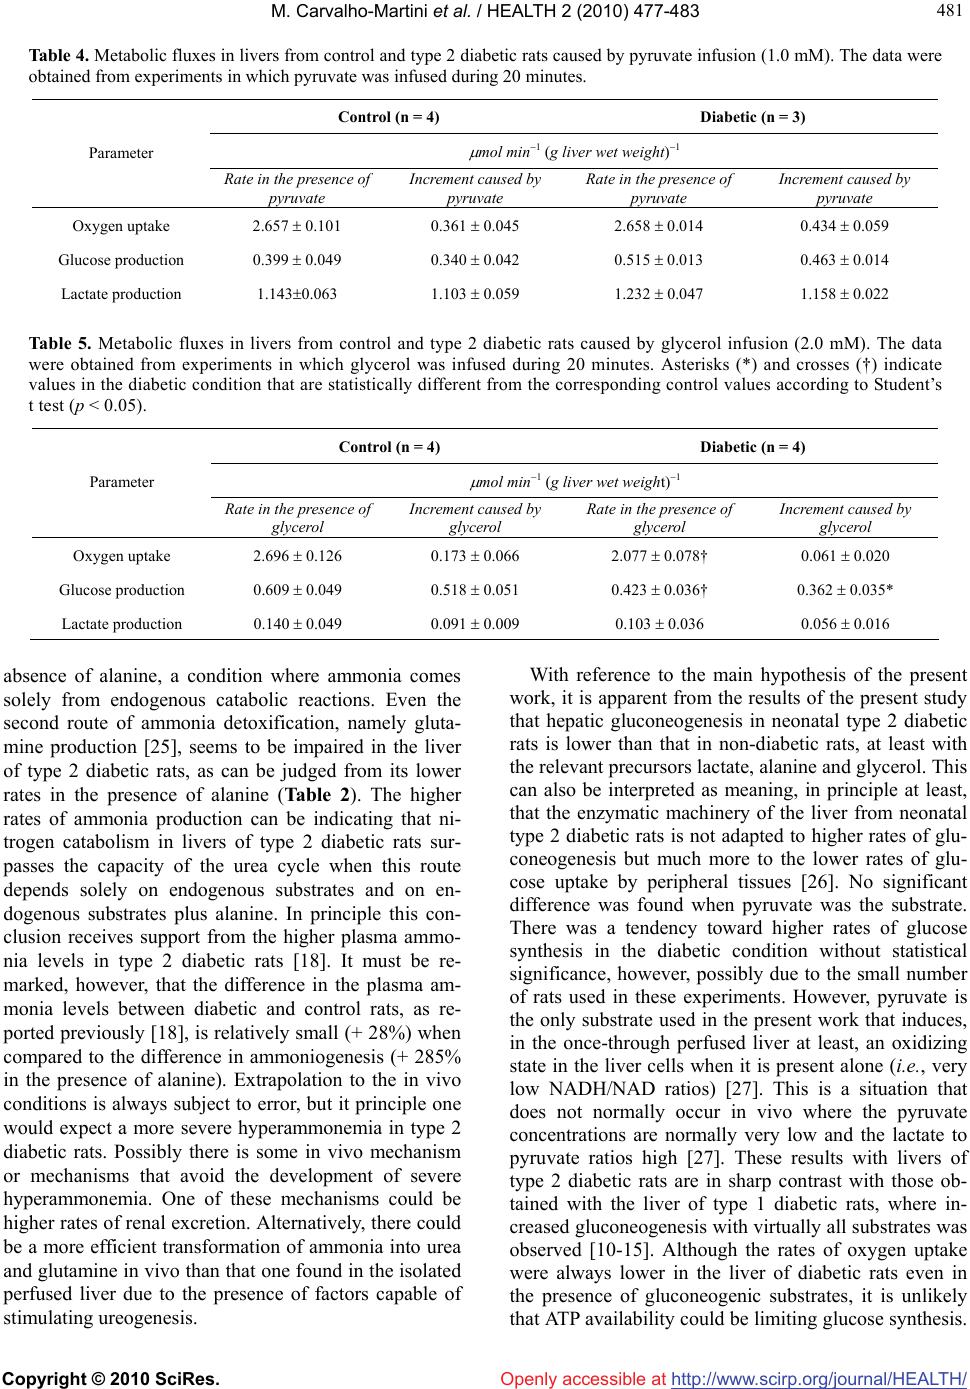 M. Carvalho-Martini et al. / HEALTH 2 (2010) 477-483 Copyright © 2010 SciRes. http://www.scirp.org/journal/HEALTH/Openly accessible at 481 481 Table 4. Metabolic fluxes in livers from control and type 2 diabetic rats caused by pyruvate infusion (1.0 mM). The data were obtained from experiments in which pyruvate was infused during 20 minutes. Control (n = 4) Diabetic (n = 3) mol min1 (g liver wet weight)1 Parameter Rate in the presence of pyruvate Increment caused by pyruvate Rate in the presence of pyruvate Increment caused by pyruvate Oxygen uptake 2.657 0.101 0.361 0.045 2.658 0.014 0.434 0.059 Glucose production 0.399 0.049 0.340 0.042 0.515 0.013 0.463 0.014 Lactate production 1.1430.063 1.103 0.059 1.232 0.047 1.158 0.022 Table 5. Metabolic fluxes in livers from control and type 2 diabetic rats caused by glycerol infusion (2.0 mM). The data were obtained from experiments in which glycerol was infused during 20 minutes. Asterisks (*) and crosses (†) indicate values in the diabetic condition that are statistically different from the corresponding control values according to Student’s t test (p < 0.05). Control (n = 4) Diabetic (n = 4) mol min1 (g liver wet weight)1 Parameter Rate in the presence of glycerol Increment caused by glycerol Rate in the presence of glycerol Increment caused by glycerol Oxygen uptake 2.696 0.126 0.173 0.066 2.077 0.078† 0.061 0.020 Glucose production 0.609 0.049 0.518 0.051 0.423 0.036† 0.362 0.035* Lactate production 0.140 0.049 0.091 0.009 0.103 0.036 0.056 0.016 absence of alanine, a condition where ammonia comes solely from endogenous catabolic reactions. Even the second route of ammonia detoxification, namely gluta- mine production [25], seems to be impaired in the liver of type 2 diabetic rats, as can be judged from its lower rates in the presence of alanine (Table 2). The higher rates of ammonia production can be indicating that ni- trogen catabolism in livers of type 2 diabetic rats sur- passes the capacity of the urea cycle when this route depends solely on endogenous substrates and on en- dogenous substrates plus alanine. In principle this con- clusion receives support from the higher plasma ammo- nia levels in type 2 diabetic rats [18]. It must be re- marked, however, that the difference in the plasma am- monia levels between diabetic and control rats, as re- ported previously [18], is relatively small (+ 28%) when compared to the difference in ammoniogenesis (+ 285% in the presence of alanine). Extrapolation to the in vivo conditions is always subject to error, but it principle one would expect a more severe hyperammonemia in type 2 diabetic rats. Possibly there is some in vivo mechanism or mechanisms that avoid the development of severe hyperammonemia. One of these mechanisms could be higher rates of renal excretion. Alternatively, there could be a more efficient transformation of ammonia into urea and glutamine in vivo than that one found in the isolated perfused liver due to the presence of factors capable of stimulating ureogenesis. With reference to the main hypothesis of the present work, it is apparent from the results of the present study that hepatic gluconeogenesis in neonatal type 2 diabetic rats is lower than that in non-diabetic rats, at least with the relevant precursors lactate, alanine and glycerol. This can also be interpreted as meaning, in principle at least, that the enzymatic machinery of the liver from neonatal type 2 diabetic rats is not adapted to higher rates of glu- coneogenesis but much more to the lower rates of glu- cose uptake by peripheral tissues [26]. No significant difference was found when pyruvate was the substrate. There was a tendency toward higher rates of glucose synthesis in the diabetic condition without statistical significance, however, possibly due to the small number of rats used in these experiments. However, pyruvate is the only substrate used in the present work that induces, in the once-through perfused liver at least, an oxidizing state in the liver cells when it is present alone (i.e., very low NADH/NAD ratios) [27]. This is a situation that does not normally occur in vivo where the pyruvate concentrations are normally very low and the lactate to pyruvate ratios high [27]. These results with livers of type 2 diabetic rats are in sharp contrast with those ob- tained with the liver of type 1 diabetic rats, where in- creased gluconeogenesis with virtually all substrates was observed [10-15]. Although the rates of oxygen uptake were always lower in the liver of diabetic rats even in the presence of gluconeogenic substrates, it is unlikely that ATP availability could be limiting glucose synthesis. 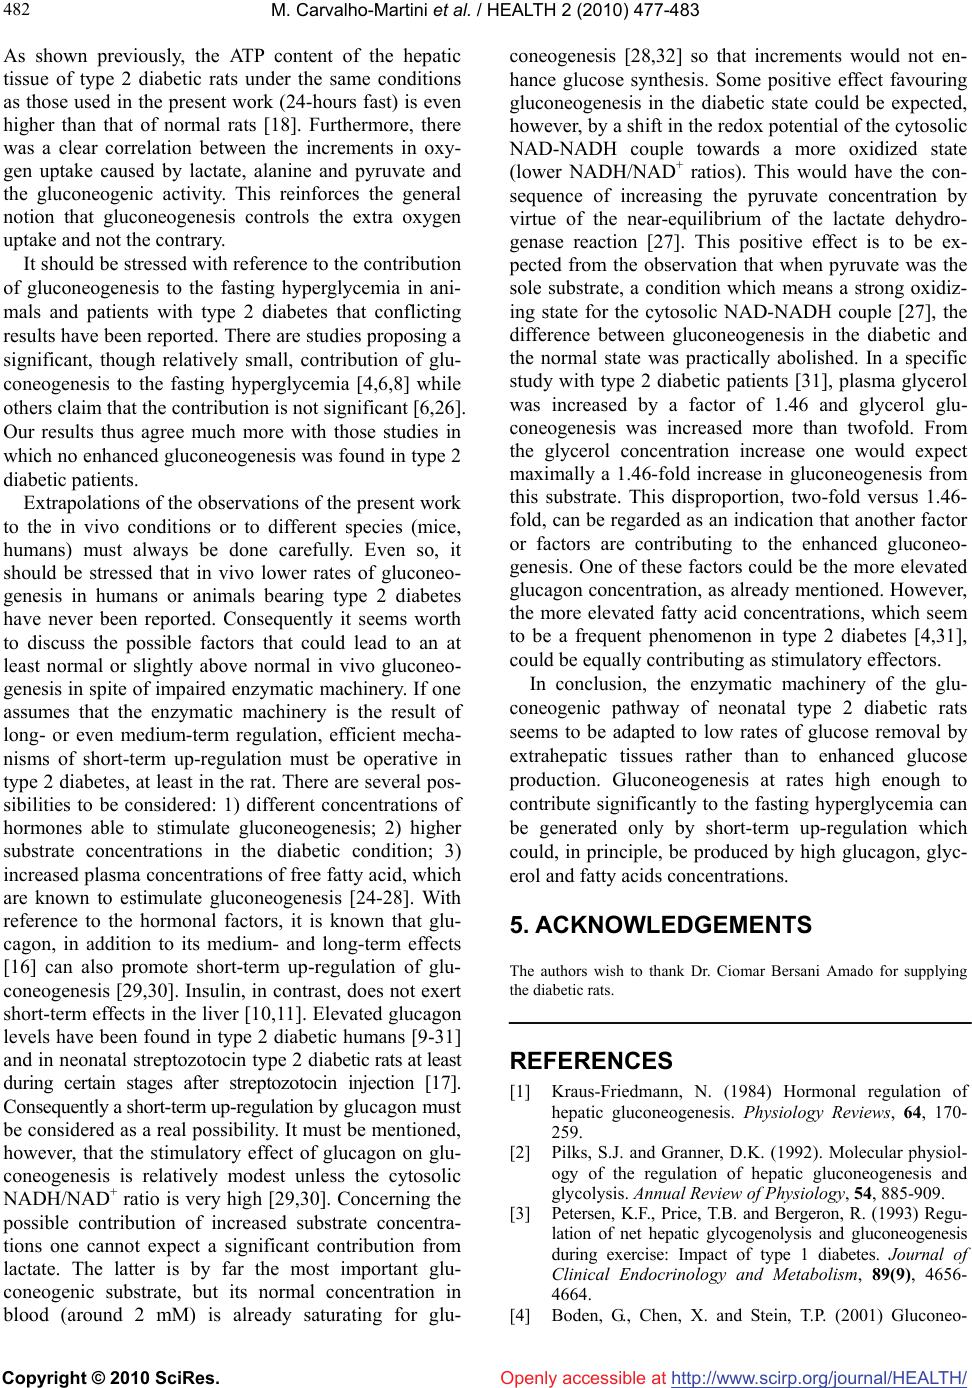 M. Carvalho-Martini et al. / HEALTH 2 (2010) 477-483 Copyright © 2010 SciRes. http://www.scirp.org/journal/HEALTH/ 482 Openly accessible at As shown previously, the ATP content of the hepatic tissue of type 2 diabetic rats under the same conditions as those used in the present work (24-hours fast) is even higher than that of normal rats [18]. Furthermore, there was a clear correlation between the increments in oxy- gen uptake caused by lactate, alanine and pyruvate and the gluconeogenic activity. This reinforces the general notion that gluconeogenesis controls the extra oxygen uptake and not the contrary. It should be stressed with reference to the contribution of gluconeogenesis to the fasting hyperglycemia in ani- mals and patients with type 2 diabetes that conflicting results have been reported. There are studies proposing a significant, though relatively small, contribution of glu- coneogenesis to the fasting hyperglycemia [4,6,8] while others claim that the contribution is not significant [6,26]. Our results thus agree much more with those studies in which no enhanced gluconeogenesis was found in type 2 diabetic patients. Extrapolations of the observations of the present work to the in vivo conditions or to different species (mice, humans) must always be done carefully. Even so, it should be stressed that in vivo lower rates of gluconeo- genesis in humans or animals bearing type 2 diabetes have never been reported. Consequently it seems worth to discuss the possible factors that could lead to an at least normal or slightly above normal in vivo gluconeo- genesis in spite of impaired enzymatic machinery. If one assumes that the enzymatic machinery is the result of long- or even medium-term regulation, efficient mecha- nisms of short-term up-regulation must be operative in type 2 diabetes, at least in the rat. There are several pos- sibilities to be considered: 1) different concentrations of hormones able to stimulate gluconeogenesis; 2) higher substrate concentrations in the diabetic condition; 3) increased plasma concentrations of free fatty acid, which are known to estimulate gluconeogenesis [24-28]. With reference to the hormonal factors, it is known that glu- cagon, in addition to its medium- and long-term effects [16] can also promote short-term up-regulation of glu- coneogenesis [29,30]. Insulin, in contrast, does not exert short-term effects in the liver [10,11]. Elevated glucagon levels have been found in type 2 diabetic humans [9-31] and in neonatal streptozotocin type 2 diabetic rats at least during certain stages after streptozotocin injection [17]. Consequently a short-term up-regulation by glucagon must be considered as a real possibility. It must be mentioned, however, that the stimulatory effect of glucagon on glu- coneogenesis is relatively modest unless the cytosolic NADH/NAD+ ratio is very high [29,30]. Concerning the possible contribution of increased substrate concentra- tions one cannot expect a significant contribution from lactate. The latter is by far the most important glu- coneogenic substrate, but its normal concentration in blood (around 2 mM) is already saturating for glu- coneogenesis [28,32] so that increments would not en- hance glucose synthesis. Some positive effect favouring gluconeogenesis in the diabetic state could be expected, however, by a shift in the redox potential of the cytosolic NAD-NADH couple towards a more oxidized state (lower NADH/NAD+ ratios). This would have the con- sequence of increasing the pyruvate concentration by virtue of the near-equilibrium of the lactate dehydro- genase reaction [27]. This positive effect is to be ex- pected from the observation that when pyruvate was the sole substrate, a condition which means a strong oxidiz- ing state for the cytosolic NAD-NADH couple [27], the difference between gluconeogenesis in the diabetic and the normal state was practically abolished. In a specific study with type 2 diabetic patients [31], plasma glycerol was increased by a factor of 1.46 and glycerol glu- coneogenesis was increased more than twofold. From the glycerol concentration increase one would expect maximally a 1.46-fold increase in gluconeogenesis from this substrate. This disproportion, two-fold versus 1.46- fold, can be regarded as an indication that another factor or factors are contributing to the enhanced gluconeo- genesis. One of these factors could be the more elevated glucagon concentration, as already mentioned. However, the more elevated fatty acid concentrations, which seem to be a frequent phenomenon in type 2 diabetes [4,31], could be equally contributing as stimulatory effectors. In conclusion, the enzymatic machinery of the glu- coneogenic pathway of neonatal type 2 diabetic rats seems to be adapted to low rates of glucose removal by extrahepatic tissues rather than to enhanced glucose production. Gluconeogenesis at rates high enough to contribute significantly to the fasting hyperglycemia can be generated only by short-term up-regulation which could, in principle, be produced by high glucagon, glyc- erol and fatty acids concentrations. 5. ACKNOWLEDGEMENTS The authors wish to thank Dr. Ciomar Bersani Amado for supplying the diabetic rats. REFERENCES [1] Kraus-Friedmann, N. (1984) Hormonal regulation of hepatic gluconeogenesis. Physiology Reviews, 64, 170- 259. [2] Pilks, S.J. and Granner, D.K. (1992). Molecular physiol- ogy of the regulation of hepatic gluconeogenesis and glycolysis. Annual Review of Physiology, 54, 885-909. [3] Petersen, K.F., Price, T.B. and Bergeron, R. (1993) Regu- lation of net hepatic glycogenolysis and gluconeogenesis during exercise: Impact of type 1 diabetes. Journal of Clinical Endocrinology and Metabolism, 89(9), 4656- 4664. [4] Boden, G., Chen, X. and Stein, T.P. (2001) Gluconeo-  M. Carvalho-Martini et al. / HEALTH 2 (2010) 477-483 Copyright © 2010 SciRes. http://www.scirp.org/journal/HEALTH/Openly accessible at 483 483 genesis in moderately and severely hyperglycemic pa- tients with type 2 diabetes mellitus. American Journal of Physiology, Endocrinology and Metabolism, 280(1), E23-E30. [5] Diraison, F., Large, V., Brunengraber, H. and Beylot, M. (1998) Non-invasive tracing of liver intermediary me- tabolism in normal subjects and in moderately hyper- glycaemic NIDDM subjects: Evidence against increased gluconeogenesis and hepatic fatty acid oxidation in NIDDM. Diabetologia, 41, 212-220. [6] Andrikopoulos, S. and Proietto, J. (1995) The biochemi- cal basis of increased hepatic glucose production in a mouse model of type 2 (non-insulin-dependent) diabetes mellitus. Diabetologia, 38, 1389-1396. [7] Puhakainen, I., Koivisto, V.A. and Yki-Jarvinen, H. (1992) Lipolysis and gluconeogenesis from glycerol are increased in patients with noninsulin-dependent diabetes mellitus. Journal of Clinical Endocrinology and Metabo- lism, 75, 789-794. [8] Magnusson, I., Rothman, D.L., Katz, L.D., Shulman, R.G. and Shulman, G.I. (1992) Increased rate of gluconeo- genesis in type II diabetes mellitus. Journal of Clinical Investigation, 90(4), 1323-1327. [9] Basu, R., Schwenk, W.F. and Rizza, R.A. (2004) Both fasting glucose production and disappearance are abnor- mal in people with “mild” and “severe” type 2 diabetes. American Journal of Physiology-Endocrinology and Me- tabolism, 287(1), E55-E62. [10] Söling, H.D., Koschel, R., Dragert, W., Kneer, P. and Creutzfeldt, W. (1966) The effect of insulin on the me- tabolism of isolated perfused livers of normal and al- loxan-diabetic rats. I. The metabolism of isolated perfused livers in normal and alloxan-diabetic rats under various experimental conditions. Diabetologia, 2(1), 20- 31. [11] Rudorff, K.H., Albrecht, G. and Staib, W. (1970) Über den Einflu von Insulin und Proinsulin auf die Gluco- neogenese aus alanin in der isoliert perfundierten leber normaler und alloxandiabetischer ratten. Hoppe-Seyler’s Zeitschrift für Physiologische Chemie, 351, 975-982. [12] Cook, D.E. (1978) The effects of phenformin in nor- mal vs. diabetic isolated perfused rat liver. Research Communications in Chemical Pathology and Pharma- cology, 22, 119-134. [13] Wagle, S.R., Ingebretsen, W.R. and Sampson, L. (1975) Studies on gluconeogenesis and stimulation of glycogen and protein synthesis in isolated hepatocytes in alloxan diabetic, normal fed and fasted animals. Acta Diabe- tologica Latina, 12, 185-198. [14] Lombardo, Y.B., Hron, W.T. and Menahan, L.A. (1978) Effect of insulin in vitro on the isolated, perfused al- loxan-diabetic rat liver. Diabetologia, 14(1), 47-51. [15] Akimoto, L.S., Pedrinho, S.R., Lopes, G. and Bazotte, R.B. (2000) Rates of gluconeogenesis in perfused liver of alloxan-diabetic fed rats. Research Communications in Molecular Pathology and Pharmacology, 107(1-2), 65- 77. [16] Barthel, A. and Schmoll, D. (2003) Novel concepts in insulin regulation of hepatic gluconeogenesis. American Journal of Physiology, Endocrinology and Metabolism, 285(4), E685-E692. [17] Arulmozhi, D.K., Veeranjaneyulu, A. and Bodhankar, S.L. (2004) Neonatal streptozotocin-induced rat model of type 2 diabetes mellitus: A glance. Indian Journal of Pharmacology, 36(4), 217-221. [18] Oliveira, D.S., Bersani-Amado, C.A., Martini, M.C., Suzuki-Kemmelmeier, F. and Bracht, A. (2007) Glycogen levels and energy status of the liver of fasting rats with diabetes types 1 and 2. Brazilian Archives of Biology and Technology, 50(5), 785-791. [19] Portha, B., Levacher, C., Picon, L. and Rosselin, G. (1974) Diabetogenic effect of streptozotocin in the rat during the perinatal period. Diabetes, 23(11), 889-895. [20] Cuman, R.K.N., Bersani-Amado, C. and Fortes, Z.B. (2001) Influence of type 2 diabetes upon the inflammatory response in rats. Inflammation, 50(9), 460-465. [21] Scholz, R. and Bücher, T. (1965) Hemoglobin-free perfu- sion of rat liver. In: Changce, B., Estabrook, W. and Wil- liamson, J.R., Eds., Control of Energy Metabolism, Aca- demic Press, New York, 393-414. [22] Bracht, A., Ishii-Iwamoto, E.L. and Kelmer-Bracht, A.M. (2003) O estudo do metabolismo no fígado em perfusão. In: Bracht, A. and Ishii-Iwamoto, E.L. Eds., Métodos de Laboratório em Bioquímica, Editora Manole, São Paulo, 275-289. [23] Bergmeyer, H.U. (1974) Methods of Enzymatic Analysis, Verlag Chemie-Academic Press, Weinheim-London. [24] Bazotte, R.B., Constantin, J., Hell, N.S. and Bracht, A. (1990) Hepatic metabolism of meal-fed rats: Studies in vivo and in the isolated perfused liver. Physiology and Behavior, 48(2), 247-253. [25] Häussinger, D., Gerok, W. and Sies, S. (1983) Regulation of flux through glutaminase and glutamine synthetase in isolated perfused rat liver. Biochimica et Biophysica Acta, 755(2), 272-278. [26] Beck-Nielsen, H., Hother-Nielsen, O. and Staehr, P. (2002) Is hepatic glucose production increased in type 2 diabetes mellitus? Current Diabetes Reports, 2, 231-236. [27] Sies, H. (1982) Nicotinamide nucleotide compartmentation. In: Sies, H., Ed., Metabolic Compartmentation. Aca- demic Press, New York, 205-231. [28] Veiga, R.P., Silva, M.H., Teodoro, G.R., Yamamoto, N.S., Constantin, J. and Bracht, A. (2008) Metabolic fluxes in the liver of rats bearing the walker 256 tumor: Influence of the circulating levels of substrates and fatty acids. Cell Biochemistry and Function, 26(1), 51-63. [29] Constantin, J., Ishii-Iwamoto, E.L., Suzuki Kemmelmeie, F. and Bracht, A. (1994) Zonation of the action of gluca- gon on gluconeogenesis studied in the bivascularly per- fused rat liver. FEBS Letters, 352(1), 24-26. [30] Marques da Silva, A.C., D’Ávila, R.B., Ferrari, A.G., Kelmer-Bracht, A.M., Constantin, J. and Bracht, A. (1997) Ca2+-dependence of gluconeogenesis stimulation by glucagon at different cytosolic NAD+-NADH redox potentials. Brazilian Journal of Medical and Biological Research, 30(7), 827-836. [31] Nurjhan, N., Conoli, A. and Gerich, J. (1992) Increased lipolysis and its consequences on gluconeogenesis in non- insulin-dependent diabetes mellitus. Journal of Clinical Investigation, 89(1), 169-175. [32] Argilés, J.M. and López-Soriano, F.J. (1991) The energy state of tumorbearing rats. Journal of Biological Chemis- try, 266, 2978-2982. |