

Paper Menu >>
Journal Menu >>
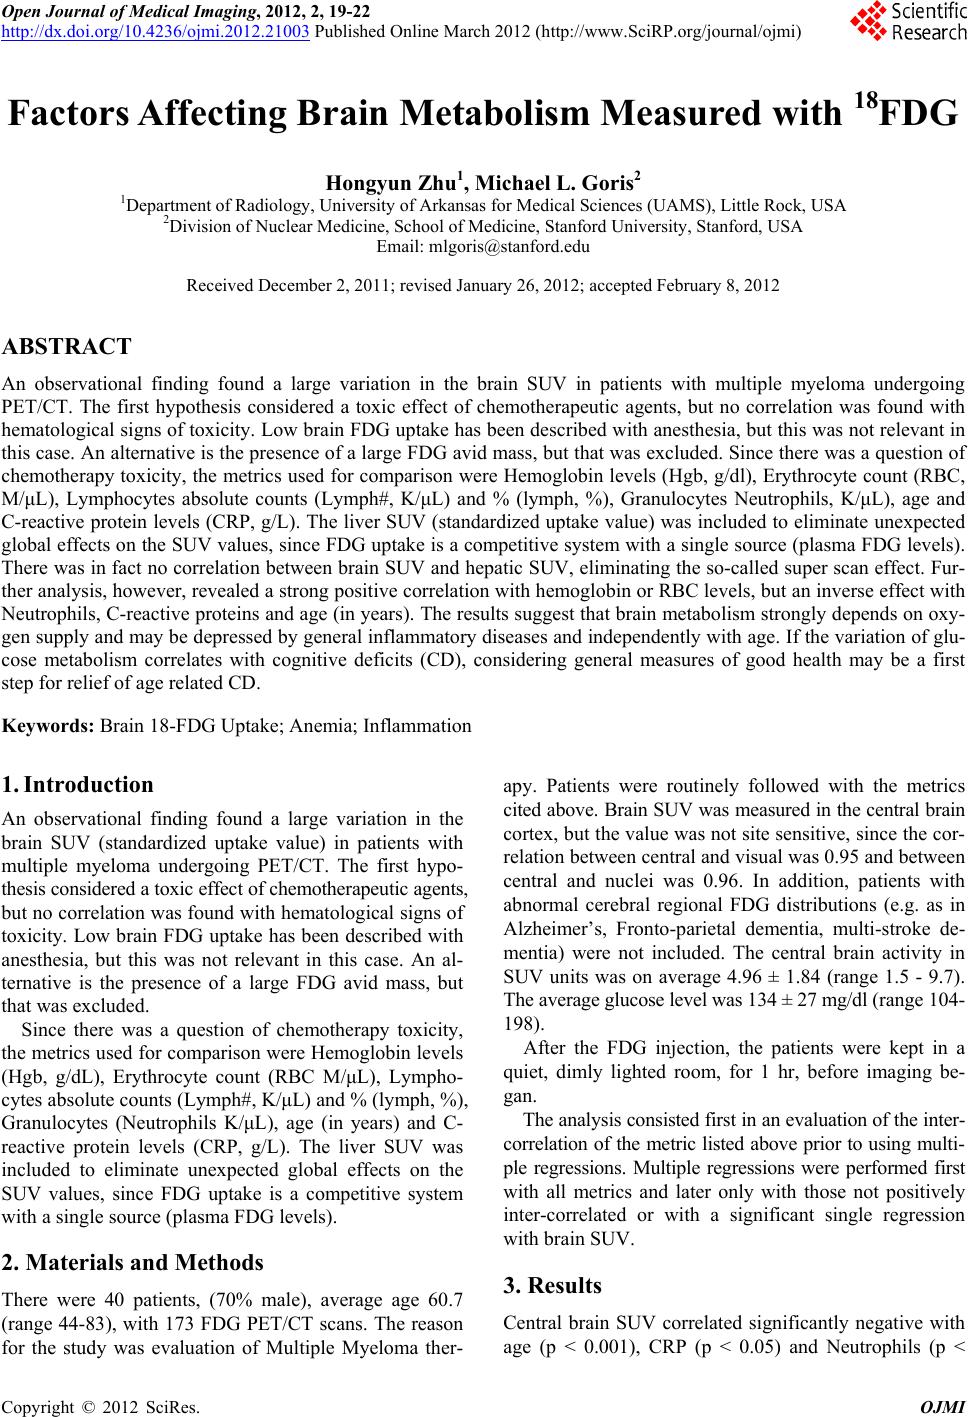 Open Journal of Medical Imaging, 2012, 2, 19-22 http://dx.doi.org/10.4236/ojmi.2012.21003 Published Online March 2012 (http://www.SciRP.org/journal/ojmi) Factors Affecting Brain Metabolism Measured with 18FDG Hongyun Zhu1, Michael L. Goris2 1Department of Radiology, University of Arkansas for Medical Sciences (UAMS), Little Rock, USA 2Division of Nuclear Medicine, School of Medicine, Stanford University, Stanford, USA Email: [email protected] Received December 2, 2011; revised January 26, 2012; accepted February 8, 2012 ABSTRACT An observational finding found a large variation in the brain SUV in patients with multiple myeloma undergoing PET/CT. The first hypothesis considered a toxic effect of chemotherapeutic agents, but no correlation was found with hematological signs of toxicity. Low brain FDG uptake has been described with anesthesia, but this was not relevant in this case. An alternative is the presence of a large FDG avid mass, but that was excluded. Since there was a question of chemotherapy toxicity, the metrics used for comparison were Hemoglobin levels (Hgb, g/dl), Erythrocyte count (RBC, M/μL), Lymphocytes absolute counts (Lymph#, K/μL) and % (lymph, %), Granulocytes Neutrophils, K/μL), age and C-reactive protein levels (CRP, g/L). The liver SUV (standardized uptake value) was included to eliminate unexpected global effects on the SUV values, since FDG uptake is a competitive system with a single source (plasma FDG levels). There was in fact no correlation between brain SUV and hepatic SUV, eliminating the so-called super scan effect. Fur- ther analysis, however, revealed a strong positive correlation with hemoglobin or RBC levels, but an inverse effect with Neutrophils, C-reactive proteins and age (in years). The results suggest that brain metabolism strongly depends on oxy- gen supply and may be depressed by general inflammatory diseases and independently with age. If the variation of glu- cose metabolism correlates with cognitive deficits (CD), considering general measures of good health may be a first step for relief of age related CD. Keywords: Brain 18-FDG Uptake; Anemia; Inflammation 1. Introduction An observational finding found a large variation in the brain SUV (standardized uptake value) in patients with multiple myeloma undergoing PET/CT. The first hypo- thesis considered a toxic effect of chemotherapeutic agents, but no correlation was found with hematological signs of toxicity. Low brain FDG uptake has been described with anesthesia, but this was not relevant in this case. An al- ternative is the presence of a large FDG avid mass, but that was excluded. Since there was a question of chemotherapy toxicity, the metrics used for comparison were Hemoglobin levels (Hgb, g/dL), Erythrocyte count (RBC M/μL), Lympho- cytes absolute counts (Lymph#, K/μL) and % (lymph, %), Granulocytes (Neutrophils K/μL), age (in years) and C- reactive protein levels (CRP, g/L). The liver SUV was included to eliminate unexpected global effects on the SUV values, since FDG uptake is a competitive system with a single source (plasma FDG levels). 2. Materials and Methods There were 40 patients, (70% male), average age 60.7 (range 44-83), with 173 FDG PET/CT scans. The reason for the study was evaluation of Multiple Myeloma ther- apy. Patients were routinely followed with the metrics cited above. Brain SUV was measured in the central brain cortex, but the value was not site sensitive, since the cor- relation between central and visual was 0.95 and between central and nuclei was 0.96. In addition, patients with abnormal cerebral regional FDG distributions (e.g. as in Alzheimer’s, Fronto-parietal dementia, multi-stroke de- mentia) were not included. The central brain activity in SUV units was on average 4.96 ± 1.84 (range 1.5 - 9.7). The average glucose level was 134 ± 27 mg/dl (range 104- 198). After the FDG injection, the patients were kept in a quiet, dimly lighted room, for 1 hr, before imaging be- gan. The analysis consisted first in an evaluation of the inter- correlation of the metric listed above prior to using multi- ple regressions. Multiple regressions were performed first with all metrics and later only with those not positively inter-correlated or with a significant single regression with brain SUV. 3. Results Central brain SUV correlated significantly negative with age (p < 0.001), CRP (p < 0.05) and Neutrophils (p < C opyright © 2012 SciRes. OJMI 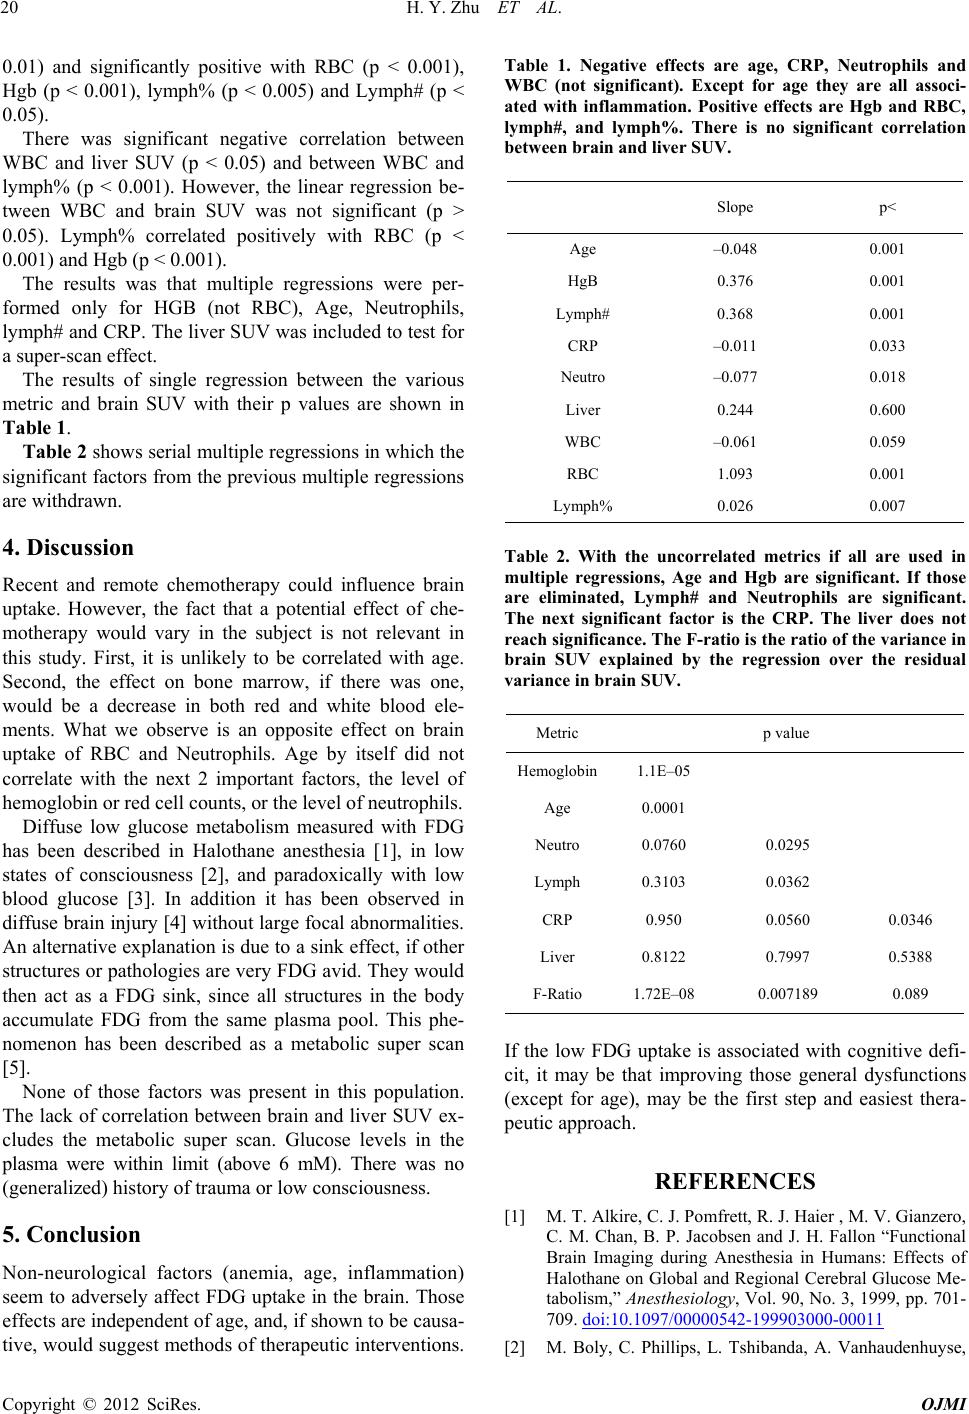 H. Y. Zhu ET AL. 20 0.01) and significantly positive with RBC (p < 0.001), Hgb (p < 0.001), lymph% (p < 0.005) and Lymph# (p < 0.05). There was significant negative correlation between WBC and liver SUV (p < 0.05) and between WBC and lymph% (p < 0.001). However, the linear regression be- tween WBC and brain SUV was not significant (p > 0.05). Lymph% correlated positively with RBC (p < 0.001) and Hgb (p < 0.001). The results was that multiple regressions were per- formed only for HGB (not RBC), Age, Neutrophils, lymph# and CRP. The liver SUV was included to test for a super-scan effect. The results of single regression between the various metric and brain SUV with their p values are shown in Table 1. Table 2 shows serial multiple regressions in which the significant factors from the previous multiple regressions are withdrawn. 4. Discussion Recent and remote chemotherapy could influence brain uptake. However, the fact that a potential effect of che- motherapy would vary in the subject is not relevant in this study. First, it is unlikely to be correlated with age. Second, the effect on bone marrow, if there was one, would be a decrease in both red and white blood ele- ments. What we observe is an opposite effect on brain uptake of RBC and Neutrophils. Age by itself did not correlate with the next 2 important factors, the level of hemoglobin or red cell counts, or the level of neutrophils. Diffuse low glucose metabolism measured with FDG has been described in Halothane anesthesia [1], in low states of consciousness [2], and paradoxically with low blood glucose [3]. In addition it has been observed in diffuse brain injury [4] without large focal abnormalities. An alternative explanation is due to a sink effect, if other structures or pathologies are very FDG avid. They would then act as a FDG sink, since all structures in the body accumulate FDG from the same plasma pool. This phe- nomenon has been described as a metabolic super scan [5]. None of those factors was present in this population. The lack of correlation between brain and liver SUV ex- cludes the metabolic super scan. Glucose levels in the plasma were within limit (above 6 mM). There was no (generalized) history of trauma or low consciousness. 5. Conclusion Non-neurological factors (anemia, age, inflammation) seem to adversely affect FDG uptake in the brain. Those effects are independent of age, and, if shown to be causa- tive, would suggest methods of therapeutic interventions. Table 1. Negative effects are age, CRP, Neutrophils and WBC (not significant). Except for age they are all associ- ated with inflammation. Positive effects are Hgb and RBC, lymph#, and lymph%. There is no significant correlation between br ain and liver SUV. Slope p< Age –0.048 0.001 HgB 0.376 0.001 Lymph# 0.368 0.001 CRP –0.011 0.033 Neutro –0.077 0.018 Liver 0.244 0.600 WBC –0.061 0.059 RBC 1.093 0.001 Lymph% 0.026 0.007 Table 2. With the uncorrelated metrics if all are used in multiple regressions, Age and Hgb are significant. If those are eliminated, Lymph# and Neutrophils are significant. The next significant factor is the CRP. The liver does not reach significance. The F-ratio is the ratio of the variance in brain SUV explained by the regression over the residual variance in brain SUV. Metric p value Hemoglobin1.1E–05 Age 0.0001 Neutro 0.0760 0.0295 Lymph 0.3103 0.0362 CRP 0.950 0.0560 0.0346 Liver 0.8122 0.7997 0.5388 F-Ratio 1.72E–08 0.007189 0.089 If the low FDG uptake is associated with cognitive defi- cit, it may be that improving those general dysfunctions (except for age), may be the first step and easiest thera- peutic approach. REFERENCES [1] M. T. Alkire, C. J. Pomfrett, R. J. Haier , M. V. Gianzero, C. M. Chan, B. P. Jacobsen and J. H. Fallon “Functional Brain Imaging during Anesthesia in Humans: Effects of Halothane on Global and Regional Cerebral Glucose Me- tabolism,” Anesthesiology, Vol. 90, No. 3, 1999, pp. 701- 709. doi:10.1097/00000542-199903000-00011 [2] M. Boly, C. Phillips, L. Tshibanda, A. Vanhaudenhuyse, Copyright © 2012 SciRes. OJMI 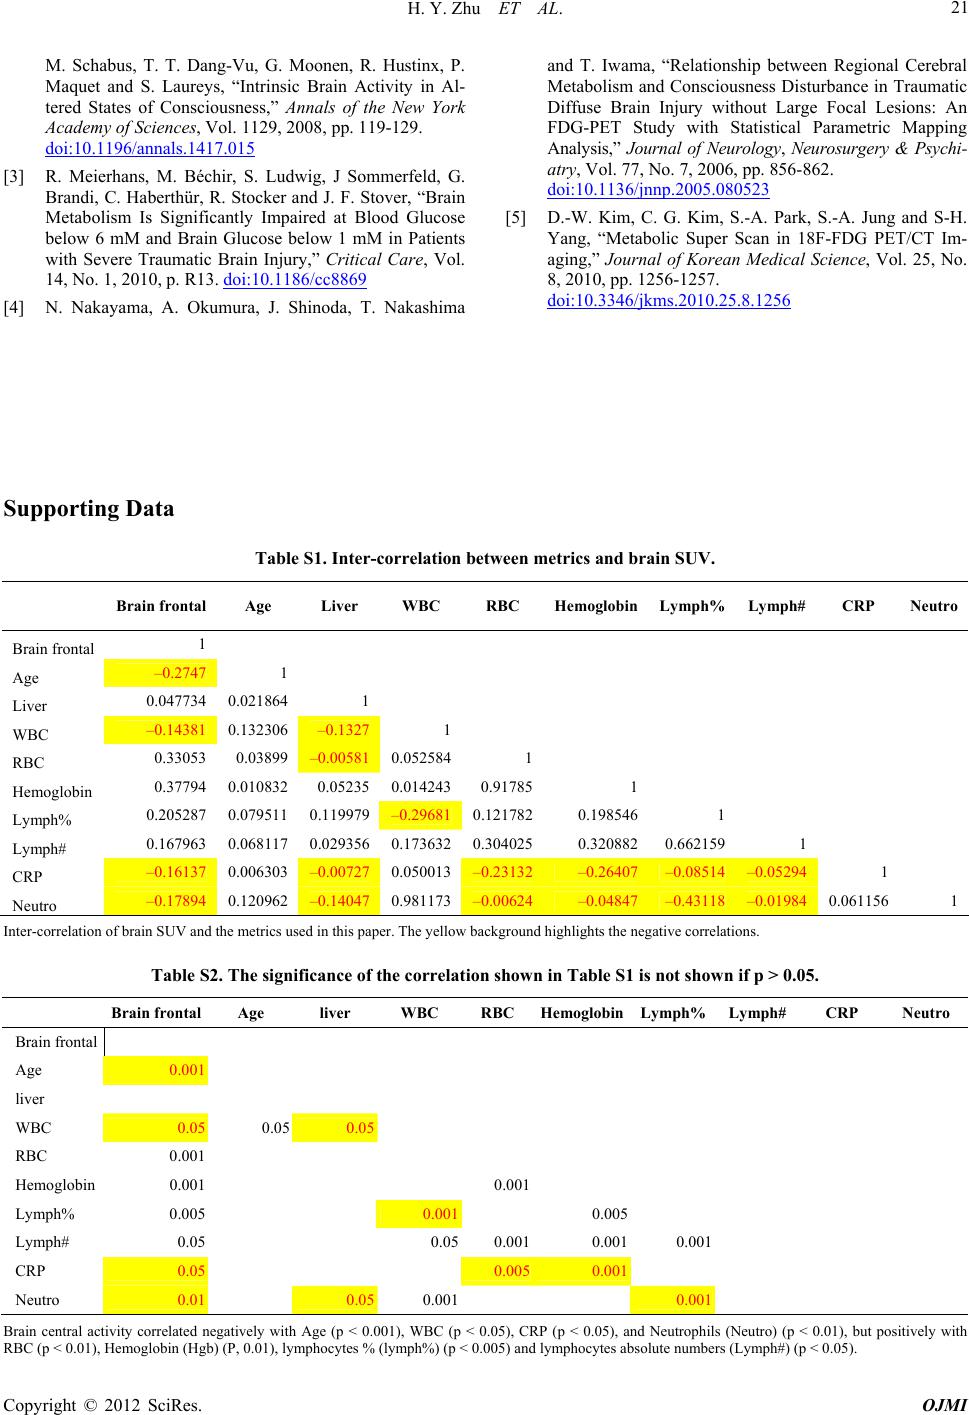 H. Y. Zhu ET AL. Copyright © 2012 SciRes. OJMI 21 M. Schabus, T. T. Dang-Vu, G. Moonen, R. Hustinx, P. Maquet and S. Laureys, “Intrinsic Brain Activity in Al- tered States of Consciousness,” Annals of the New York Academy of Sciences, Vol. 1129, 2008, pp. 119-129. doi:10.1196/annals.1417.015 [3] R. Meierhans, M. Béchir, S. Ludwig, J Sommerfeld, G. Brandi, C. Haberthür, R. Stocker and J. F. Stover, “Brain Metabolism Is Significantly Impaired at Blood Glucose below 6 mM and Brain Glucose below 1 mM in Patients with Severe Traumatic Brain Injury,” Critical Care, Vol. 14, No. 1, 2010, p. R13. doi:10.1186/cc8869 [4] N. Nakayama, A. Okumura, J. Shinoda, T. Nakashima and T. Iwama, “Relationship between Regional Cerebral Metabolism and Consciousness Disturbance in Traumatic Diffuse Brain Injury without Large Focal Lesions: An FDG-PET Study with Statistical Parametric Mapping Analysis,” Journal of Neurology, Neurosurgery & Psychi- atry, Vol. 77, No. 7, 2006, pp. 856-862. doi:10.1136/jnnp.2005.080523 [5] D.-W. Kim, C. G. Kim, S.-A. Park, S.-A. Jung and S-H. Yang, “Metabolic Super Scan in 18F-FDG PET/CT Im- aging,” Journal of Korean Medical Science, Vol. 25, No. 8, 2010, pp. 1256-1257. doi:10.3346/jkms.2010.25.8.1256 Supporting Data Table S1. Inter-corre l ation betw een metrics and brain SUV. Brain frontal Age Liver WBC RBC HemoglobinLymph%Lymph# CRP Neutro Brain frontal 1 Age –0.2747 1 Liver 0.047734 0.021864 1 WBC –0.14381 0.132306 –0.1327 1 RBC 0.33053 0.03899 –0.00581 0.0525841 Hemoglobin 0.37794 0.010832 0.05235 0.0142430.917851 Lymph% 0.205287 0.079511 0.119979 –0.296810.1217820.1985461 Lymph# 0.167963 0.068117 0.029356 0.173632 0.3040250.3208820.6621591 CRP –0.16137 0.006303 –0.00727 0.050013–0.23132–0.26407–0.08514–0.05294 1 Neutro –0.17894 0.120962 –0.14047 0.981173–0.00624–0.04847–0.43118–0.01984 0.0611561 Inter-correlation of brain SUV and the metrics used in this paper. The yellow background highlights the negative correlations. Table S2. The significance of the correlation shown in Table S1 is not shown if p > 0.05. Brain frontal Age liver WBC RBC HemoglobinLymph%Lymph# CRP Neutro Brain frontal Age 0.001 liver WBC 0.05 0.05 0.05 RBC 0.001 Hemoglobin 0.001 0.001 Lymph% 0.005 0.0010.005 Lymph# 0.05 0.050.0010.0010.001 CRP 0.05 0.005 0.001 Neutro 0.01 0.05 0.0010.001 Brain central activity correlated negatively with Age (p < 0.001), WBC (p < 0.05), CRP (p < 0.05), and Neutrophils (Neutro) (p < 0.01), but positively with RBC (p < 0.01), Hemoglobin (Hgb) (P, 0.01), lymphocytes % (lymph%) (p < 0.005) and lymphocytes absolute numbers (Lymph#) (p < 0.05). 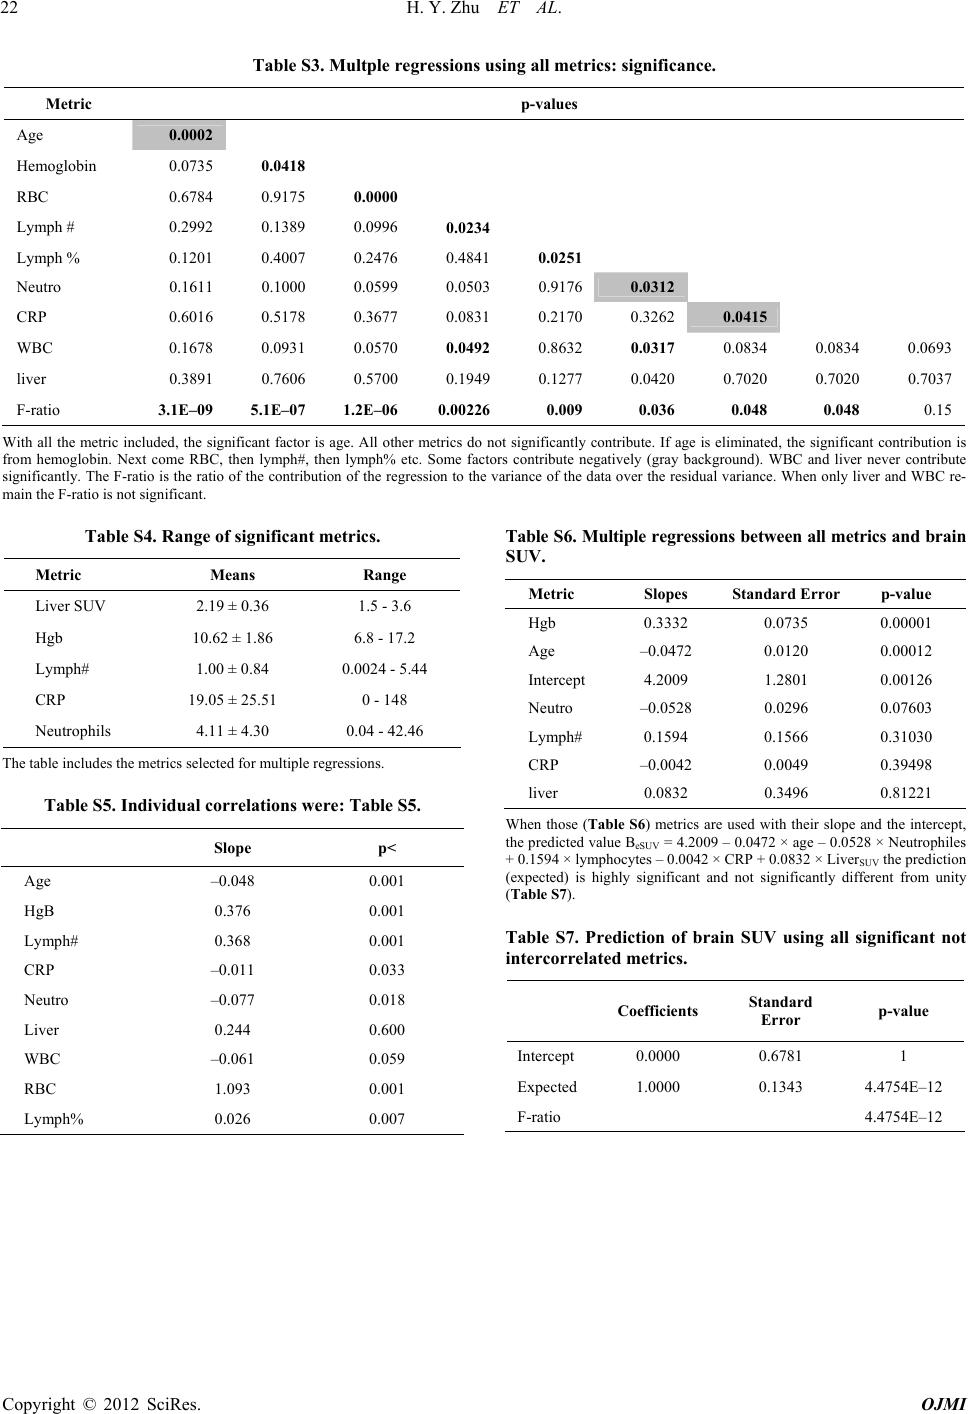 H. Y. Zhu ET AL. 22 Table S3. Multple regressions using all metrics: significance. Metric p-values Age 0.0002 Hemoglobin 0.0735 0.0418 RBC 0.6784 0.9175 0.0000 Lymph # 0.2992 0.1389 0.09960.0234 Lymph % 0.1201 0.4007 0.24760.48410.0251 Neutro 0.1611 0.1000 0.05990.05030.91760.0312 CRP 0.6016 0.5178 0.36770.08310.21700.32620.0415 WBC 0.1678 0.0931 0.05700.0492 0.8632 0.0317 0.0834 0.0834 0.0693 liver 0.3891 0.7606 0.5700 0.1949 0.1277 0.0420 0.7020 0.7020 0.7037 F-ratio 3.1E–09 5.1E–07 1.2E–060.002260.0090.0360.048 0.048 0.15 With all the metric included, the significant factor is age. All other metrics do not significantly contribute. If age is eliminated, the significant contribution is from hemoglobin. Next come RBC, then lymph#, then lymph% etc. Some factors contribute negatively (gray background). WBC and liver never contribute significantly. The F-ratio is the ratio of the contribution of the regression to the variance of the data over the residual variance. When only liver and WBC re- main the F-ratio is not significant. Table S4. Range of significant metrics. Metric Means Range Liver SUV 2.19 ± 0.36 1.5 - 3.6 Hgb 10.62 ± 1.86 6.8 - 17.2 Lymph# 1.00 ± 0.84 0.0024 - 5.44 CRP 19.05 ± 25.51 0 - 148 Neutrophils 4.11 ± 4.30 0.04 - 42.46 The table includes the metrics selected for multiple regressions. Table S5. Individual correlations w e re : Table S5. Slope p< Age –0.048 0.001 HgB 0.376 0.001 Lymph# 0.368 0.001 CRP –0.011 0.033 Neutro –0.077 0.018 Liver 0.244 0.600 WBC –0.061 0.059 RBC 1.093 0.001 Lymph% 0.06 20.007 Table S6. Multiple regressions between all metrics and brain SUV. Metric Slopes Standard Error p-value Hgb 0.3332 0.0735 0.00001 Age –0.0472 0.0120 0.00012 Intercept 4.2009 1.2801 0.00126 Neutro –0.0528 0.0296 0.07603 Lymph# 0.1594 0.1566 0.31030 CRP –0.0042 0.0049 0.39498 liver 0.0832 0.3496 0.81221 When those (Table S6) metrics are used with their slope and the intercept, the predicted value BeSUV = 4.2009 – 0.0472 × age – 0.0528 × Neutrophiles + 0.1594 × lymphocytes – 0.0042 × CRP + 0.0832 × LiverSUV the prediction (expected) is highly significant and not significantly different from unity (Table S7). Table S7. Prediction of brain SUV using all significant not intercorrelated metrics. Coefficients Standard Error p-value Intercept 0.0000 0.6781 1 Expected 1.0000 0.1343 4.4754E–12 F-ratio 4.4754E–12 Copyright © 2012 SciRes. OJMI |