Paper Menu >>
Journal Menu >>
 Open Journal of Soil Science, 2012, 2, 7-16 http://dx.doi.org/10.4236/ojss.2012.21002 Published Online March 2012 (http://www.SciRP.org/journal/ojss) 7 Natural Radioactivity Levels and Estimation of Radiation Exposure in Environmental Soil Samples from Tulkarem Province-Palestine Kaleel Mohammed Thabayneh*, Mohanad Mohammed Jazzar Faculty of Science and Technology, Hebron University, Hebron, Palestine. Email: *[email protected] Received November 5th, 2011; revised December 15th, 2011; accepted December 22nd, 2011 ABSTRACT The activity concentrations of the natural radionuclides namely 238U, 232Th, 40K and 137Cs are measured for soil samples collected from different locations of Tulkarem district in West Back-Palestine. High-resolution gamma spectrometry (HPGe detector) was used to determine the activity concentration of these radionuclides in 72 surface soil samples taken from areas in and surrounding Tulkarem city. The concentration of 238U varied in the range 9.7 - 83.5 Bq·kg–1 with an average value of 34.5 Bq·kg–1, 232Th in the range 5.3 - 44.8 Bq·kg–1 with an average value of 23.8 Bq·kg–1, 40K in the range 10.2 - 404.0 Bq·kg–1 with an average value of 120.0 Bq·kg–1 and 137Cs in the range 1.0 - 24.5 Bq·kg–1 with an av- erage value of 7.8 Bq·kg–1. The results have been compared with those of different countries of the world and Palestine. To assess the radiological hazard of the natural radioactivity, the absorbed dose rate (Dr), the radium equivalent activity (Raeq), the effective dose rate (Eeff), the annual effective dose equivalent (AED E), Excess Lifetime Cancer Risk (ELCR), the radioactivity level index (Iγ), and the external (Hex) and internal (Hin) hazard indices were calculated. It can be con- cluded that no risk may threat the residents around and center of Tulkarem city except some areas which activity due to fallout 137Cs were high concentration levels. Hence the probability of occurrence of any of the health effects of radiation is low. Hence, measurements have been taken as representing baseline values of these radionuclides in the soil in studying area. Keywords: Gamma Ray Spectrometry; The Activity Concentration; Annual Effective Dose; External Hazard Index 1. Introduction Natural radioactivity is a source of continuous exposure to human beings. It is present in the human environment due to the presence of cosmogenic and primordial radio- nuclides in the Earth’s crust. Natural environmental ra- dioactivity and the associated external exposure due to gamma radiation depend primarily on the geological and geographical conditions, and appear at different levels in the soil of each region in the world [1]. Cosmogenic ra- dionuclides are produced by the interaction of cosmic- rays with atomic nuclei in the atmosphere, while primor- dial ones (terrestrial background radiation) were formed by the process of nucleo-synthesis [2]. The great interest expressed worldwide for the study of naturally occurring radiation and environmental radio- activity has led to interest in extensive surveys in many countries. Natural sources still contribute almost 80% of the collective radiation exposure of the world’s popula- tion. There are many sources of radiation and radioactiv- ity in the environment. Gamma radiation emitted from na- turally occurring radionuclides, also called terrestrial back- ground radiation, represent the main external source of irradiation of the human body [3,4]. Significant amount of man-made radionuclides 137Cs and 90Sr may also pre- sent in the soil and plant as a result of testing of nuclear weapons in the atmosphere, accidents, such as Chernobyl accident, and the routine discharge of radionuclides from nuclear installations. The contribution of other nuclides to the total activity is negligible [4]. Once present in the environment, these radionuclides, whether natural or arti- ficial, are available for uptake by plants and animals and so make their way into the food chain [5]. Human beings are exposed to radiation from sources outside their bod- ies; mainly, cosmic rays and gamma ray emitters in soils, building materials, water, food, and air. Studying the levels of radionuclide distribution in the environment provides essential radiological information [3]. The amount of radioactivity in soil varies widely; hence it is important to monitor the terrestrial background *Corresponding author. Copyright © 2012 SciRes. OJSS  Natural Radioactivity Levels and Estimation of Radiation Exposure in Environmental Soil Samples from Tulkarem Province-Palestine 8 radiation mainly due to natural radionuclides in soil [6]. Soil from waste dump sites may contain naturally oc- curring radionuclides in significant amounts and the re- sulting external radiation exposure pathway to the popu- lation has been subjects for study [7]. Many studies world- wide have measured the activity concentration of natural radionuclides in soil to ascertain the levels of contamina- tion [3,5-23]. The present work aims to estimate the activity concen- tration of radionuclides 226Ra, 232Th, and 40K and man- made radionuclide 137Cs in soil samples collected from Tulkarem province-West Bank-Palestine, and to evaluate the radiological indices and their effects on the popula- tion who live in this environment. Therefore, the results were used to assess the potential radiological hazards associated with these soils by estimating the radiological indices. Data on the radioactivity levels of soil in this province is not known previously. Tulkarem province is located at the northwest of West Bank region-Palestine, as seen in Figure 1. The areas have a general elevation of 200 - 450 meters above sea level. The province is densely populated (250 thousand people) with the highest concentration of local dwellings, farmers and large scale manufacturing industries. These industries coupled with wage increases account for the magnitude of waste generated in these areas. 2. Experimental Procedure 2.1. Sample Collection and Sample Processing A total of 72 surface soil samples in twelve major sites were collected from the city and villages of the Tulkarem district. The sites are: Tulkarem city (12 samples), Anab- ta (6 samples), Nour Shams (6 samples), Irtah (6 samples), Dair Alghsoon (4 samples), Chemical Factory (4 samples), Bala’a (6 samples), Baqah (4 samples), Illar (6 samples), Alnazlat (6 samples), Faroun (6 samples) and Alkafreiat (6 samples). Samples were collected in the autumn season Tulkarem Region (a) West bank map (b) Region under investigation Figure 1. (a) West Bank geographical map of the studied region; (b) Map showing the region under investigation. https://www.cia.gov/cia/publications/factbook/docs/contributor_copyright.html. Copyright © 2012 SciRes. OJSS  Natural Radioactivity Levels and Estimation of Radiation Exposure in Environmental Soil Samples from Tulkarem Province-Palestine 9 in 2010. A 30 cm by 30 cm area was marked at four to six points in each sampling site by grading, depending on the size of sites. The top layers of the soil which contai- ned wastes that are yet to decompose were removed. Soil samples were collected to a depth of 5 cm using a coring tool that was thoroughly cleaned and dried before each sample was collected. Ultimate care was taken in the ex- traction of soil sections to avoid mixing or cross contami- nation of soil samples. About 2 kg of each sample were collected in a plastic bag at the sampling points. The soil samples were processed according to the procedure rec- ommended by the IAEA. Soil samples were well mixed after removing exotic materials such as pieces of stones and gravel. The samples were weighed and then dried in an oven at 110˚C. After shaking thoroughly, the samples were sieved with a 1 mm mesh screen [6]. The samples were dried, sieved, packed in 1 L Marinelli beaker and sealed for 4 weeks to reach secular equilibrium between 226Ra (daughter of 238U) and 232Th with their daughter nuclei. This means in order to allow for radon and its short-lived progenies to reach secular radioactive equi- librium prior to gamma spectroscopy [13]. 2.2. Calibration and Energy Lines The activity concentrations of 226Ra, 232Th, 40K and 137Cs in the samples were determined by standard gamma spec- trometry using a HPGe detector (Ortec) with a 15% rela- tive efficiency and a resolution 1.85 keV for the 1332.5 keV 60Co gamma line and MCA with 8000 channel. The detector is shielded using three inner concentric shells of lead, cadmium and copper on all sides to reduce the back- ground level of the system The detector calibration was performed using a certified standard reference mixed ma- terial 139Ce (166 keV), 203Hg (279 keV), 113Sn (392 keV), 85Sr (514 keV), 137Cs (662 keV), 88Y (898 and 1836 keV) and 60Co (1173 and 1332 keV) in the energy range (166 - 1850) keV. The calibration efficiency curve beyond 1850 keV was constructed using different energy peaks of 226R in order to cover the range from 60 up to 2500 keV [13]. The standard source packed in the Marinelli beaker had the same geometry as that used for measured samples. The background radiation and the samples were counted between 5 × 10⁴ and 7 × 10⁴ s. The 186.2 keV of 226Ra, 295.2 and 351.9 keV of 214Pb and 609.3, 1120.3 and 1764.8 keV of 214Bi gamma ray lines were used to deter- mine the 238U activity concentration. The 232Th activity concentration was determined using 238.6 keV of 212Pb, 583.3 keV and 2614 keV of 208Tl and 338.6 keV, 911.1 and 968.9 keV of 228Ac gamma lines. The activities of 40K and 137Cs were determined directly from the 1460.8 and 661.6 keV gamma lines, respectively. The net count rate under the most prominent photo peaks of all radio- nuclides daughter peaks were calculated by subtracting the respective count rate from the background spectrum obtained for the same counting time. Then the activity of the radionuclide is calculated from the background sub- tracted area prominent gamma ray energies [17]. 3. Theoretical Calculations 3.1. The Activity Concentration The activity concentrations of the radionuclides in the mea- sured samples were computed using the following rela- tion [13]: Bq kg f fs Ca C I M (1) where Ca is the net gamma counting rate (counts per second), εff the detector efficiency of the specific γ-ray, I is the intensity of the -line in a radionuclide and Ms is the mass of the sample (kg). 3.2. Radiological Effects 3.2.1. The Radium Equivalent Activity (Raeq) For the purpose of comparing the radiological effect or activity of materials that contain 226Ra, 232Th and 40K by a single quantity, which takes into account the radiation hazards associated with them, a common index termed the radium equivalent activity (Raeq) is used. This active- ity index provides a useful guideline in regulating the safety standards on radiation protection for the general public residing in the area under investigation. The Raeq index represents a weighted sum of activities of the abo- ve mentioned natural radionuclides and is based on the estimation that 1 Bq·kg–1 of 226Ra, 0.7 Bq·kg–1 of 232Th, and 13 Bq·kg–1 of 40K produces the same gamma radia- tion dose rates. The index is given as: Ra ThK 1.43 0.077 eq Ra CCC (2) where CRa, CTh and CK are the average activity concen- tration in the sample in Bq·kg –1 of 226Ra, 232 Th, and 40K respectively [13]. 3.2.2. The Absorbed Dose Rate The absorbed dose rate (Dr) in air at average gonad hei- ght of one meter above the surface of ground due to the natural radionuclides 226Ra, 232Th and 40K was estimated using the formula given as [18]: Ra RaTh ThK K nGyhrDr DCFCDCFCDCF C (3) Where: DCFRa, DCFTh and DCFK, are the dose conver- sion factors for, 226Ra, 232Th and 40K in nSv/h/Bq·kg−1 and CRa, CTh and CK have the same meaning as in Equation (2). Copyright © 2012 SciRes. OJSS 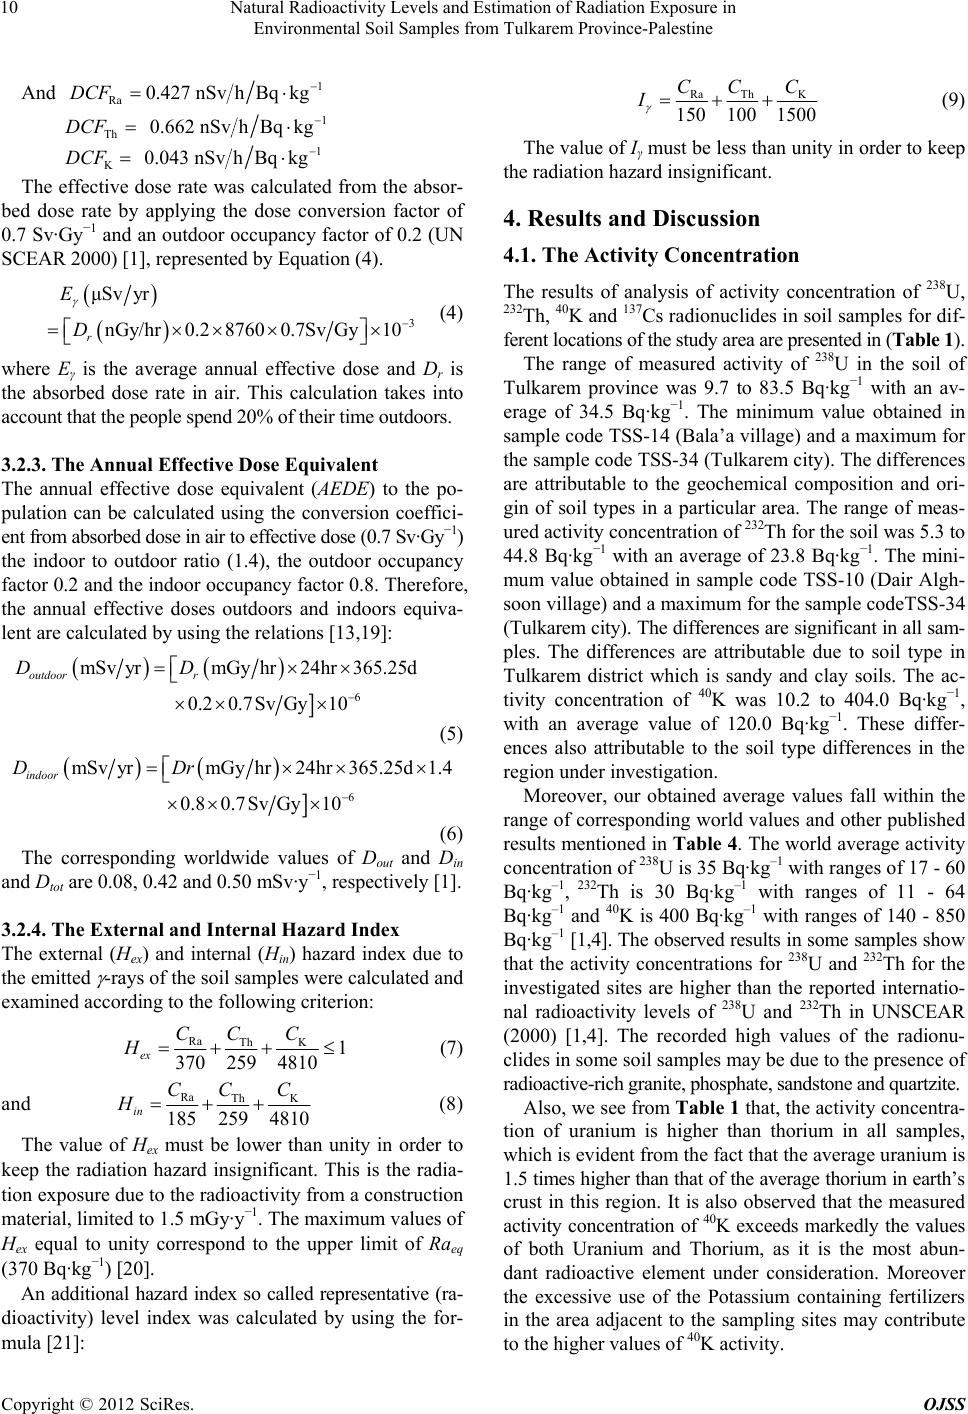 Natural Radioactivity Levels and Estimation of Radiation Exposure in Environmental Soil Samples from Tulkarem Province-Palestine 10 And 1 Ra 0.427 nSvhBqkgDCF 1 Th 0.662 nSv hBqkgDCF 1 K 0.043 nSvhBqkgDCF The effective dose rate was calculated from the absor- bed dose rate by applying the dose conversion factor of 0.7 Sv·Gy−1 and an outdoor occupancy factor of 0.2 (UN SCEAR 2000) [1], represented by Equation (4). 3 μSv yr nGy/hr0.287600.7Sv Gy10 r E D (4) where Eγ is the average annual effective dose and Dr is the absorbed dose rate in air. This calculation takes into account that the people spend 20% of their time outdoors. 3.2.3. The Annual Effective Dose Equivalent The annual effective dose equivalent (AEDE) to the po- pulation can be calculated using the conversion coeffici- ent from absorbed dose in air to effective dose (0.7 Sv·Gy−1) the indoor to outdoor ratio (1.4), the outdoor occupancy factor 0.2 and the indoor occupancy factor 0.8. Therefore, the annual effective doses outdoors and indoors equiva- lent are calculated by using the relations [13,19]: 6 mSv yrmGy hr24hr365.25d 0.20.7Sv Gy10 outdoor r DD (5) 6 mSv yrmGy hr24hr365.25d1.4 0.80.7Sv Gy10 indoor DDr (6) The corresponding worldwide values of Dout and Din and Dtot are 0.08, 0.42 and 0.50 mSv·y−1, respectively [1]. 3.2.4. The External and Internal Hazard Index The external (Hex) and internal (Hin) hazard index due to the emitted -rays of the soil samples were calculated and examined according to the following criterion: Ra ThK 1 370 259 4810 ex CCC H (7) and Ra Th K 185259 4810 in CCC H (8) The value of Hex must be lower than unity in order to keep the radiation hazard insignificant. This is the radia- tion exposure due to the radioactivity from a construction material, limited to 1.5 mGy·y−1. The maximum values of Hex equal to unity correspond to the upper limit of Raeq (370 Bq·kg−1) [20]. An additional hazard index so called representative (ra- dioactivity) level index was calculated by using the for- mula [21]: Ra Th K 150100 1500 CCC I (9) The value of Iγ must be less than unity in order to keep the radiation hazard insignificant. 4. Results and Discussion 4.1. The Activity Concentration The results of analysis of activity concentration of 238U, 232Th, 40K and 137Cs radionuclides in soil samples for dif- ferent locations of the study area are presented in (Table 1). The range of measured activity of 238U in the soil of Tulkarem province was 9.7 to 83.5 Bq·kg−1 with an av- erage of 34.5 Bq·kg−1. The minimum value obtained in sample code TSS-14 (Bala’a village) and a maximum for the sample code TSS-34 (Tulkarem city). The differences are attributable to the geochemical composition and ori- gin of soil types in a particular area. The range of meas- ured activity concentration of 232Th for the soil was 5.3 to 44.8 Bq·kg−1 with an average of 23.8 Bq·kg−1. The mini- mum value obtained in sample code TSS-10 (Dair Algh- soon village) and a maximum for the sample codeTSS-34 (Tulkarem city). The differences are significant in all sam- ples. The differences are attributable due to soil type in Tulkarem district which is sandy and clay soils. The ac- tivity concentration of 40K was 10.2 to 404.0 Bq·kg−1, with an average value of 120.0 Bq·kg−1. These differ- ences also attributable to the soil type differences in the region under investigation. Moreover, our obtained average values fall within the range of corresponding world values and other published results mentioned in Tab le 4. The world average activity concentration of 238U is 35 Bq·kg–1 with ranges of 17 - 60 Bq·kg–1, 232Th is 30 Bq·kg–1 with ranges of 11 - 64 Bq·kg–1 and 40K is 400 Bq·kg–1 with ranges of 140 - 850 Bq·kg–1 [1,4]. The observed results in some samples show that the activity concentrations for 238U and 232Th for the investigated sites are higher than the reported internatio- nal radioactivity levels of 238U and 232Th in UNSCEAR (2000) [1,4]. The recorded high values of the radionu- clides in some soil samples may be due to the presence of radioactive-rich granite, phosphate, sandstone and quartzite. Also, we see from Table 1 that, the activity concentra- tion of uranium is higher than thorium in all samples, which is evident from the fact that the average uranium is 1.5 times higher than that of the average thorium in earth’s crust in this region. It is also observed that the measured activity concentration of 40K exceeds markedly the values of both Uranium and Thorium, as it is the most abun- dant radioactive element under consideration. Moreover the excessive use of the Potassium containing fertilizers in the area adjacent to the sampling sites may contribute to the higher values of 40K activity. Copyright © 2012 SciRes. OJSS 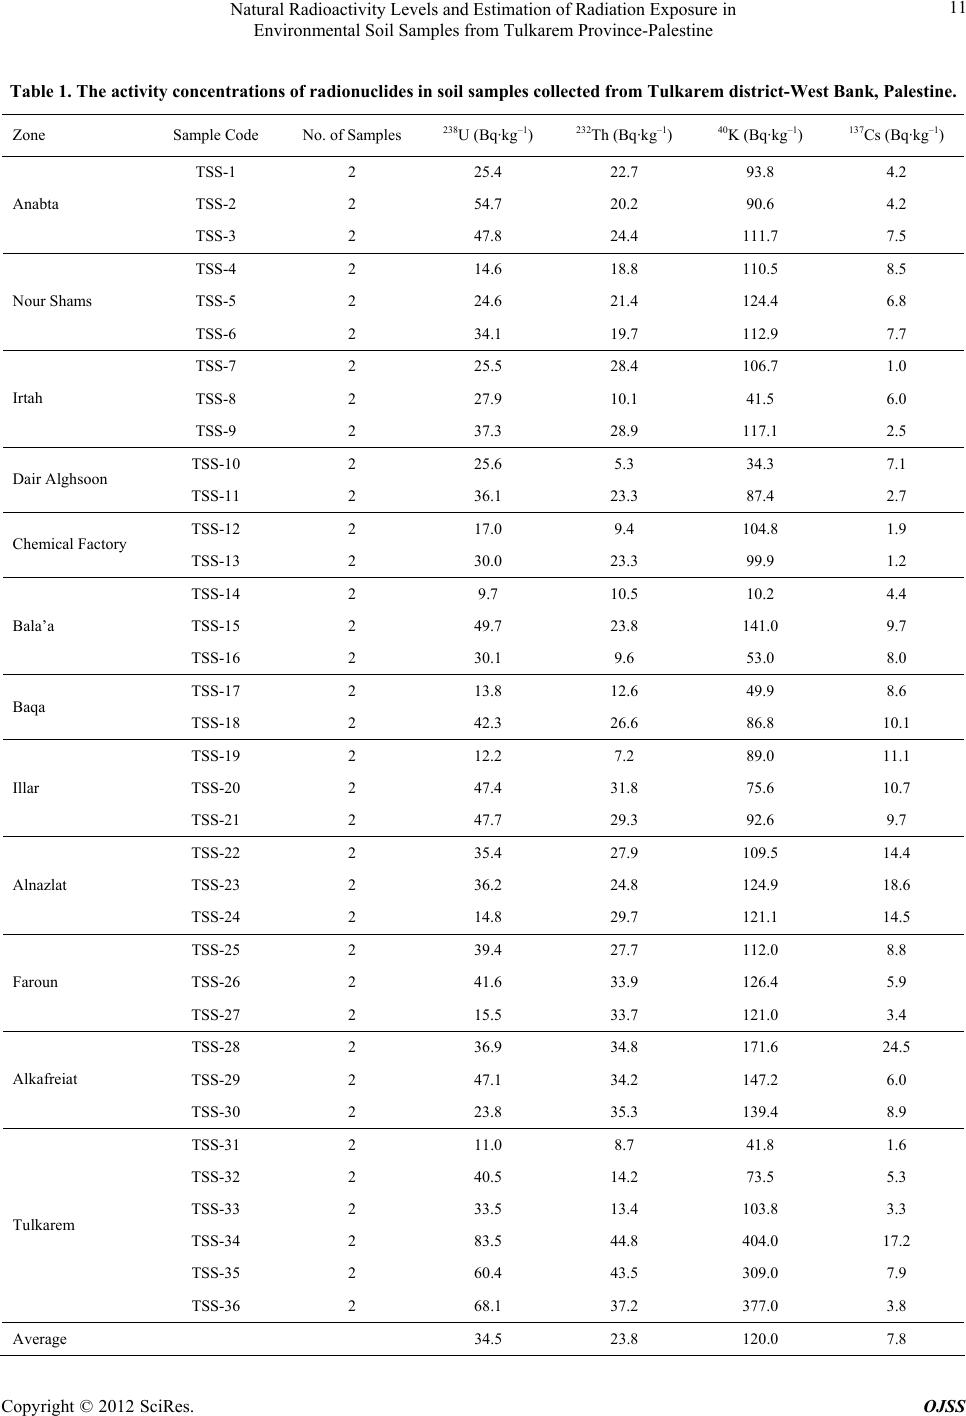 Natural Radioactivity Levels and Estimation of Radiation Exposure in Environmental Soil Samples from Tulkarem Province-Palestine Copyright © 2012 SciRes. OJSS 11 Table 1. The activity concentrations of radionuclides in soil samples collected from Tulkarem district-West Bank, Palestine. Zone Sample Code No. of Samples 238U (Bq·kg–1) 232Th (Bq·kg–1) 40K (Bq·kg–1) 137Cs (Bq·kg–1) TSS-1 2 25.4 22.7 93.8 4.2 TSS-2 2 54.7 20.2 90.6 4.2 Anabta TSS-3 2 47.8 24.4 111.7 7.5 TSS-4 2 14.6 18.8 110.5 8.5 TSS-5 2 24.6 21.4 124.4 6.8 Nour Shams TSS-6 2 34.1 19.7 112.9 7.7 TSS-7 2 25.5 28.4 106.7 1.0 TSS-8 2 27.9 10.1 41.5 6.0 Irtah TSS-9 2 37.3 28.9 117.1 2.5 TSS-10 2 25.6 5.3 34.3 7.1 Dair Alghsoon TSS-11 2 36.1 23.3 87.4 2.7 TSS-12 2 17.0 9.4 104.8 1.9 Chemical Factory TSS-13 2 30.0 23.3 99.9 1.2 TSS-14 2 9.7 10.5 10.2 4.4 TSS-15 2 49.7 23.8 141.0 9.7 Bala’a TSS-16 2 30.1 9.6 53.0 8.0 TSS-17 2 13.8 12.6 49.9 8.6 Baqa TSS-18 2 42.3 26.6 86.8 10.1 TSS-19 2 12.2 7.2 89.0 11.1 TSS-20 2 47.4 31.8 75.6 10.7 Illar TSS-21 2 47.7 29.3 92.6 9.7 TSS-22 2 35.4 27.9 109.5 14.4 TSS-23 2 36.2 24.8 124.9 18.6 Alnazlat TSS-24 2 14.8 29.7 121.1 14.5 TSS-25 2 39.4 27.7 112.0 8.8 TSS-26 2 41.6 33.9 126.4 5.9 Faroun TSS-27 2 15.5 33.7 121.0 3.4 TSS-28 2 36.9 34.8 171.6 24.5 TSS-29 2 47.1 34.2 147.2 6.0 Alkafreiat TSS-30 2 23.8 35.3 139.4 8.9 TSS-31 2 11.0 8.7 41.8 1.6 TSS-32 2 40.5 14.2 73.5 5.3 TSS-33 2 33.5 13.4 103.8 3.3 TSS-34 2 83.5 44.8 404.0 17.2 TSS-35 2 60.4 43.5 309.0 7.9 Tulkarem TSS-36 2 68.1 37.2 377.0 3.8 Average 34.5 23.8 120.0 7.8 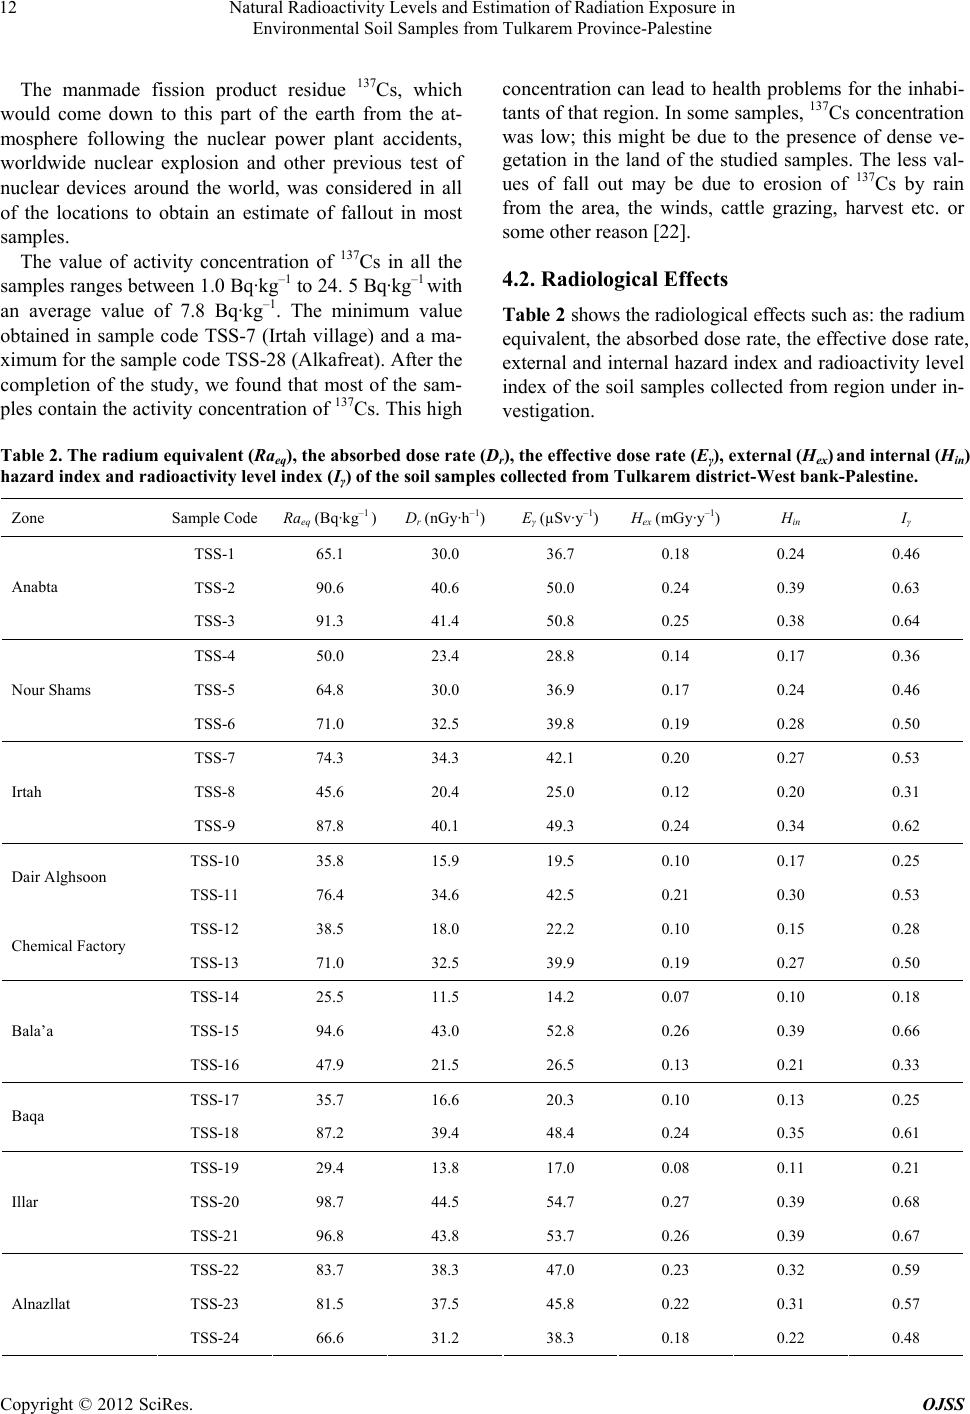 Natural Radioactivity Levels and Estimation of Radiation Exposure in Environmental Soil Samples from Tulkarem Province-Palestine 12 The manmade fission product residue 137Cs, which would come down to this part of the earth from the at- mosphere following the nuclear power plant accidents, worldwide nuclear explosion and other previous test of nuclear devices around the world, was considered in all of the locations to obtain an estimate of fallout in most samples. The value of activity concentration of 137Cs in all the samples ranges between 1.0 Bq·kg–1 to 24. 5 Bq·kg–1 with an average value of 7.8 Bq·kg–1. The minimum value obtained in sample code TSS-7 (Irtah village) and a ma- ximum for the sample code TSS-28 (Alkafreat). After the completion of the study, we found that most of the sam- ples contain the activity concentration of 137Cs. This high concentration can lead to health problems for the inhabi- tants of that region. In some samples, 137Cs concentration was low; this might be due to the presence of dense ve- getation in the land of the studied samples. The less val- ues of fall out may be due to erosion of 137Cs by rain from the area, the winds, cattle grazing, harvest etc. or some other reason [22]. 4.2. Radiological Effects Table 2 shows the radiological effects such as: the radium equivalent, the absorbed dose rate, the effective dose rate, external and internal hazard index and radioactivity level index of the soil samples collected from region under in- vestigation. Table 2. The radium equivalent (Raeq), the absorbed dose rate (Dr), the effective dose rate (Eγ), external (Hex) and internal (Hin) hazard index and radioactivity level index (Iγ) of the soil samples collected from Tulkarem district-West bank-Palestine. Zone Sample Code Raeq (Bq·kg–1 ) Dr (nGy·h–1) Eγ (µSv·y–1) Hex (mGy·y–1)Hin Iγ TSS-1 65.1 30.0 36.7 0.18 0.24 0.46 TSS-2 90.6 40.6 50.0 0.24 0.39 0.63 Anabta TSS-3 91.3 41.4 50.8 0.25 0.38 0.64 TSS-4 50.0 23.4 28.8 0.14 0.17 0.36 TSS-5 64.8 30.0 36.9 0.17 0.24 0.46 Nour Shams TSS-6 71.0 32.5 39.8 0.19 0.28 0.50 TSS-7 74.3 34.3 42.1 0.20 0.27 0.53 TSS-8 45.6 20.4 25.0 0.12 0.20 0.31 Irtah TSS-9 87.8 40.1 49.3 0.24 0.34 0.62 TSS-10 35.8 15.9 19.5 0.10 0.17 0.25 Dair Alghsoon TSS-11 76.4 34.6 42.5 0.21 0.30 0.53 TSS-12 38.5 18.0 22.2 0.10 0.15 0.28 Chemical Factory TSS-13 71.0 32.5 39.9 0.19 0.27 0.50 TSS-14 25.5 11.5 14.2 0.07 0.10 0.18 TSS-15 94.6 43.0 52.8 0.26 0.39 0.66 Bala’a TSS-16 47.9 21.5 26.5 0.13 0.21 0.33 TSS-17 35.7 16.6 20.3 0.10 0.13 0.25 Baqa TSS-18 87.2 39.4 48.4 0.24 0.35 0.61 TSS-19 29.4 13.8 17.0 0.08 0.11 0.21 TSS-20 98.7 44.5 54.7 0.27 0.39 0.68 Illar TSS-21 96.8 43.8 53.7 0.26 0.39 0.67 TSS-22 83.7 38.3 47.0 0.23 0.32 0.59 TSS-23 81.5 37.5 45.8 0.22 0.31 0.57 Alnazllat TSS-24 66.6 31.2 38.3 0.18 0.22 0.48 Copyright © 2012 SciRes. OJSS 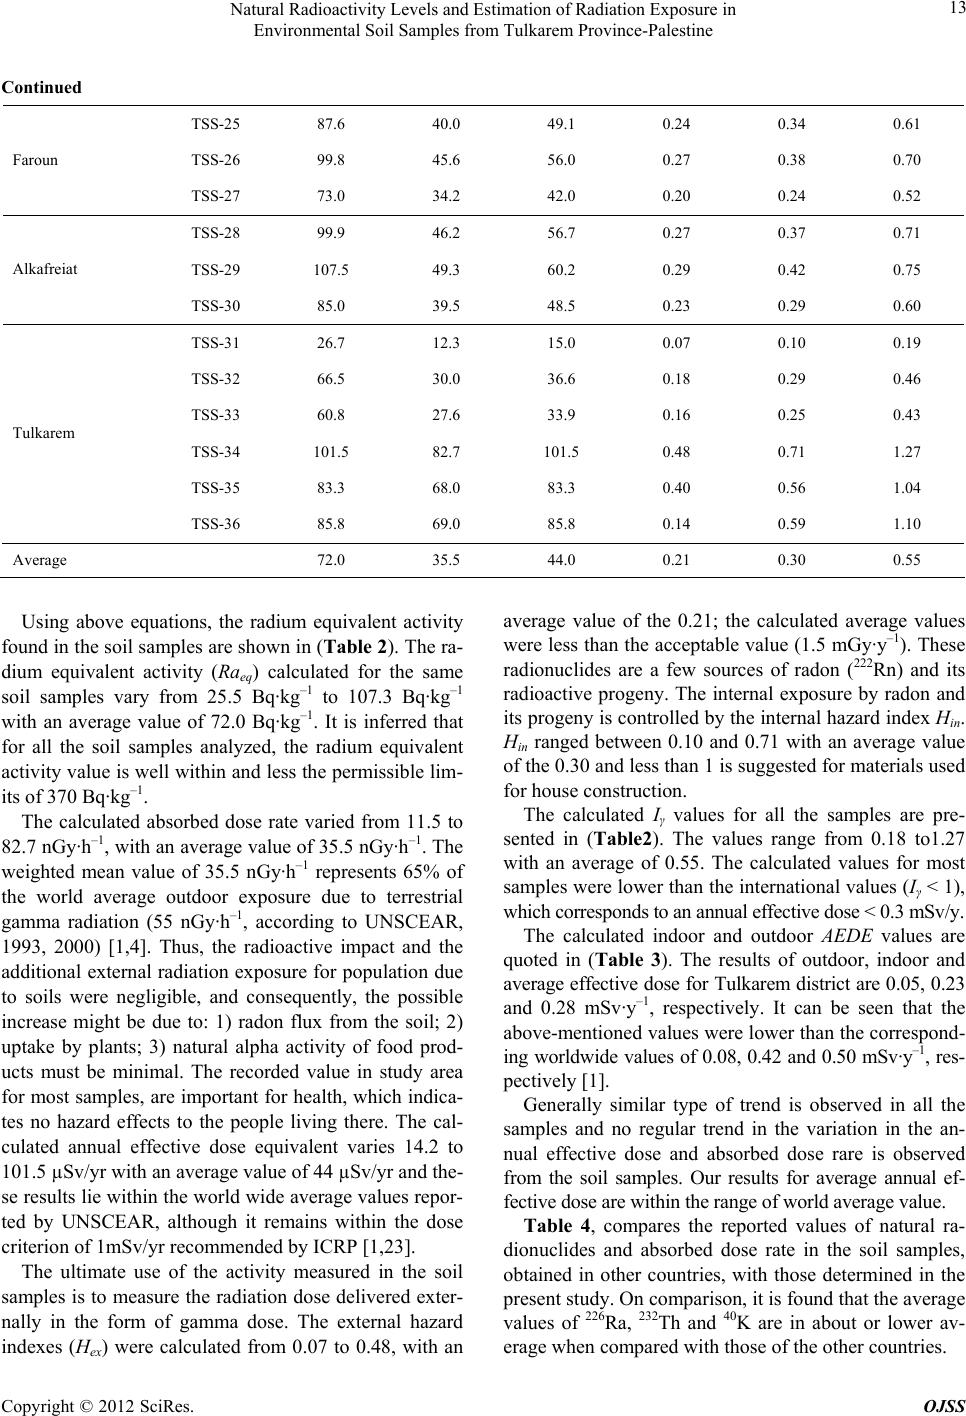 Natural Radioactivity Levels and Estimation of Radiation Exposure in Environmental Soil Samples from Tulkarem Province-Palestine 13 Continued TSS-25 87.6 40.0 49.1 0.24 0.34 0.61 TSS-26 99.8 45.6 56.0 0.27 0.38 0.70 Faroun TSS-27 73.0 34.2 42.0 0.20 0.24 0.52 TSS-28 99.9 46.2 56.7 0.27 0.37 0.71 TSS-29 107.5 49.3 60.2 0.29 0.42 0.75 Alkafreiat TSS-30 85.0 39.5 48.5 0.23 0.29 0.60 TSS-31 26.7 12.3 15.0 0.07 0.10 0.19 TSS-32 66.5 30.0 36.6 0.18 0.29 0.46 TSS-33 60.8 27.6 33.9 0.16 0.25 0.43 TSS-34 101.5 82.7 101.5 0.48 0.71 1.27 TSS-35 83.3 68.0 83.3 0.40 0.56 1.04 Tulkarem TSS-36 85.8 69.0 85.8 0.14 0.59 1.10 Average 72.0 35.5 44.0 0.21 0.30 0.55 Using above equations, the radium equivalent activity found in the soil samples are shown in (Table 2). The ra- dium equivalent activity (Raeq) calculated for the same soil samples vary from 25.5 Bq·kg–1 to 107.3 Bq·kg–1 with an average value of 72.0 Bq·kg–1. It is inferred that for all the soil samples analyzed, the radium equivalent activity value is well within and less the permissible lim- its of 370 Bq·kg–1. The calculated absorbed dose rate varied from 11.5 to 82.7 nGy·h–1, with an average value of 35.5 nGy·h–1. The weighted mean value of 35.5 nGy·h–1 represents 65% of the world average outdoor exposure due to terrestrial gamma radiation (55 nGy·h–1, according to UNSCEAR, 1993, 2000) [1,4]. Thus, the radioactive impact and the additional external radiation exposure for population due to soils were negligible, and consequently, the possible increase might be due to: 1) radon flux from the soil; 2) uptake by plants; 3) natural alpha activity of food prod- ucts must be minimal. The recorded value in study area for most samples, are important for health, which indica- tes no hazard effects to the people living there. The cal- culated annual effective dose equivalent varies 14.2 to 101.5 µSv/yr with an average value of 44 µSv/yr and the- se results lie within the world wide average values repor- ted by UNSCEAR, although it remains within the dose criterion of 1mSv/yr recommended by ICRP [1,23]. The ultimate use of the activity measured in the soil samples is to measure the radiation dose delivered exter- nally in the form of gamma dose. The external hazard indexes (Hex) were calculated from 0.07 to 0.48, with an average value of the 0.21; the calculated average values were less than the acceptable value (1.5 mGy·y–1). These radionuclides are a few sources of radon (222Rn) and its radioactive progeny. The internal exposure by radon and its progeny is controlled by the internal hazard index Hin. Hin ranged between 0.10 and 0.71 with an average value of the 0.30 and less than 1 is suggested for materials used for house construction. The calculated Iγ values for all the samples are pre- sented in (Table2). The values range from 0.18 to1.27 with an average of 0.55. The calculated values for most samples were lower than the international values (Iγ < 1), which corresponds to an annual effective dose < 0.3 mSv/y. The calculated indoor and outdoor AEDE values are quoted in (Table 3). The results of outdoor, indoor and average effective dose for Tulkarem district are 0.05, 0.23 and 0.28 mSv·y–1, respectively. It can be seen that the above-mentioned values were lower than the correspond- ing worldwide values of 0.08, 0.42 and 0.50 mSv·y–1, res- pectively [1]. Generally similar type of trend is observed in all the samples and no regular trend in the variation in the an- nual effective dose and absorbed dose rare is observed from the soil samples. Our results for average annual ef- fective dose are within the range of world average value. Table 4, compares the reported values of natural ra- dionuclides and absorbed dose rate in the soil samples, obtained in other countries, with those determined in the present study. On comparison, it is found that the average values of 226Ra, 232Th and 40K are in about or lower av- erage when compared with those of the other countries. Copyright © 2012 SciRes. OJSS 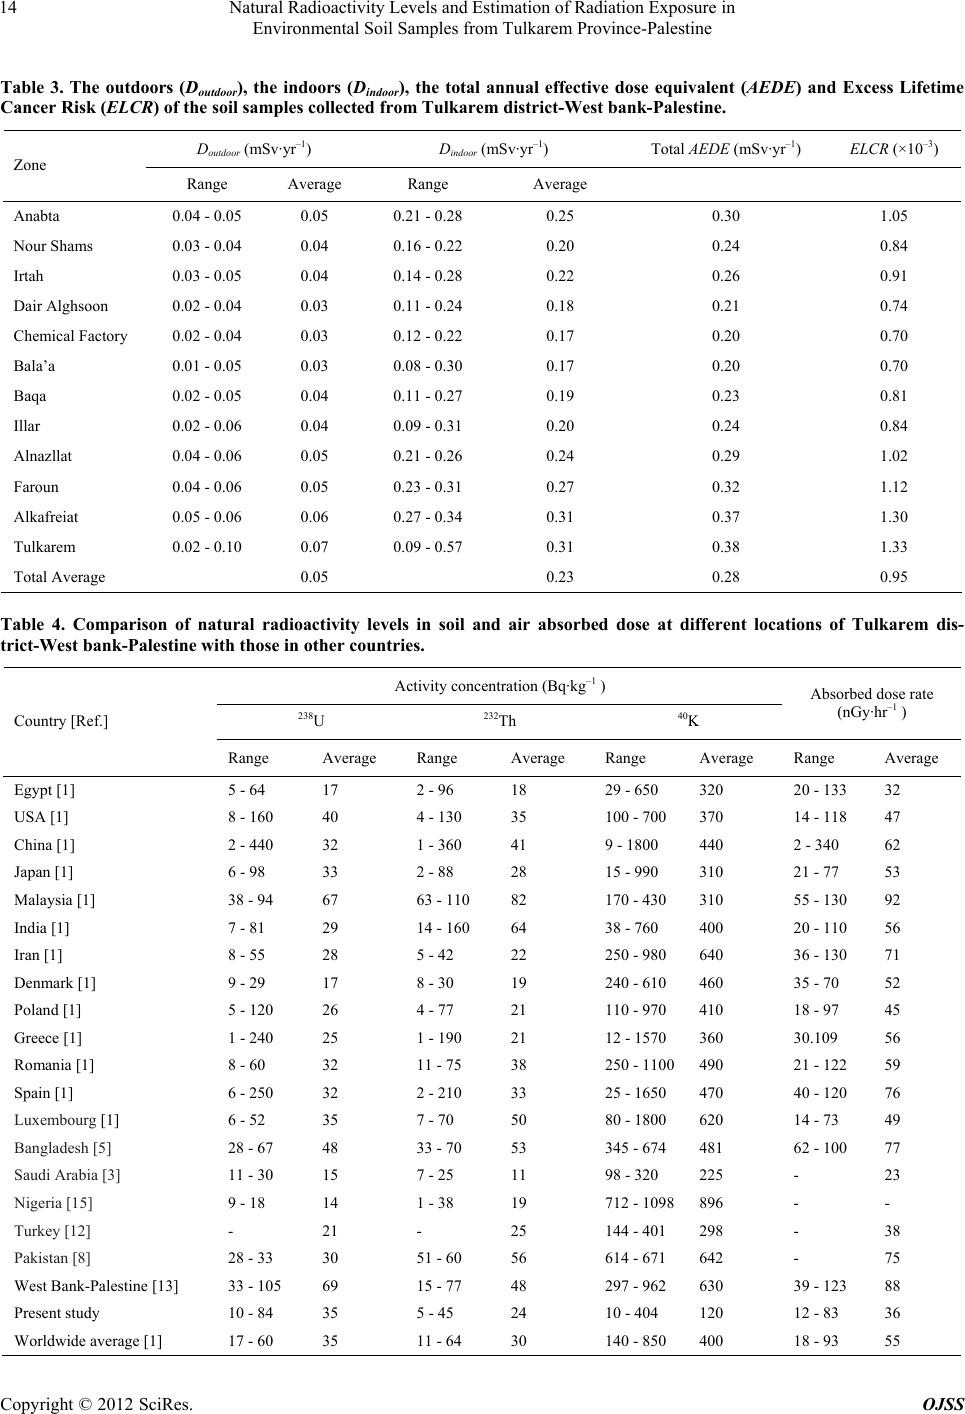 Natural Radioactivity Levels and Estimation of Radiation Exposure in Environmental Soil Samples from Tulkarem Province-Palestine 14 Table 3. The outdoors (Doutdoor), the indoors (Dindoor), the total annual effective dose equivalent (AEDE) and Excess Lifetime Cancer Risk (ELCR) of the soil samples collected from Tulkarem district-West bank-Palestine. Doutdoor (mSv·yr–1) Dindoor (mSv·yr–1) Total AEDE (mSv·yr–1) ELCR (×10–3) Zone Range Average Range Average Anabta 0.04 - 0.05 0.05 0.21 - 0.28 0.25 0.30 1.05 Nour Shams 0.03 - 0.04 0.04 0.16 - 0.22 0.20 0.24 0.84 Irtah 0.03 - 0.05 0.04 0.14 - 0.28 0.22 0.26 0.91 Dair Alghsoon 0.02 - 0.04 0.03 0.11 - 0.24 0.18 0.21 0.74 Chemical Factory 0.02 - 0.04 0.03 0.12 - 0.22 0.17 0.20 0.70 Bala’a 0.01 - 0.05 0.03 0.08 - 0.30 0.17 0.20 0.70 Baqa 0.02 - 0.05 0.04 0.11 - 0.27 0.19 0.23 0.81 Illar 0.02 - 0.06 0.04 0.09 - 0.31 0.20 0.24 0.84 Alnazllat 0.04 - 0.06 0.05 0.21 - 0.26 0.24 0.29 1.02 Faroun 0.04 - 0.06 0.05 0.23 - 0.31 0.27 0.32 1.12 Alkafreiat 0.05 - 0.06 0.06 0.27 - 0.34 0.31 0.37 1.30 Tulkarem 0.02 - 0.10 0.07 0.09 - 0.57 0.31 0.38 1.33 Total Average 0.05 0.23 0.28 0.95 Table 4. Comparison of natural radioactivity levels in soil and air absorbed dose at different locations of Tulkarem dis- trict-West bank-Palestine with those in other countries. Activity concentration (Bq·kg–1 ) 238U 232Th 40K Absorbed dose rate (nGy·hr–1 ) Country [Ref.] Range Average Range Average Range Average Range Average Egypt [1] 5 - 64 17 2 - 96 18 29 - 650 320 20 - 133 32 USA [1] 8 - 160 40 4 - 130 35 100 - 700 370 14 - 118 47 China [1] 2 - 440 32 1 - 360 41 9 - 1800 440 2 - 340 62 Japan [1] 6 - 98 33 2 - 88 28 15 - 990 310 21 - 77 53 Malaysia [1] 38 - 94 67 63 - 110 82 170 - 430 310 55 - 130 92 India [1] 7 - 81 29 14 - 160 64 38 - 760 400 20 - 110 56 Iran [1] 8 - 55 28 5 - 42 22 250 - 980 640 36 - 130 71 Denmark [1] 9 - 29 17 8 - 30 19 240 - 610 460 35 - 70 52 Poland [1] 5 - 120 26 4 - 77 21 110 - 970 410 18 - 97 45 Greece [1] 1 - 240 25 1 - 190 21 12 - 1570 360 30.109 56 Romania [1] 8 - 60 32 11 - 75 38 250 - 1100490 21 - 122 59 Spain [1] 6 - 250 32 2 - 210 33 25 - 1650 470 40 - 120 76 Luxembourg [1] 6 - 52 35 7 - 70 50 80 - 1800 620 14 - 73 49 Bangladesh [5] 28 - 67 48 33 - 70 53 345 - 674 481 62 - 100 77 Saudi Arabia [3] 11 - 30 15 7 - 25 11 98 - 320 225 - 23 Nigeria [15] 9 - 18 14 1 - 38 19 712 - 1098896 - - Turkey [12] - 21 - 25 144 - 401 298 - 38 Pakistan [8] 28 - 33 30 51 - 60 56 614 - 671 642 - 75 West Bank-Palestine [13] 33 - 105 69 15 - 77 48 297 - 962 630 39 - 123 88 Present study 10 - 84 35 5 - 45 24 10 - 404 120 12 - 83 36 Worldwide average [1] 17 - 60 35 11 - 64 30 140 - 850 400 18 - 93 55 Copyright © 2012 SciRes. OJSS 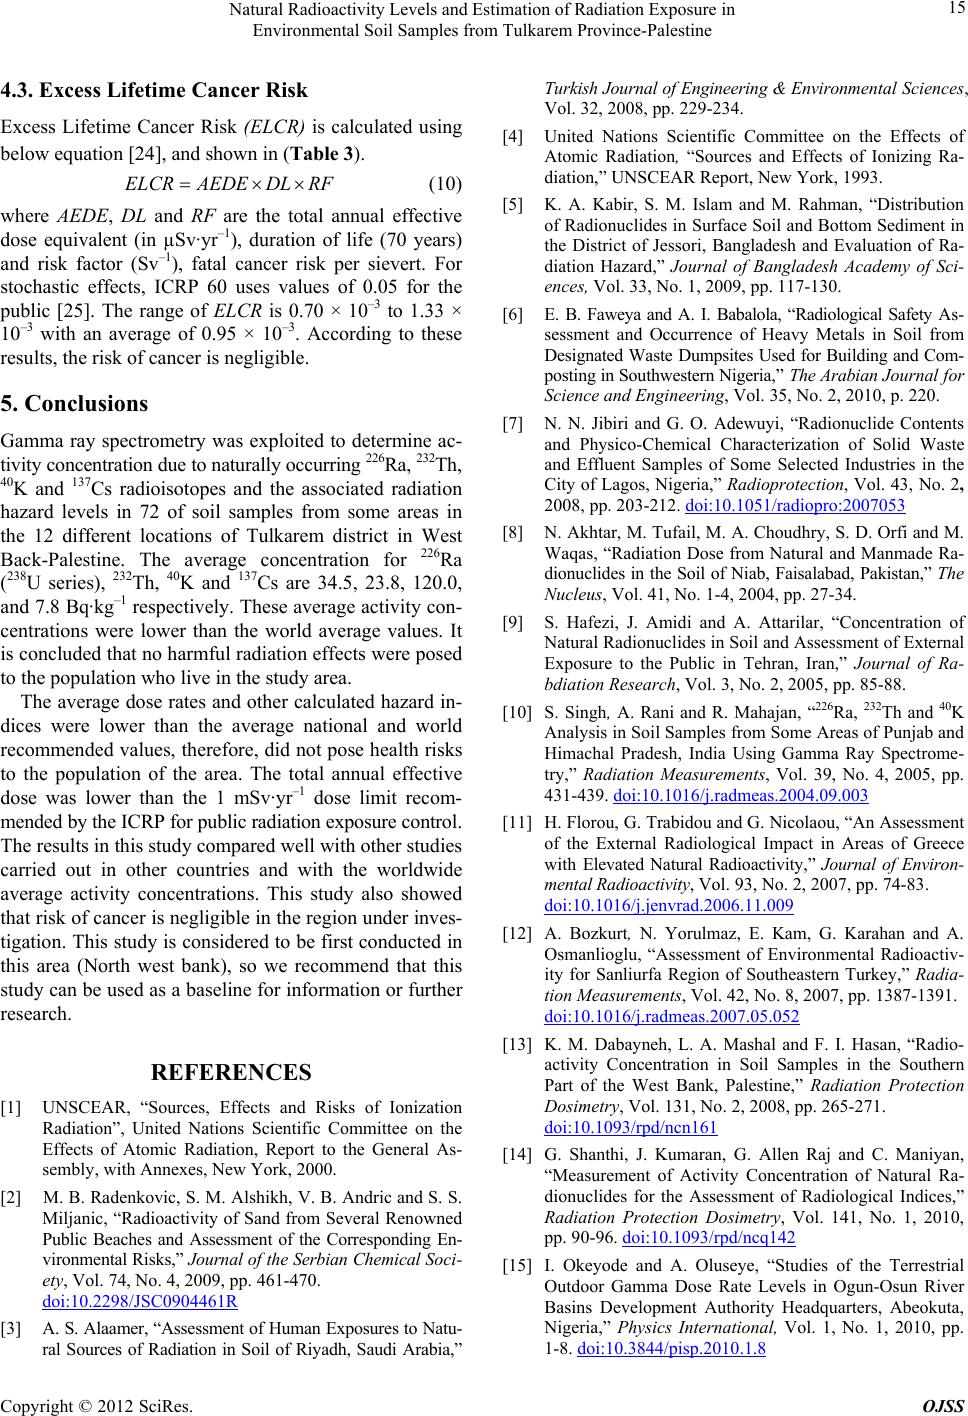 Natural Radioactivity Levels and Estimation of Radiation Exposure in Environmental Soil Samples from Tulkarem Province-Palestine 15 4.3. Excess Lifetime Cancer Risk Excess Lifetime Cancer Risk (ELCR) is calculated using below equation [24], and shown in (Table 3). ELCRAEDEDL RF (10) where AEDE, DL and RF are the total annual effective dose equivalent (in µSv·yr–1), duration of life (70 years) and risk factor (Sv–1), fatal cancer risk per sievert. For stochastic effects, ICRP 60 uses values of 0.05 for the public [25]. The range of ELCR is 0.70 × 10⁻³ to 1.33 × 10⁻³ with an average of 0.95 × 10⁻³. According to these results, the risk of cancer is negligible. 5. Conclusions Gamma ray spectrometry was exploited to determine ac- tivity concentration due to naturally occurring 226Ra, 232Th, 40K and 137Cs radioisotopes and the associated radiation hazard levels in 72 of soil samples from some areas in the 12 different locations of Tulkarem district in West Back-Palestine. The average concentration for 226Ra (238U series), 232Th, 40K and 137Cs are 34.5, 23.8, 120.0, and 7.8 Bq·kg–1 respectively. These average activity con- centrations were lower than the world average values. It is concluded that no harmful radiation effects were posed to the population who live in the study area. The average dose rates and other calculated hazard in- dices were lower than the average national and world recommended values, therefore, did not pose health risks to the population of the area. The total annual effective dose was lower than the 1 mSv·yr–1 dose limit recom- mended by the ICRP for public radiation exposure control. The results in this study compared well with other studies carried out in other countries and with the worldwide average activity concentrations. This study also showed that risk of cancer is negligible in the region under inves- tigation. This study is considered to be first conducted in this area (North west bank), so we recommend that this study can be used as a baseline for information or further research. REFERENCES [1] UNSCEAR, “Sources, Effects and Risks of Ionization Radiation”, United Nations Scientific Committee on the Effects of Atomic Radiation, Report to the General As- sembly, with Annexes, New York, 2000. [2] M. B. Radenkovic, S. M. Alshikh, V. B. Andric and S. S. Miljanic, “Radioactivity of Sand from Several Renowned Public Beaches and Assessment of the Corresponding En- vironmental Risks,” Journal of the Serbian Chemical Soci- ety, Vol. 74, No. 4, 2009, pp. 461-470. doi:10.2298/JSC0904461R [3] A. S. Alaamer, “Assessment of Human Exposures to Natu- ral Sources of Radiation in Soil of Riyadh, Saudi Arabia,” Turkish Journal of Engineering & Environmental Sciences, Vol. 32, 2008, pp. 229-234. [4] United Nations Scientific Committee on the Effects of Atomic Radiation, “Sources and Effects of Ionizing Ra- diation,” UNSCEAR Report, New York, 1993. [5] K. A. Kabir, S. M. Islam and M. Rahman, “Distribution of Radionuclides in Surface Soil and Bottom Sediment in the District of Jessori, Bangladesh and Evaluation of Ra- diation Hazard,” Journal of Bangladesh Academy of Sci- ences, Vol. 33, No. 1, 2009, pp. 117-130. [6] E. B. Faweya and A. I. Babalola, “Radiological Safety As- sessment and Occurrence of Heavy Metals in Soil from Designated Waste Dumpsites Used for Building and Com- posting in Southwestern Nigeria,” The Arabian Journal for Science and Engineering, Vol. 35, No. 2, 2010, p. 220. [7] N. N. Jibiri and G. O. Adewuyi, “Radionuclide Contents and Physico-Chemical Characterization of Solid Waste and Effluent Samples of Some Selected Industries in the City of Lagos, Nigeria,” R adiopro tec tion, Vol. 43, No. 2, 2008, pp. 203-212. doi:10.1051/radiopro:2007053 [8] N. Akhtar, M. Tufail, M. A. Choudhry, S. D. Orfi and M. Waqas, “Radiation Dose from Natural and Manmade Ra- dionuclides in the Soil of Niab, Faisalabad, Pakistan,” The Nucleus, Vol. 41, No. 1-4, 2004, pp. 27-34. [9] S. Hafezi, J. Amidi and A. Attarilar, “Concentration of Natural Radionuclides in Soil and Assessment of External Exposure to the Public in Tehran, Iran,” Journal of Ra- bdiation Research, Vol. 3, No. 2, 2005, pp. 85-88. [10] S. Singh, A. Rani and R. Mahajan, “226Ra, 232Th and 40K Analysis in Soil Samples from Some Areas of Punjab and Himachal Pradesh, India Using Gamma Ray Spectrome- try,” Radiation Measurements, Vol. 39, No. 4, 2005, pp. 431-439. doi:10.1016/j.radmeas.2004.09.003 [11] H. Florou, G. Trabidou and G. Nicolaou, “An Assessment of the External Radiological Impact in Areas of Greece with Elevated Natural Radioactivity,” Journal of Environ- mental Radioactivity, Vol. 93, No. 2, 2007, pp. 74-83. doi:10.1016/j.jenvrad.2006.11.009 [12] A. Bozkurt, N. Yorulmaz, E. Kam, G. Karahan and A. Osmanlioglu, “Assessment of Environmental Radioactiv- ity for Sanliurfa Region of Southeastern Turkey,” Radia- tion Measurements, Vol. 42, No. 8, 2007, pp. 1387-1391. doi:10.1016/j.radmeas.2007.05.052 [13] K. M. Dabayneh, L. A. Mashal and F. I. Hasan, “Radio- activity Concentration in Soil Samples in the Southern Part of the West Bank, Palestine,” Radiation Protection Dosimetry, Vol. 131, No. 2, 2008, pp. 265-271. doi:10.1093/rpd/ncn161 [14] G. Shanthi, J. Kumaran, G. Allen Raj and C. Maniyan, “Measurement of Activity Concentration of Natural Ra- dionuclides for the Assessment of Radiological Indices,” Radiation Protection Dosimetry, Vol. 141, No. 1, 2010, pp. 90-96. doi:10.1093/rpd/ncq142 [15] I. Okeyode and A. Oluseye, “Studies of the Terrestrial Outdoor Gamma Dose Rate Levels in Ogun-Osun River Basins Development Authority Headquarters, Abeokuta, Nigeria,” Physics International, Vol. 1, No. 1, 2010, pp. 1-8. doi:10.3844/pisp.2010.1.8 Copyright © 2012 SciRes. OJSS  Natural Radioactivity Levels and Estimation of Radiation Exposure in Environmental Soil Samples from Tulkarem Province-Palestine 16 [16] R. Ramola1, V. Choubey, G. Prasad, G. Gusain, Z. Tosheva and A. Kies, “Radionuclide Analysis in the Soil of Ku- maun Himalaya, India, Using Gamma Ray Spectrometry,” Current Science, Vol. 100, No. 6, 2011, pp. 906-914. [17] R. Mehra, S. Kumar, R. Sonkawade, N. Singh and K. Badhan, “Analysis of Terrestrial Naturally Occurring Ra- dionuclides in Soil Samples from Some Areas of Sirsa district of Haryana, India Using Gamma Ray Spectrome- try,” Environmental Earth Sciences, Vol. 59, No. 5, 2009, pp. 1159-1164. doi:10.1007/s12665-009-0108-3 [18] M. Uosif, “Gamma-Ray Spectroscopic Analysis of Se- lected Samples from the Nile River Sediments in Upper Egypt,” Radiation Protection Dosimetry, Vol. 123, No. 2, 2007, pp. 215-220. doi:10.1093/rpd/ncl103 [19] N. Huy and T. Luyen, “Study of External Exposure Doses from Terrestrial Radioactivity in Southern Vietnam,” Ra- diation Protection Dosimetry, Vol. 118, No. 3, 2005, pp. 331-336. doi:10.1093/rpd/nci341 [20] J. Beretka and P. Mathew, “Natural Radioactivity of Aus- tralian Building Materials, Industrial Wastes and by Prod- ucts,” Health Physics, Vol. 48, No. 1, 1995, pp. 87-95. doi:10.1097/00004032-198501000-00007 [21] V. Ramasamy, S. Senthil, V. Meenakshisundaram and V. Gajendran, “Measurement of Natural Radioactivity in Beach Sediments from North East Coast of Tamilnadu, India,” Research Journal of Applied Sciences, Engineer- ing and Technology, Vol. 1, No. 2, 2009, pp. 54-58. [22] N. Akhtar, M. Ashraf, M. Tifail, M. Iqbal and S. Orfi, “Radiometric and Chemical Analysis of Saline Soil Sam- ples of Pacca Anna, Faisalabad,” Journal of Research, Vol. 14, No. 1, 2003, pp. 49-59. [23] The International Commission on Radiological Protection, “Recommendations of the ICRP, Publication 60,” Perga- mon Publication, Oxford, 1990. [24] V. Ramasamy, G. Suresh, V. Meenakshisundaram and V. Gajendran, “Evaluation of Natural Radionuclide Content in River Sediments and Excess Lifetime Cancer Risk Due to Gamma Radioactivity,” Research Journal of Environ- mental and Earth Sciences, Vol. 1, No. 1, 2009, pp. 6-10. [25] H. Taskin, M. Karavus, P. Ay, A. Topuzoglu, S. Hindiro- glu and G. Karahan, “Radionuclide Concentrations in Soil and Lifetime Cancer Risk Due to the Gamma Radioactiv- ity in Kirklareli, Turkey,” Journal of Environmental Ra- dioactivity, Vol. 100, No. 1, 2009, pp. 49-53. doi:10.1016/j.jenvrad.2008.10.012 Copyright © 2012 SciRes. OJSS |