

Paper Menu >>
Journal Menu >>
 J. Biomedical Science and Engineering, 2010, 3, 529-537 doi:10.4236/jbise.2010.35074 Published Online May 2010 (http://www.SciRP.org/journal/jbise/ JBiSE ). Published Online May 2010 in SciRes. http://www.scirp.org/journal/jbise Predicting heat-stressed EEG spectra by self-organising feature map and learning vector quantizers ——SOFM and LVQ based stress prediction Prabhat Kumar Upadhyay1, Rakesh Kumar Sinha2, Bhuwan Mohan Karan3 1Department of Electrical and Electronics Engineering, Birla Institute of Technology, Ranchi, India; 2Department of Biomedical Instrumentation, Birla Institute of Technology, Ranchi, India; 3Department of Electrical and Electronics Engineering, Birla Institute of Technology, Ranchi, India. Email: [email protected]; [email protected] Received 9 December 2009; revised 28 December 2009; accepted 30 December 2009. ABSTRACT Self-Organising Feature Map (SOFM) along with learning vector quantizers (LVQ) have been designed to identify the alterations in brain electrical poten- tials due to exposure to high environmental heat in rats. Three groups of rats were considered—acute heat stressed, chronic heat stressed and control groups. After long EEG recordings following heat exposure, EEG data representing three different vi- gilance states such as slow wave sleep (SWS), rapid eye movement (REM) sleep and AWAKE were visu- ally selected and further subdivided into 2 seconds long epoch. In order to evaluate the performance of artificial neural network (ANN) in recognizing chronic and acute effects of heat stress with respect to the control subjects, unsupervised learning algorithm was applied on EEG data. Mean performance of SOFM with quadratic taper function was found to be better (chronic-92.6%, acute-93.2%) over the other two tapers. The effect of LVQ after the initial SOFM training seems explicit giving rise to considerable improvements in performance in terms of selectivity and sensitivity. The percentage increase in selectivity with uniform taper function is maximum for chronic and its control group (4.01%) and minimum for acute group (1.29%) whereas, with Gaussian it is al- most identical (chronic-2.57%, acute-2.03%, control- 2.33%). Quadratic taper function gives rise to an in- crease of 2.41% for chronic, 1.96% for acute and 2.91% for control patterns. Keywords: ANN; EEG; Heat Stress; SOFM; LVQ 1. INTRODUCTION The scientific interest of stress in relevance to health and disease began to develop in the 20th century, when Selye started his work on stress with more suited scientific analysis, and now stress has been accepted to be a state, comprised of certain psychophysiological reactions that prepare an organism for action. It is usually described to be an essential component that is enabling the organism to survive in the hostile environment and to make an effort to compensate with the altered situation of the stressful conditions. Stress has been defined as nonspe- cific responses of the body to any demand. Though in some respect, every demand made on the body is unique and specific, but all stress, however, have one thing in common; they increase the demand for the readjustment for performance of adaptive functions, which reestablish normally. Generally, stress is meant to be acute or at least of a limited duration. The time limited nature of this process renders its accompanying antianabolic, catabolic and immunosuppressive effects temporarily beneficial and of no adverse consequences. Chroni- cally and excessiveness of stress system activation, on the other hand, would lead to the syndromal state that severe chronic disease of any etiology could present with anorexia, loss of weight, depression, and peptic ulcers. Although, the problems of heat-afflicted illness are receiving increased importance in view of the current estimates of global warming and its impact on biological systems, the etiological factors that lead to heat exhaus- tion and heat stroke have not been well established. However, the failure of cardiovascular system had been thought to be an important factor. Inadequate acclimati- zation also appears to be a significant factor predispos- ing to the onset of heat stroke. Review of literature re- vealed that the afflictions and damages to the central nervous system (CNS) imposed by high environmental temperature have largely been ignored as the likely cause of heat induced mortality, although it is well known that neurochemical and cellular mechanisms of neural issues are highly temperature sensitive [1]. The conventional long term paper recording of EEG signals  530 P. K. Upadhyay et al. / J. Biomedical Science and Engineering 3 (2010) 529-537 Copyright © 2010 SciRes. JBiSE following stress events such as heat stress is not of much diagnostic value. So, computer and digital signal process- ing tools have been used to quantify the EEG signals for all three sleep-wake stages after acute and chronic heat stress. Since, long-term EEG recordings, in addition to other two channels of electrophysiological signals, EOG (Electrooculogram) and EMG (Electromyogram), reflect the variations in sleep-wake states, so the changes in sleep parameters following acute as well as chronic states were also observed. Further, to reduce the labor involved in the manual sleep staging and to analyze psychophysiological alterations, artificial neural network’s architectures were designed. Present study signifies the computerized recogni- tion of different sleep-wake states and the changes occurred in EEG signals due to exposure to high environmental heat. In the last decade, several works introduced the use of artificial neural network (ANN) as a tool for automated sleep scoring. Most of the system used spectral in- formation of the signal using Fourier transformation [2]. Computerized EEG and other electrophysiological parameters monitoring reduces the problem of huge data handling. Computerization has led to more sophisticated use of EEG, even in effective disorders, where percep- tual processes are significantly distorted [3-5]. Fourier transformation, as a conventional method, has been widely used for the standard quantitative analysis of the spectral decomposition and the clinical application of EEG signals [6]. The ANN programs were developed for the analysis of most of the works that rely on spectral analysis and power spectrum method to evaluate elec- trographic data. In an attempt to classify sleep-wake stages determined, power of FFT or power spectrum band were used for better performance of the system [3,7]. The numerical values of the power of different frequency bands were used as inputs to ANN. As multi- layer perceptron neural network (MLPNN) undergoes some limitations, the performance of SOFM has also been tested to solve the problem at hand. In the present study, an effort has been made to exploit the inherent qualities of SOFM. The results obtained from computer simulations have been found to be very encouraging. In addition to widespread application of artificial neural networks (ANNs) in diagnosis, much develop- mental work is being undertaken in signal processing and analysis of bioelectric signals. ANNs are widely used as to process raw electroencephalogram (EEG) data or features. Recently, ANNs have been employed suc- cessfully for many pattern recognition problems of elec- troencephalogram (EEG) spectral component [8-11], K-complex detection [12-13], event related potentials (ERPs) detection [14-15], classification of the evoked potentials [16-17] and the recognition of epileptic spike patterns [18-19]. Review of literature reveals that supervised ANNs have been used many times for sleep-wake state identi- fication, but the literature on the methodology for use of unsupervised ANNs are still obscure. The SOFM as proposed by T. Kohonen [20-21] follows unsupervised learning (competitive learning) and consists of a single layer feed-forward network or lattice, the neurons of which become specifically tuned to various input pat- terns through a self-organizing process. The spatial loca- tion of a neuron then corresponds to a particular feature, or group of features, of the input patterns. Output neu- rons of a topographic map are usually arranged such that each neuron has a set of neighbours. Each node of the output layer is connected with all other nodes of the same layer with inhibitory weights and competitive learning occurs among all the nodes of the output layer. The most highly activated node which has least Euclid- ean distance becomes the winner for a particular pattern. It has been realized that the trained and calibrated Self-Or- ganising Feature Map (SOFM) alone can not be used as a classifier. Hence, to increase the performance of the pattern classifier, Learning Vector Quantizers (LVQ) is applied in the trained SOFM [22]. In the present study, unsupervised ANN system using both SOFM and LVQ has been de- signed for classification of heat stressed spectra. 2. MATERIALS AND METHODS 2.1. Subjects and Electrode Implantation The experiments were carried out with male Charles Foster rats of age 12-14 weeks and weight around 180- 200 grams. The rats were individually housed in poly- propylene cages (30 cm × 20 cm × 15 cm) with drinking water and food (Hindustan Liver Limited, India) ad libi- tum. All rats were kept in an ambient environment tem- perature of 23 ± 1°C from birth and the animal room was artificially illuminated with 12 : 12 hours Light : Dark cycle, changed at 7 o’clock and 19 o’clock Indian Stan- dard Time (IST). The technique of electrode implanta- tion for polygraphic sleep recordings have been used as suggested earlier [7]. 2.2. Heat Stress Model In order to produce the effects of heat stress, rats were subjected to the Biological Oxygen Demand (BOD) in- cubator at preset temperature of 38 ± 1℃ and relative humidity 45-50%, simulated with the environmental conditions of Varanasi (India) in the months of May and June. For chronic heat stress, rats were subjected to the incubator for one hour daily for 21 days of chronic heat exposure from 8.00 a.m. to 9.00 a.m. and electrophysio- logical signals were recorded on 22nd day whereas, acute heat stressed rats were subjected to the incubator for continuous four hours of heat exposure from 8.00 a.m. to 12.00 p.m. for a single day, just before the recording of electrophysiological signals. Respective control groups of rats were placed in the incubator at room temperature  P. K. Upadhyay et al. / J. Biomedical Science and Engineering 3 (2010) 529-537 531 Copyright © 2010 SciRes. JBiSE (23 ± 1℃) and whole procedure was followed exactly similar to that of their stressed groups. 2.3. EEG Data Acquisition Four hours of continuous recordings of EEG, electro- oculogram (EOG) and electromyogram (EMG) were performed from 12 o’clock to 16 o’clock IST on the re- cording day for chronic and acute heat stressed rats through the 8 channels Electroencephalograph (EEG - 8, Recorders & Medicare Systems, India). The paper re- cordings were performed with standard amplifier setup [23] and at the chart speed of 7.5 mm/sec. The digitized data (at sampling frequency of 256 Hz) was collected, stored and processed with the help of data acquisition system (ADLiNK, 8112 HG, NuDAQ, Taiwan) and processing software (Visual Lab.-M, Version 2.0 c, Blue Pearl Laboratory, USA). 2.4. Self-Organising Feature Map and Learning Vector Quantiser With self-organised learning, no external teacher is re- quired in order to adjust the weights of the ANN, but the choice of the input data set will still reflect the general- izing ability of the ANN (as for the supervised case). It presents a method of identifying similarities (or features) in a vast (unlabelled) training set. An important advan- tage of self-organising ANNs over their supervised counterparts is that they can be exposed to and make use of vast quantities of input data for training purposes without the need for assigning labels to each input for- warded to the ANN. Let m, x, and α be the weight vector, input vector and learning rate parameter respectively then with the following rules the weights of the winning neuron as well as its neighbours are updated. )()];()([)()()1( tNifortwtxRttwtw ciiii )();()1( tNifortwtw cii where, Nc is a topological neighbourhood function centered around the winning neuron c and Ri is the neighbourhood taper function. Three different taper function-uniform, Gaussian, and Quadratic have been used for training the network, the mathematical expres- sions of which are as followed: Linear: Ri = 1, for i Nc, Gaussian: Ri = exp2 2 )1( c i N d for i Nc, Ri = 1-1.052 2 )1( c i N d for i Nc. where, di is the Euclidean distance between the weight vector wi and the winning weight vector wc. Learning rate (η) and neighbourhood size (Nc) are assumed to be time vary- ing. Two types of monotonically decreasing functions are considered here, a piecewise linear decreasing function and an exponential decreasing function. The piecewise linear function is given by: ,);()1()( max max min max 0kkif k k k k k ,;)( maxmin kkifk ,;)1()( max max min max 0kkif k k N k k NkNc .;)(maxmin kkifNkNc The piecewise exponential function is given by: .;)( ,;)( ,;)( ,;)( maxmin maxmin 1 0 maxmin maxmin )1( 0 max max maxmax kkifNkN kkifNNkN kkifk kkifk c k k k k c k k k k where, in both cases, η0 and N0 give the initial learning rate and neighborhood radius respectively, whereas ηmi n and Nmin give the respective minimum values. Here, k and µ denote iteration number and fraction of total number of iteration respectively. To achieve improved classification performance, training and calibration of the SOFM with a supervised learning scheme is followed. Learning vector quantization (LVQ) is one such technique, developed by Kohonen to fine-tune the weights of the trained SOFM in a supervised manner [22]. LVQ is a supervised technique that uses class information to move Voronoi vectors slightly in such a way as to improve the quality of the classifier decision regions. The initial values of wi before the fine-tuning with LVQ, must be such that wi represent the overall statistical density function of the input. The SOFM is suited to achieve this. Out of the three versions of the LVQ algorithm, LVQ1 has been applied in the present work, which follows the following weight update rules: )]()()[()()1( twtxttwtw iii , if i = c and x is classified correctly. )]()()[()()1( twtxttwtw iii if i = c and x is classified correctly. )]()()[()()1( twtxttwtw iii for i ≠ c. 2.5. Data Preparation and Simulation The EEG data set prepared for input space of the net- work was divided into training data set and test data set. The training data set consists of the raw EEG signals of SWS, REM and AWAKE states, each having matrix size of [1, 512]. So, the total size of the input vectors for one 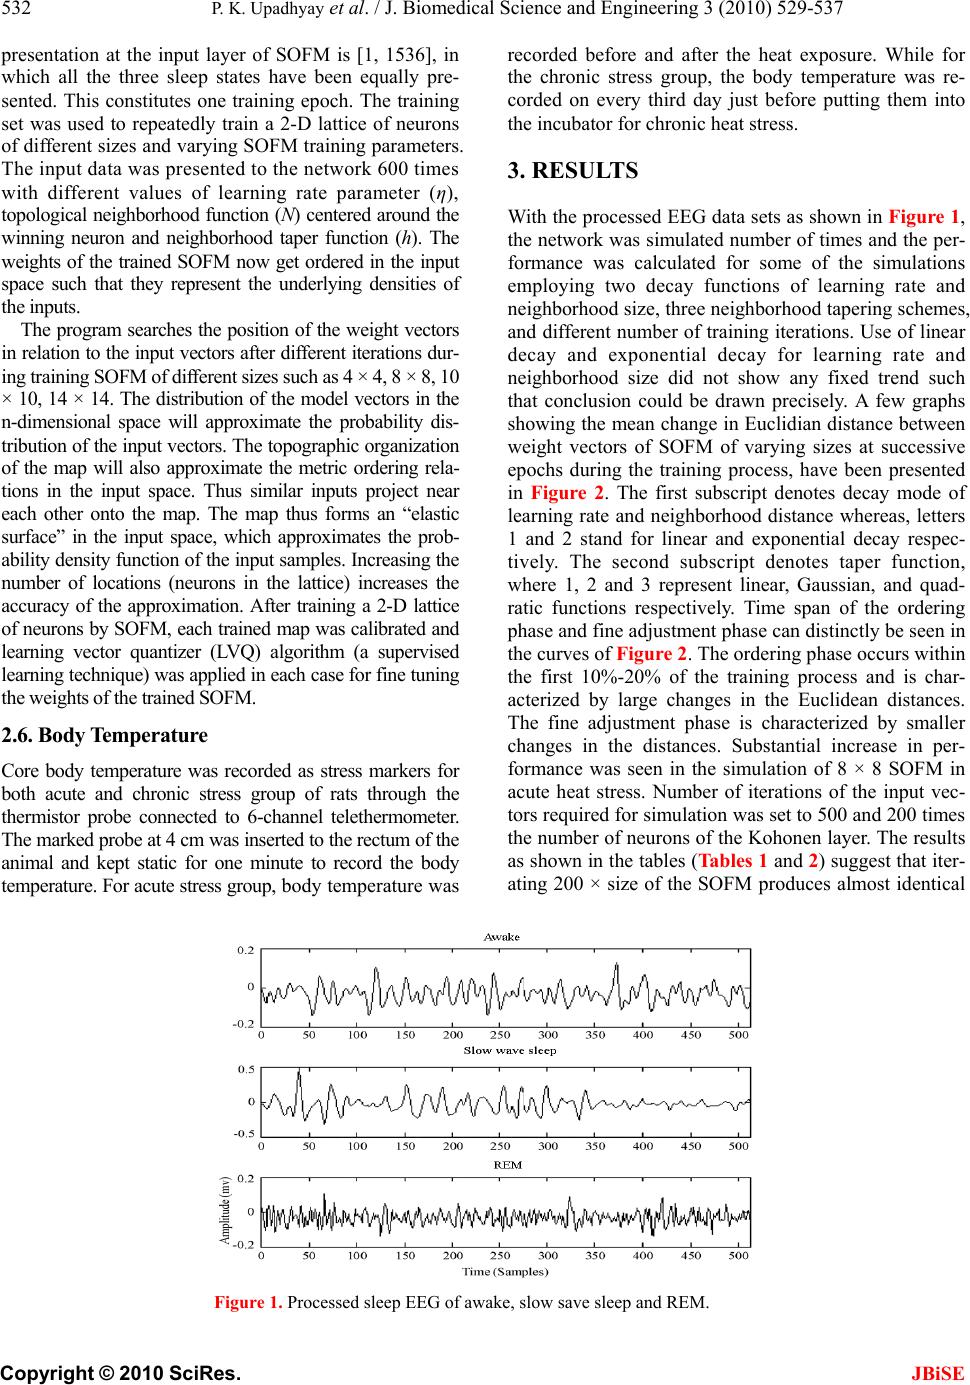 532 P. K. Upadhyay et al. / J. Biomedical Science and Engineering 3 (2010) 529-537 Copyright © 2010 SciRes. presentation at the input layer of SOFM is [1, 1536], in which all the three sleep states have been equally pre- sented. This constitutes one training epoch. The training set was used to repeatedly train a 2-D lattice of neurons of different sizes and varying SOFM training parameters. The input data was presented to the network 600 times with different values of learning rate parameter (η), topological neighborhood function (N) centered around the winning neuron and neighborhood taper function (h). The weights of the trained SOFM now get ordered in the input space such that they represent the underlying densities of the inputs. JBiSE The program searches the position of the weight vectors in relation to the input vectors after different iterations dur- ing training SOFM of different sizes such as 4 × 4, 8 × 8, 10 × 10, 14 × 14. The distribution of the model vectors in the n-dimensional space will approximate the probability dis- tribution of the input vectors. The topographic organization of the map will also approximate the metric ordering rela- tions in the input space. Thus similar inputs project near each other onto the map. The map thus forms an “elastic surface” in the input space, which approximates the prob- ability density function of the input samples. Increasing the number of locations (neurons in the lattice) increases the accuracy of the approximation. After training a 2-D lattice of neurons by SOFM, each trained map was calibrated and learning vector quantizer (LVQ) algorithm (a supervised learning technique) was applied in each case for fine tuning the weights of the trained SOFM. 2.6. Body Temperature Core body temperature was recorded as stress markers for both acute and chronic stress group of rats through the thermistor probe connected to 6-channel telethermometer. The marked probe at 4 cm was inserted to the rectum of the animal and kept static for one minute to record the body temperature. For acute stress group, body temperature was recorded before and after the heat exposure. While for the chronic stress group, the body temperature was re- corded on every third day just before putting them into the incubator for chronic heat stress. 3. RESULTS With the processed EEG data sets as shown in Figure 1, the network was simulated number of times and the per- formance was calculated for some of the simulations employing two decay functions of learning rate and neighborhood size, three neighborhood tapering schemes, and different number of training iterations. Use of linear decay and exponential decay for learning rate and neighborhood size did not show any fixed trend such that conclusion could be drawn precisely. A few graphs showing the mean change in Euclidian distance between weight vectors of SOFM of varying sizes at successive epochs during the training process, have been presented in Figure 2. The first subscript denotes decay mode of learning rate and neighborhood distance whereas, letters 1 and 2 stand for linear and exponential decay respec- tively. The second subscript denotes taper function, where 1, 2 and 3 represent linear, Gaussian, and quad- ratic functions respectively. Time span of the ordering phase and fine adjustment phase can distinctly be seen in the curves of Figure 2. The ordering phase occurs within the first 10%-20% of the training process and is char- acterized by large changes in the Euclidean distances. The fine adjustment phase is characterized by smaller changes in the distances. Substantial increase in per- formance was seen in the simulation of 8 × 8 SOFM in acute heat stress. Number of iterations of the input vec- tors required for simulation was set to 500 and 200 times the number of neurons of the Kohonen layer. The results as shown in the tables (Tables 1 and 2) suggest that iter- ating 200 × size of the SOFM produces almost identical Figure 1. Processed sleep EEG of awake, slow save sleep and REM. 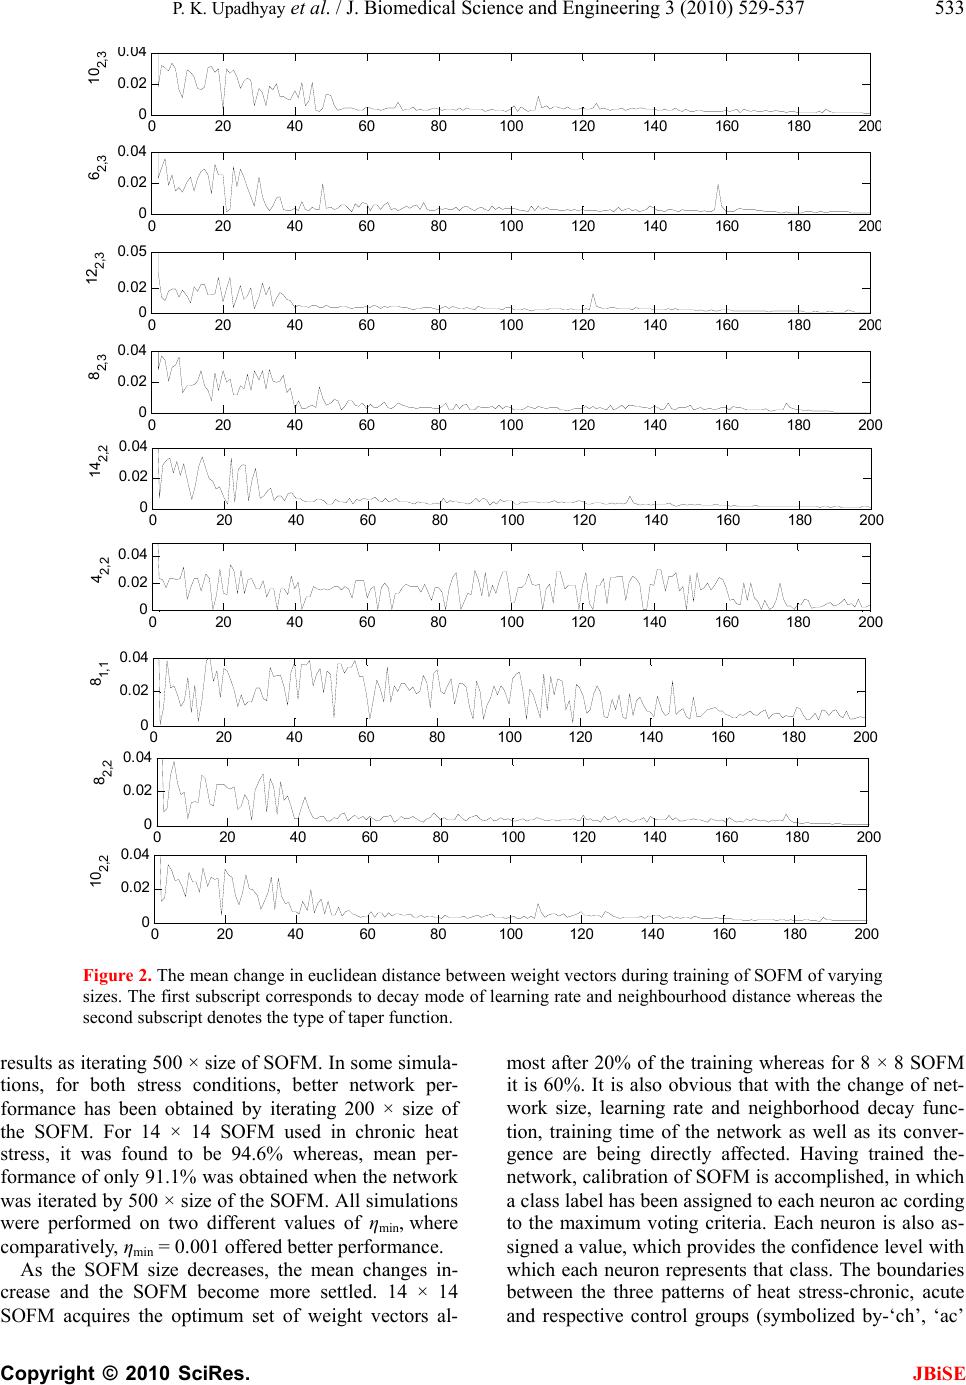 P. K. Upadhyay et al. / J. Biomedical Science and Engineering 3 (2010) 529-537 533 Copyright © 2010 SciRes. JBiSE 020 40 60 80100120140 160 180 20 0 0 0.02 0 . 04 10 2,3 020 40 60 80100120140 160 180 20 0 0 0.02 0.04 6 2,3 020 40 60 80100120140 160 180 20 0 0 0.02 0.05 12 2,3 020 40 60 80100120140 160 180200 0 0. 02 0. 04 8 2,3 020 406080100 120 140 160 180200 0 0. 02 0. 04 14 2,2 020 40 6080100 120 140160 180200 0 0. 0 2 0. 0 4 4 2,2 020 406080100 120 140160 180200 0 0. 02 0. 04 8 1,1 020 406080100 120 140160 180200 0 0. 02 0. 04 8 2,2 020 4060 80100 120 140160 180200 0 0.02 0.04 10 2,2 Figure 2. The mean change in euclidean distance between weight vectors during training of SOFM of varying sizes. The first subscript corresponds to decay mode of learning rate and neighbourhood distance whereas the second subscript denotes the type of taper function. results as iterating 500 × size of SOFM. In some simula- tions, for both stress conditions, better network per- formance has been obtained by iterating 200 × size of the SOFM. For 14 × 14 SOFM used in chronic heat stress, it was found to be 94.6% whereas, mean per- formance of only 91.1% was obtained when the network was iterated by 500 × size of the SOFM. All simulations were performed on two different values of ηmin, where comparatively, ηmin = 0.001 offered better performance. As the SOFM size decreases, the mean changes in- crease and the SOFM become more settled. 14 × 14 SOFM acquires the optimum set of weight vectors al- most after 20% of the training whereas for 8 × 8 SOFM it is 60%. It is also obvious that with the change of net- work size, learning rate and neighborhood decay func- tion, training time of the network as well as its conver- gence are being directly affected. Having trained the- network, calibration of SOFM is accomplished, in which a class label has been assigned to each neuron ac cording to the maximum voting criteria. Each neuron is also as- signed a value, which provides the confidence level with which each neuron represents that class. The boundaries between the three patterns of heat stress-chronic, acute and respective control groups (symbolized by-‘ch’, ‘ac’ 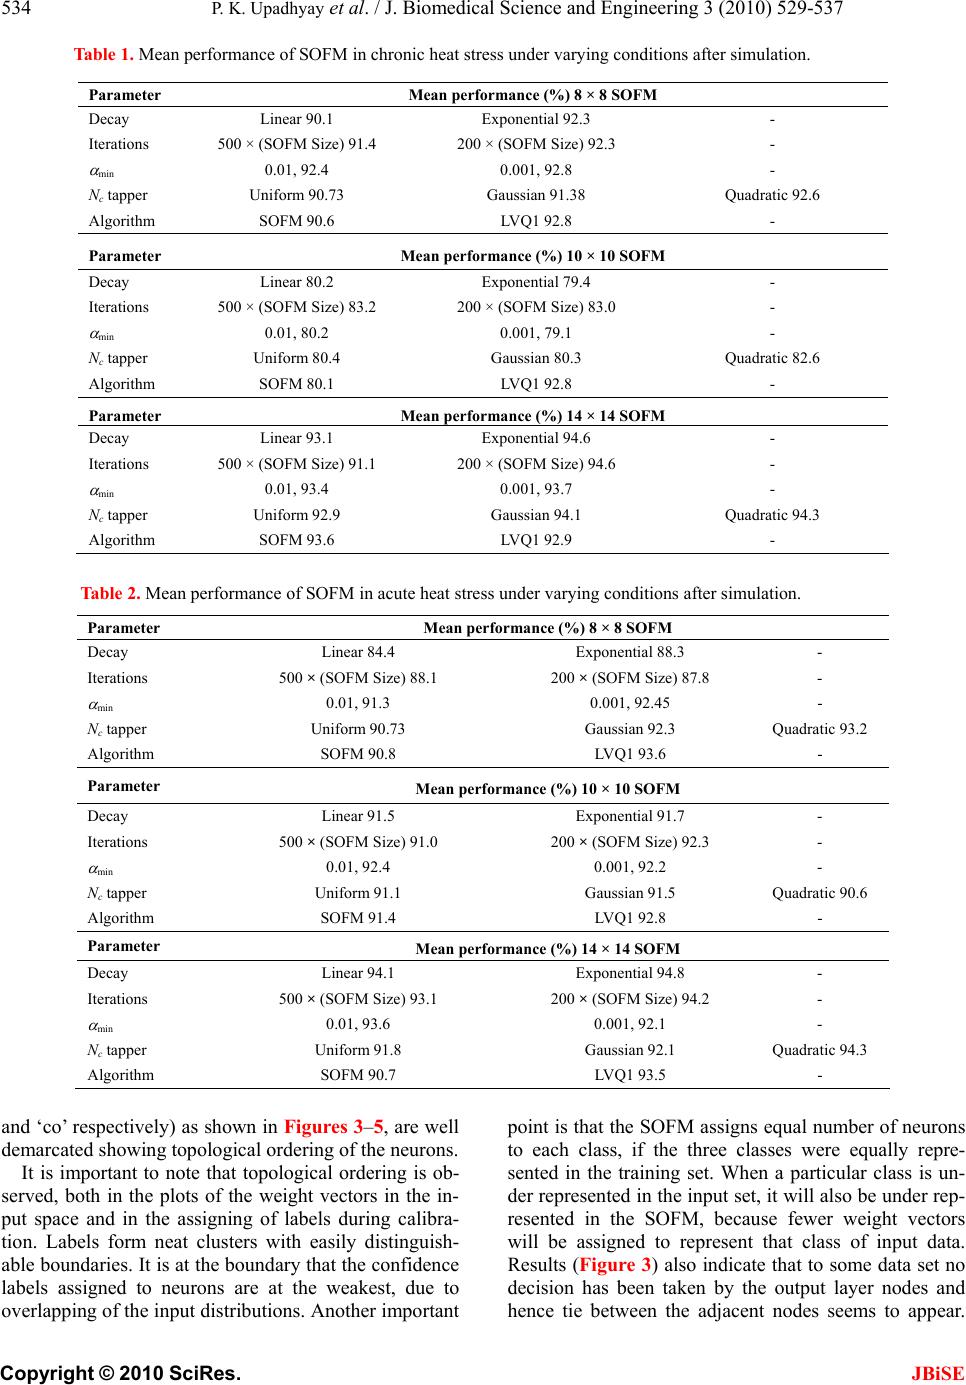 534 P. K. Upadhyay et al. / J. Biomedical Science and Engineering 3 (2010) 529-537 Copyright © 2010 SciRes. JBiSE Table 1. Mean performance of SOFM in chronic heat stress under varying conditions after simulation. Table 2. Mean performance of SOFM in acute heat stress under varying conditions after simulation. and ‘co’ respectively) as shown in Figures 3–5, are well demarcated showing topological ordering of the neurons. It is important to note that topological ordering is ob- served, both in the plots of the weight vectors in the in- put space and in the assigning of labels during calibra- tion. Labels form neat clusters with easily distinguish- able boundaries. It is at the boundary that the confidence labels assigned to neurons are at the weakest, due to overlapping of the input distributions. Another important point is that the SOFM assigns equal number of neurons to each class, if the three classes were equally repre- sented in the training set. When a particular class is un- der represented in the input set, it will also be under rep- resented in the SOFM, because fewer weight vectors will be assigned to represent that class of input data. Results (Figure 3) also indicate that to some data set no decision has been taken by the output layer nodes and hence tie between the adjacent nodes seems to appear. Parameter Mean performance (%) 8 × 8 SOFM Decay Linear 90.1 Exponential 92.3 - Iterations 500 × (SOFM Size) 91.4 200 × (SOFM Size) 92.3 - min 0.01, 92.4 0.001, 92.8 - Nc tapper Uniform 90.73 Gaussian 91.38 Quadratic 92.6 Algorithm SOFM 90.6 LVQ1 92.8 - Parameter Mean performance (%) 10 × 10 SOFM Decay Linear 80.2 Exponential 79.4 - Iterations 500 × (SOFM Size) 83.2 200 × (SOFM Size) 83.0 - min 0.01, 80.2 0.001, 79.1 - Nc tapper Uniform 80.4 Gaussian 80.3 Quadratic 82.6 Algorithm SOFM 80.1 LVQ1 92.8 - Parameter Mean performance (%) 14 × 14 SOFM Decay Linear 93.1 Exponential 94.6 - Iterations 500 × (SOFM Size) 91.1 200 × (SOFM Size) 94.6 - min 0.01, 93.4 0.001, 93.7 - Nc tapper Uniform 92.9 Gaussian 94.1 Quadratic 94.3 Algorithm SOFM 93.6 LVQ1 92.9 - Parameter Mean performance (%) 8 × 8 SOFM Decay Linear 84.4 Exponential 88.3 - Iterations 500 × (SOFM Size) 88.1 200 × (SOFM Size) 87.8 - min 0.01, 91.3 0.001, 92.45 - Nc tapper Uniform 90.73 Gaussian 92.3 Quadratic 93.2 Algorithm SOFM 90.8 LVQ1 93.6 - Parameter Mean performance (%) 10 × 10 SOFM Decay Linear 91.5 Exponential 91.7 - Iterations 500 × (SOFM Size) 91.0 200 × (SOFM Size) 92.3 - min 0.01, 92.4 0.001, 92.2 - Nc tapper Uniform 91.1 Gaussian 91.5 Quadratic 90.6 Algorithm SOFM 91.4 LVQ1 92.8 - Parameter Mean performance (%) 14 × 14 SOFM Decay Linear 94.1 Exponential 94.8 - Iterations 500 × (SOFM Size) 93.1 200 × (SOFM Size) 94.2 - min 0.01, 93.6 0.001, 92.1 - Nc tapper Uniform 91.8 Gaussian 92.1 Quadratic 94.3 Algorithm SOFM 90.7 LVQ1 93.5 - 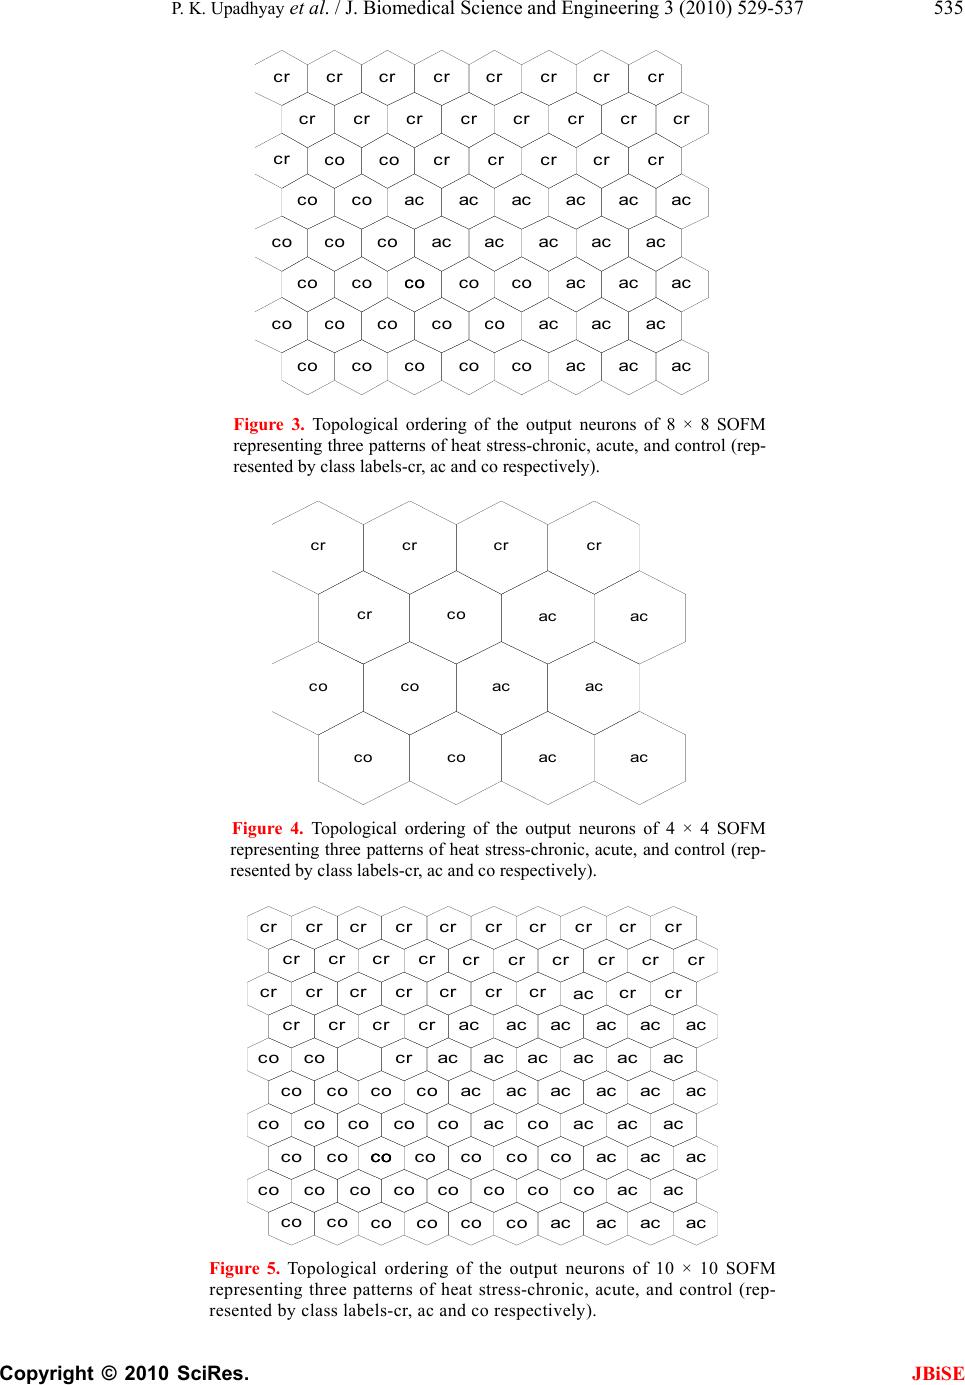 P. K. Upadhyay et al. / J. Biomedical Science and Engineering 3 (2010) 529-537 535 Copyright © 2010 SciRes. JBiSE cr cr cr co co co co co cr cr co co co co co co cr cr cr ac co co co co cr cr ac ac co co co cr cr ac ac co co co cr cr ac ac ac ac ac cr cr cr ac ac ac ac ac cr cr cr ac ac ac ac ac crcr co co Figure 3. Topological ordering of the output neurons of 8 × 8 SOFM representing three patterns of heat stress-chronic, acute, and control (rep- resented by class labels-cr, ac and co respectively). cr co co co cr co co cr ac ac ac cr ac ac ac cr Figure 4. Topological ordering of the output neurons of 4 × 4 SOFM representing three patterns of heat stress-chronic, acute, and control (rep- resented by class labels-cr, ac and co respectively). cr cr cr cr co co co co co co cr cr cr cr co co co co co co cr cr cr cr co co co co cr cr cr cr cr co co co co co cr cr cr ac ac co co co cr cr cr ac ac ac ac co co co cr cr cr ac ac co co co ac cr cr ac ac ac ac ac co ac cr cr cr ac ac ac ac ac ac ac cr cr cr ac ac ac ac ac ac ac coco co co ac acac Figure 5. Topological ordering of the output neurons of 10 × 10 SOFM representing three patterns of heat stress-chronic, acute, and control (rep- resented by class labels-cr, ac and co respectively). 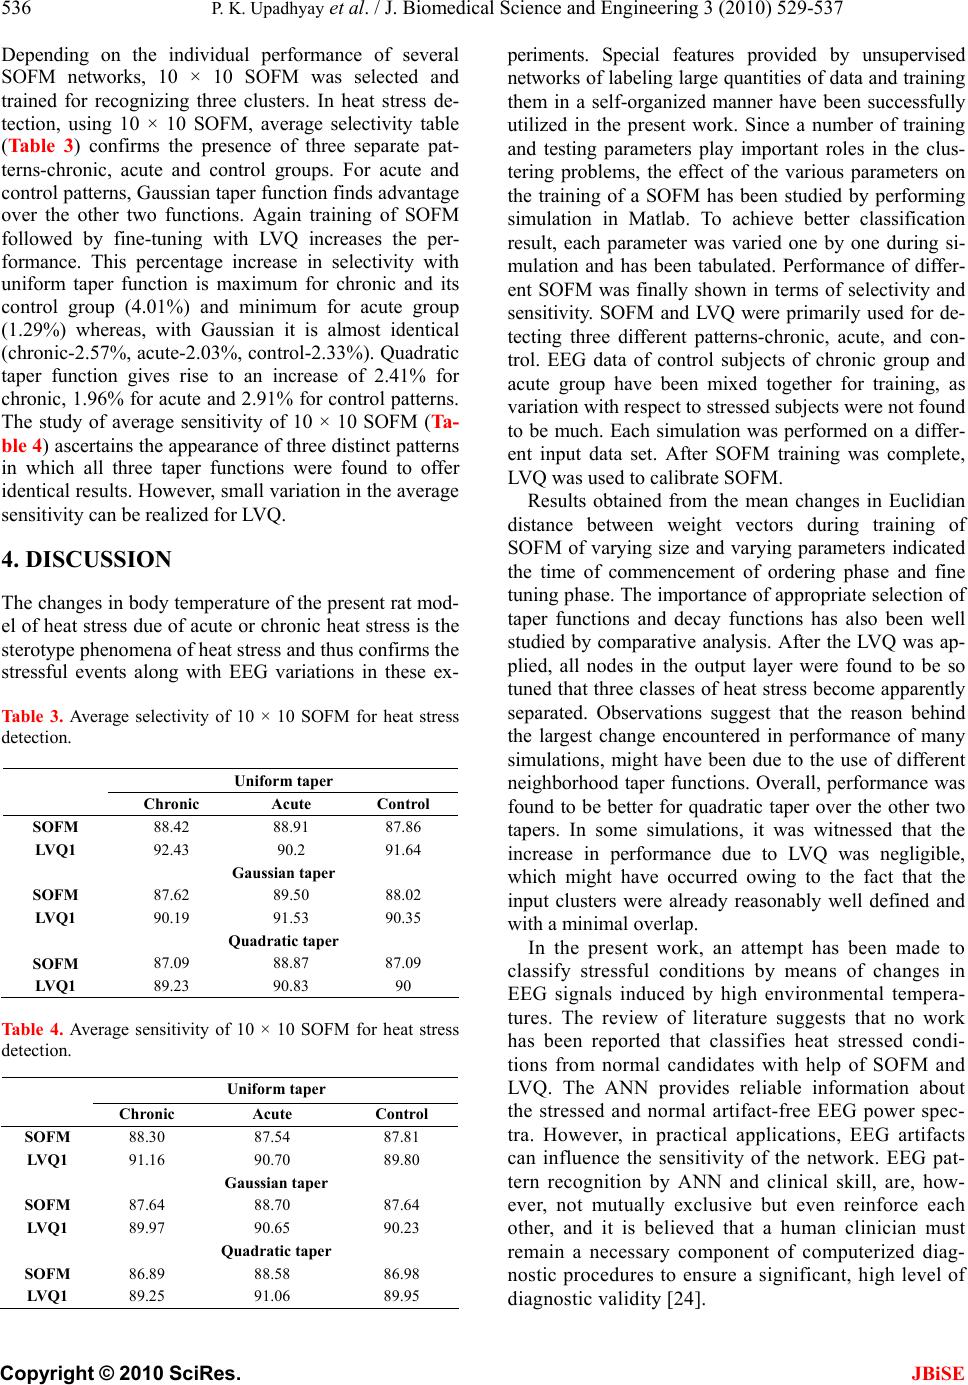 536 P. K. Upadhyay et al. / J. Biomedical Science and Engineering 3 (2010) 529-537 Copyright © 2010 SciRes. JBiSE Depending on the individual performance of several SOFM networks, 10 × 10 SOFM was selected and trained for recognizing three clusters. In heat stress de- tection, using 10 × 10 SOFM, average selectivity table (Table 3) confirms the presence of three separate pat- terns-chronic, acute and control groups. For acute and control patterns, Gaussian taper function finds advantage over the other two functions. Again training of SOFM followed by fine-tuning with LVQ increases the per- formance. This percentage increase in selectivity with uniform taper function is maximum for chronic and its control group (4.01%) and minimum for acute group (1.29%) whereas, with Gaussian it is almost identical (chronic-2.57%, acute-2.03%, control-2.33%). Quadratic taper function gives rise to an increase of 2.41% for chronic, 1.96% for acute and 2.91% for control patterns. The study of average sensitivity of 10 × 10 SOFM (Ta- ble 4) ascertains the appearance of three distinct patterns in which all three taper functions were found to offer identical results. However, small variation in the average sensitivity can be realized for LVQ. 4. DISCUSSION The changes in body temperature of the present rat mod- el of heat stress due of acute or chronic heat stress is the sterotype phenomena of heat stress and thus confirms the stressful events along with EEG variations in these ex- Table 3. Average selectivity of 10 × 10 SOFM for heat stress detection. Table 4. Average sensitivity of 10 × 10 SOFM for heat stress detection. periments. Special features provided by unsupervised networks of labeling large quantities of data and training them in a self-organized manner have been successfully utilized in the present work. Since a number of training and testing parameters play important roles in the clus- tering problems, the effect of the various parameters on the training of a SOFM has been studied by performing simulation in Matlab. To achieve better classification result, each parameter was varied one by one during si- mulation and has been tabulated. Performance of differ- ent SOFM was finally shown in terms of selectivity and sensitivity. SOFM and LVQ were primarily used for de- tecting three different patterns-chronic, acute, and con- trol. EEG data of control subjects of chronic group and acute group have been mixed together for training, as variation with respect to stressed subjects were not found to be much. Each simulation was performed on a differ- ent input data set. After SOFM training was complete, LVQ was used to calibrate SOFM. Results obtained from the mean changes in Euclidian distance between weight vectors during training of SOFM of varying size and varying parameters indicated the time of commencement of ordering phase and fine tuning phase. The importance of appropriate selection of taper functions and decay functions has also been well studied by comparative analysis. After the LVQ was ap- plied, all nodes in the output layer were found to be so tuned that three classes of heat stress become apparently separated. Observations suggest that the reason behind the largest change encountered in performance of many simulations, might have been due to the use of different neighborhood taper functions. Overall, performance was found to be better for quadratic taper over the other two tapers. In some simulations, it was witnessed that the increase in performance due to LVQ was negligible, which might have occurred owing to the fact that the input clusters were already reasonably well defined and with a minimal overlap. In the present work, an attempt has been made to classify stressful conditions by means of changes in EEG signals induced by high environmental tempera- tures. The review of literature suggests that no work has been reported that classifies heat stressed condi- tions from normal candidates with help of SOFM and LVQ. The ANN provides reliable information about the stressed and normal artifact-free EEG power spec- tra. However, in practical applications, EEG artifacts can influence the sensitivity of the network. EEG pat- tern recognition by ANN and clinical skill, are, how- ever, not mutually exclusive but even reinforce each other, and it is believed that a human clinician must remain a necessary component of computerized diag- nostic procedures to ensure a significant, high level of diagnostic validity [24]. Uniform taper Chronic Acute Control SOFM 88.42 88.91 87.86 LVQ1 92.43 90.2 91.64 Gaussian taper SOFM 87.62 89.50 88.02 LVQ1 90.19 91.53 90.35 Quadratic taper SOFM 87.09 88.87 87.09 LVQ1 89.23 90.83 90 Uniform taper Chronic Acute Control SOFM 88.30 87.54 87.81 LVQ1 91.16 90.70 89.80 Gaussian taper SOFM 87.64 88.70 87.64 LVQ1 89.97 90.65 90.23 Quadratic taper SOFM 86.89 88.58 86.98 LVQ1 89.25 91.06 89.95 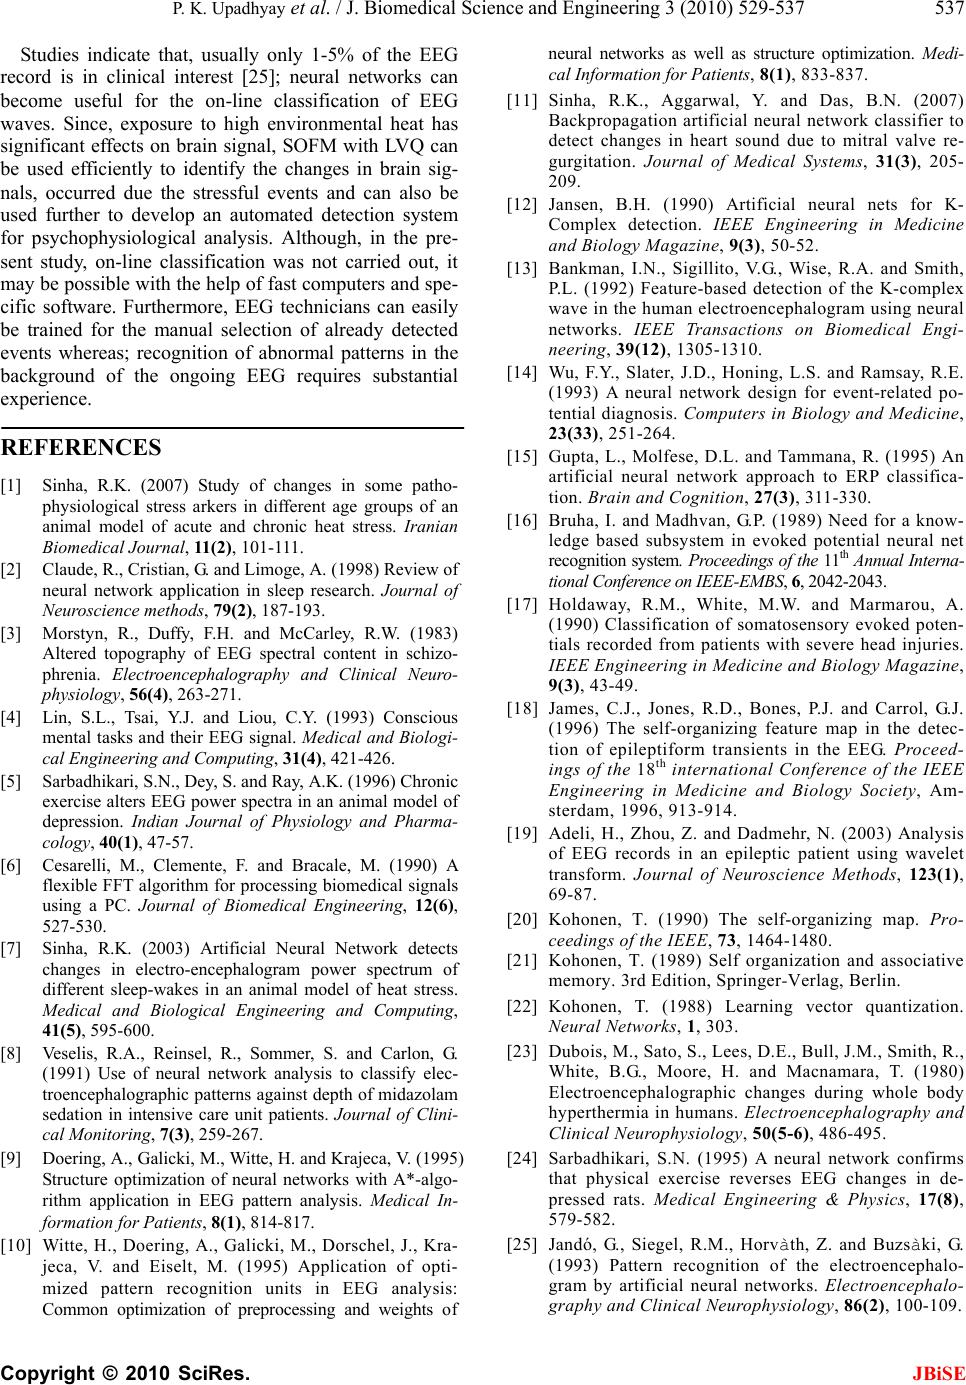 P. K. Upadhyay et al. / J. Biomedical Science and Engineering 3 (2010) 529-537 537 Copyright © 2010 SciRes. Studies indicate that, usually only 1-5% of the EEG record is in clinical interest [25]; neural networks can become useful for the on-line classification of EEG waves. Since, exposure to high environmental heat has significant effects on brain signal, SOFM with LVQ can be used efficiently to identify the changes in brain sig- nals, occurred due the stressful events and can also be used further to develop an automated detection system for psychophysiological analysis. Although, in the pre- sent study, on-line classification was not carried out, it may be possible with the help of fast computers and spe- cific software. Furthermore, EEG technicians can easily be trained for the manual selection of already detected events whereas; recognition of abnormal patterns in the background of the ongoing EEG requires substantial experience. JBiSE REFERENCES [1] Sinha, R.K. (2007) Study of changes in some patho- physiological stress arkers in different age groups of an animal model of acute and chronic heat stress. Iranian Biomedical Journal, 11(2), 101-111. [2] Claude, R., Cristian, G. and Limoge, A. (1998) Review of neural network application in sleep research. Journal of Neuroscience methods, 79(2), 187-193. [3] Morstyn, R., Duffy, F.H. and McCarley, R.W. (1983) Altered topography of EEG spectral content in schizo- phrenia. Electroencephalography and Clinical Neuro- physiology, 56(4), 263-271. [4] Lin, S.L., Tsai, Y.J. and Liou, C.Y. (1993) Conscious mental tasks and their EEG signal. Medical and Biologi- cal Engineering and Computing, 31(4), 421-426. [5] Sarbadhikari, S.N., Dey, S. and Ray, A.K. (1996) Chronic exercise alters EEG power spectra in an animal model of depression. Indian Journal of Physiology and Pharma- cology, 40(1), 47-57. [6] Cesarelli, M., Clemente, F. and Bracale, M. (1990) A flexible FFT algorithm for processing biomedical signals using a PC. Journal of Biomedical Engineering, 12(6), 527-530. [7] Sinha, R.K. (2003) Artificial Neural Network detects changes in electro-encephalogram power spectrum of different sleep-wakes in an animal model of heat stress. Medical and Biological Engineering and Computing, 41(5), 595-600. [8] Veselis, R.A., Reinsel, R., Sommer, S. and Carlon, G. (1991) Use of neural network analysis to classify elec- troencephalographic patterns against depth of midazolam sedation in intensive care unit patients. Journal of Clini- cal Monitoring, 7(3), 259-267. [9] Doering, A., Galicki, M., Witte, H. and Krajeca, V. (1995) Structure optimization of neural networks with A*-algo- rithm application in EEG pattern analysis. Medical In- formation for Patients, 8(1), 814-817. [10] Witte, H., Doering, A., Galicki, M., Dorschel, J., Kra- jeca, V. and Eiselt, M. (1995) Application of opti- mized pattern recognition units in EEG analysis: Common optimization of preprocessing and weights of neural networks as well as structure optimization. Medi- cal Information for Patients, 8(1), 833-837. [11] Sinha, R.K., Aggarwal, Y. and Das, B.N. (2007) Backpropagation artificial neural network classifier to detect changes in heart sound due to mitral valve re- gurgitation. Journal of Medical Systems, 31(3), 205- 209. [12] Jansen, B.H. (1990) Artificial neural nets for K- Complex detection. IEEE Engineering in Medicine and Biology Magazine, 9(3), 50-52. [13] Bankman, I.N., Sigillito, V.G., Wise, R.A. and Smith, P.L. (1992) Feature-based detection of the K-complex wave in the human electroencephalogram using neural networks. IEEE Transactions on Biomedical Engi- neering, 39(12), 1305-1310. [14] Wu, F.Y., Slater, J.D., Honing, L.S. and Ramsay, R.E. (1993) A neural network design for event-related po- tential diagnosis. Computers in Biology and Medicine, 23(33), 251-264. [15] Gupta, L., Molfese, D.L. and Tammana, R. (1995) An artificial neural network approach to ERP classifica- tion. Brain and Cognition, 27(3), 311-330. [16] Bruha, I. and Madhvan, G.P. (1989) Need for a know- ledge based subsystem in evoked potential neural net recognition system. Proceedings of the 11 th Annual Interna- tional Conference on IEEE-EMBS, 6, 2042-2043. [17] Holdaway, R.M., White, M.W. and Marmarou, A. (1990) Classification of somatosensory evoked poten- tials recorded from patients with severe head injuries. IEEE Engineering in Medicine and Biology Magazine, 9(3), 43-49. [18] James, C.J., Jones, R.D., Bones, P.J. and Carrol, G.J. (1996) The self-organizing feature map in the detec- tion of epileptiform transients in the EEG. Proceed- ings of the 18th international Conference of the IEEE Engineering in Medicine and Biology Society, Am- sterdam, 1996, 913-914. [19] Adeli, H., Zhou, Z. and Dadmehr, N. (2003) Analysis of EEG records in an epileptic patient using wavelet transform. Journal of Neuroscience Methods, 123(1), 69-87. [20] Kohonen, T. (1990) The self-organizing map. Pro- ceedings of the IEEE, 73, 1464-1480. [21] Kohonen, T. (1989) Self organization and associative memory. 3rd Edition, Springer-Verlag, Berlin. [22] Kohonen, T. (1988) Learning vector quantization. Neural Networks, 1, 303. [23] Dubois, M., Sato, S., Lees, D.E., Bull, J.M., Smith, R., White, B.G., Moore, H. and Macnamara, T. (1980) Electroencephalographic changes during whole body hyperthermia in humans. Electroencephalography and Clinical Neurophysiology, 50(5-6), 486-495. [24] Sarbadhikari, S.N. (1995) A neural network confirms that physical exercise reverses EEG changes in de- pressed rats. Medical Engineering & Physics, 17(8), 579-582. [25] Jandó, G., Siegel, R.M., Horvàth, Z. and Buzsàki, G. (1993) Pattern recognition of the electroencephalo- gram by artificial neural networks. Electroencephalo- graphy and Clinical Neurophysiology, 86(2), 100-109. |