

Paper Menu >>
Journal Menu >>
 Advances in Applied Sociology 2012. Vol.2, No.1, 1-6 Published Online March 2012 in SciRes (http://www.SciRP.org/journal/aasoci) http://dx.doi.org/10.4236/aasoci.2012.21001 Copyright © 2012 SciRes. 1 Processes Associated with Afforestation near Public Lands Zola K. Moon, Frank L. Farmer University of Arkansas, Fayetteville, USA Email: [email protected] Received December 21st, 2011; revised January 18th, 2012; accepted February 4th, 2012 This paper empirically examines patterns of afforestation in vicinities immediately surrounding National Park/National River and National Forest lands. The public lands (Ozark National Forest and Buffalo Na- tional River) are found on the Ozark Plateau and represent different management mandates. A spatial lag model is presented comparing two LANDSAT images in conjunction with sociodemographic measures covering the same time period. The findings here make two important points. First, the public land boundaries are shown to act as ecological switches. Second, results underscore the importance of under- standing how publicly managed lands with different mandates function within the larger social as well as geophysical landscape matrix. Empirical evidence demonstrates that public lands set aside for “preserva- tion” (Buffalo National River) are associated with greater afforestation, whereas public lands set aside for “conservation and use of natural resources” (Ozark National Forest) are surrounded by less afforestation. Keywords: Landcover Change; Afforestation; LANDSAT; Spatial Lag Regression; Public Lands Introduction Public lands have been set aside around the world for a vari- ety of reasons. The rationale for these publicly managed lands can range from safeguarding a natural landscape or protecting the habitat of a particular species to conserving forests for fu- ture utilization. Human interaction with the landscapes in and around these public lands is a matter of concern in that those activities may threaten the very resources the public lands are designed to protect. Stated differently, the very act of setting aside land may serve to threaten those resources that originally stimulated the protective effort. Embedded in the discussion of land use near protected areas is the impact of changes in human activities near protected landscapes, especially forests. Mixed empirical results have been found—in some cases, increases in population result in more deforestation and development; in other cases, the role of population is less clear or not important (see for examples Frentz et al., 2004; Lambin & Geist, 2006). Previous research on changes in land cover close to public land boundaries has established that impacts differ by type of public land and oper- ate in a complex manner (Moon & Farmer, 2010). The current paper provides an empirical model demonstrating the complex- ity of afforestation1 patterns resulting from the interaction of human populations with the surrounding landscape. This re- search purposefully builds on previous lines of inquiry (Moon & Farmer, 2010) and specifically considers whether afforesta- tion, a different type of land cover change, operates differently. The specific focus of the current research is afforestation rather than deforestation or forest loss. Deforestation is often the focus of land cover research projects (see for examples Bhattarai & Hammig, 2001; Carr, Suter, & Barbieri, 2005; Kok, 2004; Lam- bin & Geist, 2003; Laurance et al., 2002; Perz, 2002; Radeloff et al., 2001) because of its often deleterious environmental im- pacts. However, the processes surrounding afforestation are of import as well, on the assumption that afforestation at least partially remediates negative consequences of forest loss, in- cluding carbon sequestration, erosion control, and non-con- sumptive use of forest products. The empirical evidence pre- sented here underscores the importance of understanding how publicly managed lands function within the larger landscape matrix. Analytic Framework Two main concepts underlie the empirical orientation of this research. The first is conceptualizing the public land boundaries as an ecological switch (Wilson & King, 1995). A switch is defined as a behavior or condition that results in changes in vegetation such that those changes reinforce the behavior or condition, forming a positive feedback loop. An example of an ecological switch would be the processes surrounding a mown pasture. If a person selectively mows a region in a pasture, the next mower is likely to follow the evident outline of the previ- ous mowing session. The “boundary” is provided by the taller grass that has not been mown. The presence of the boundary induces mowing up to the boundary but not beyond, maintain- ing the behavior. With continuation of this pattern, the actual mix of speciation of grasses will change as shorter grasses in- crease in the mown area while taller grasses are more success- ful in the unmown area. Thus the mowing process produces an ecological switch. 1Afforestation is the establishment of a forest or stand in an area where the preceding vegetation or land use was not forest while reforestation is the reestablishment of previously existing forest cover. While some areas in the study area may be reforested in that prior to 1993 these areas were forest stands, the definition used in the study is technically the measurement o f those lands that were not classified forest in the beginning of the timeframe (1993) but are by the end of the study timeframe (2004). Given a different temporal framework, some of these areas could be considered reforesting. The second concept in the grounding of this research relates to forest transition theory. Some researchers have presented the concept of a “forest transition”, in some ways similar to the demographic transition (Caldwell, 1976), as an explanation for the pattern of rapid deforestation followed by a slower affore-  Z. K. MOON ET AL. station (Mather, 1992; Mather & Needle, 1998; Rudel, 1998; Rudel et al., 2002). The theory proposes that the processes of economic development, industrialization and urbanization im- pact forests in foreseeable ways, suggesting a time sequence for forest cover changes that are prompted by these socioeconomic changes. According to forest transition theory, a relatively rapid deforestation takes place initially but then the trend reverses and a slower increase in forest cover occurs. According to the theory, the initial stage is deforestation and is generally linked to agricultural development and expanding populations. Following this rapid deforestation, populations stabilize, forest cover remains somewhat static, and then the afforestation process begins slowly even if the population con- tinues to grow. The reversal of the trend from deforestation to recovery of forests is generally explained through two pathways (Rudel et al., 2005). In the first, the rapid deforestation period is driven by demands for agricultural lands and forest products, especially for housing and transportation corridors. After this first period of relatively rapid change, the local economy de- velops and diversifies, farm labor moves into off-farm em- ployment as agricultural production becomes less profitable compared to other, non-farm economic activities. Some propor- tion of the rural labor force may migrate to more densely popu- lated areas. Marginal agricultural land is then abandoned as a result and reverts to forest cover. Urbanization and economic development, then, drive this transformation which in the latter stages results in increasing forest cover. Purchasing abandoned lands for parks or forest reserves reinforces the momentum of this transformation. This pathway is exemplified by historic patterns found in some developed countries, including the USA (Rudel et al., 2005). The second explanation is what Rudel et al. (2005) term the “forest scarcity path”. This explanation relies less on transfor- mation of the agricultural sector and attributes increases in the price of scarce forest products as the primary driver for land- owners to plant trees instead of crops or pasture grasses. The state increases the momentum along this path through affore- station programs for marginal lands. Evidence exists (Rudel et al., 2005) that lower income countries with recent increases in forest cover follow this pathway. Regardless of the pathway by which the forest transition may take place, evidence of a forest transition across the United States has been found by other researchers (Evans & Kelley, 2008; Rudel, 1998; Rudel & Fu, 1996). More specifically, evi- dence for either or both pathways to forest transition theory may be extant in the study area (Rudel & Fu, 1996) as forest stocks have expanded and changed across the region (Rosson & Rose, 2010) in the face of significant socioeconomic changes (Farmer et al., 2010). In the current model, afforested lands and socio-environment variables are identified that are associated with change over approximately a ten year period of time. Population structures, economic and transportation infrastructure, geophysical char- acteristics and distance measures to urban centers and public lands are considered. The primary hypothesis of this paper is that the presence and location of the public lands has “spillover effects” into the surrounding landscape. These effects are as- sumed to be the result of the public land boundaries functioning as ecological switches on surrounding privately held lands. A secondary interest is to seek empirical support for the forest tran- sition process in the study area. An examination of land cover change in the following sections allows for empirical consid- eration of these ideas. Environmental History of the Study Area The study area is eight counties in the Ozark Plateau Region within the state of Arkansas and encloses the Buffalo National River (BNR) and much of the Ozark-St. Francis National For- est (NF). The Ozark National Forest covers a large percentage of the study area’s southern portion while the Buffalo National River lands bisect the study area along a roughly east-west axis. Between 1906 and 1909, widespread and large-scale timber cutting took place in the study area, which at that time was the site of the last noteworthy stretches of virgin forest to be found east of the Rocky Mountains. In addition to commercial lumber production, small farmers cleared land during this time with no intention of replanting trees. In reaction to the thin and highly erodible soil, the farming strategy was to clear another location when the first one gave out. Another common practice of the time was burning woodlands in the fall or early spring, a prac- tice that was highly damaging to the forest cover. Burning the woodlands was done to create better forage and pastures for stock and, according to the local folk wisdom, control ticks and snakes. As the federal government reacted to loss of timber reserves across the entire country, broad areas of forest were withdrawn from the public domain and placed in the nation’s forest re- serves. Eventually, these lands became national forests, and within the study area the Ozark National Forest itself was es- tablished in 1908. The original understanding among local peo- ple was that the withdrawal of these lands from the public do- main into federal ownership to form the Ozark National Forest would conserve the forests for future production needs of the local citizens and as such was acceptable policy (Strausberg & Hough, 1997). Within a year of the establishment of the na- tional forest lands in Arkansas, however, the public’s attitude changed dramatically. As the forest rangers began to curb now- illegal but customary practices of using the land as a de facto commons for stock forage, timber cutting, and burning and clearing without regard to title, a public backlash occurred. Local opposition to management of these lands by the US Forest Ser- vice has continued from that time to the present, as local inter- ests have continued to contend with the federally established management objectives (Strausberg & Hough, 1997). In 1972 the US House of Representatives established the Buffalo River as the nation’s first National River. Management of the Buffalo River fell under the purview of the National Park Service and was designed to preserve the free-flowing nature of the Buffalo River. With the establishment of the Buffalo Na- tional River, the river was “preserved” and people living on land adjacent to the river were removed over a period of time. The establishment of the National River, while heralded by con- servation and environmental activists, was met with “emotional turmoil in the community regarding the disruption of life for the Buffalo River residents, whether they were willing or un- willing sellers” (Rogers, 2010). Administrative boundaries were established to enforce only approved uses and limit access to the Buffalo National River lands much as had happened with US Forest Service lands. The headwaters of the Buffalo River are included in US For- est Service lands but most of the rest of the land outside the National River’s boundaries is privately owned. Consequently, ongoing concerns by environmental advocacy groups have been focused on efforts to preserve the clarity and purity of the river water by advocating restrictions on uses of private lands in the Copyright © 2012 SciRes. 2  Z. K. MOON ET AL. river’s drainage system. Activists have also been involved in the management plans of US Forest Service lands for the headwa- ters and drainage of the Buffalo River (Rogers, 2010; Straus- berg & Hough, 1997). The current analysis considers these two different types of public lands situated within the study area: the Buffalo National River, under management by the National Park Service, and the Ozark-St. Francis National Forest, under management by the US Forest Service. The history of these two different public lands captures many of the dilemmas surrounding the estab- lishment of publicly managed lands. The different public land management regimes also reflect different originating impulses for their establishment—on the one hand, preservation of an existing state is the rationale for the Buffalo National River while conservation of a resource to be used for the broader public good is evident for the Ozark-St. Francis National Forest. Interactions along the boundaries of these two lands are hypothe- sized to reflect these differences in management objectives. Creation and continued management of these public lands are not the only macro-level changes taking place in the study area. Relatively rapidly growing human populations in the nearby metropolitan areas have continued pressures on the landscape matrix surrounding these two public lands through increased infrastructure development, increased housing and development, and increased demand for recreational uses. These changes have impacted both US Forest Service and National Park lands although not in identical ways (Moon & Farmer, 2010). In order to understand afforestation patterns a spatial lag re- gression model is provided to demonstrate the relationship of socioeconomic, transportation, and geophysical variables with afforestation at a region-wide level. Evidence is sought for the hypotheses of a forest transition along with ecological switch- ing behavior associated with the boundaries of the public lands. Data and Methods Data The models presented below provide an examination of af- forestation. The endogenous variable (AFFORESTED) is cre- ated from satellite imagery from 1993 and 2004. The previously processed imagery2 (Arkansas Natural Resource Conservation Commission and the University of Arkansas’ Center for Ad- vanced Spatial Technologies October 31, 2005; US Geological Survey January 1, 1999) used for the scenes contain both pro- jection and extent information. The 1993 scene has a resolution of 29.34 meters/pixel while the 2004 imagery has a resolution of 28.5 meters/pixel. These images are pre-processed and con- verted into land cover classes by the original authors. For this study, the images were clipped to the study area and reclassed for use in a series of binary maps. The change matrix included a category called “Afforested” defined as a change from any other category to forest cover3. A series of density surfaces were created to generate the ex- ogenous variables. A random point was generated on the study area map and a grid created from that point with 1-kilometer spacing in each cardinal direction across the study area. The resultant grid contains 11,576 one-kilometer square blocks. These blocks become the individual records to be analyzed. Density surfaces were created from socio-demographic data derived from 1990 and 2000 census block data (US Department of Com- merce Washington DC: Bureau of the Census [producer] 1991, 1993, 2002a, 2002b) using a method developed earlier (see Moon & Farmer 2001 for full details). Additional locational information (a database of rural resi- dential structures obtained from a state agency) was used to convert areal census data into point data. Then, based on the population density surface, other socioeconomic data were allocated across the grid. A difference surface was created for each of the socioeconomic variables and these differences were then summed for each 1 square kilometer block and stored in the data matrix. Direct line distance measures were calculated for each of the distance variables, using the centroid of the 1 square-kilometer block under consideration to the centroids of the closest metropolitan and micropolitan polygons (US Census Bureau—Geography Division 2006), to the center of the near- est segment of each type of public land (BNR and NF) bounda- ries (AHTD, 2006) and the center of the nearest major highway segment (AHTD, 2000). Thirty-meter digital elevation model data (AHTD, 2001) provided the slope and aspect measures. Road density was calculated by summing road length (in kilo- meters, paved and unpaved) in each analytical unit and dividing by the area of the unit. Thus, a matrix was created with one row for each of the 1 km × 1 km blocks and columns for the 15 exogenous variables. AFFORESTED, the measure of the extent of afforestation, was calculated from a binary map of pixels that changed from any other category to “Forest”. This binary map was overlaid with the same 1 km × 1 km block grid. The area within each block that changed into the AFFORESTED category was sum- med, the percentage of the total block area calculated, and the percentages stored. All data was converted to standardized z-scores, eliminating problems in interpreting parameters in dif- ferent metrics. The variables population density (POPDEN), percentage of working age people (WORKERS), percentage of in-migrants in the previous five years (MOVERS), percentage of the em- ployed in natural resource extraction activities such as forestry or mining (NATRES), percentage of new homes constructed in the last five years (NEWHOMES), percentage of homes using electricity as the primary heating source (ELECTRICITY), and the percentage of homes with phone service (PHONES) were drawn from the 1990 and 2000 Census data (US Department of Commerce Washington DC: Bureau of the Census [producer] 1991, 1993, 2002a, 2002b), calculated as change over the time period. Additional variables include road density (RD_DENS) calculated as the number of kilometers of road within the 1 km × 1 km block. 2Imagery was retrieved from GeoStor, a public domain geospatial data re- pository managed by the Arkansas Geographic Information Office and pilo- ted by University of Arkansas’ Center for Advanced Spatial Technologies. Available at http://www.geostor.arkansas.gov. 3As noted earlier, afforestation is used rather than reforestation. Transitional areas and shrubland were classified as herbaceous and not included in affor- estation. However, intentional planting (landscaping or plantation) was not separable from the imagery obtained. Therefore whether the afforestation is directly the result of natural re-growth or plantation/landscaping growth can only be suggested by location. Other distance variables include distance to nearest major, heavily traveled highway (DIST_HWY), to nearest metropolis- tan area (DIST_METRO), to nearest micropolitan area (DIST_ MICRO), to the border of the Buffalo National River park lands (DIST_BNR), and to the Ozark-St. Francis National Forest lands border (DIST_NF). Completing the variables are percentage of a given block’s area with southern aspect (PCTSOUTH) and the percentage of area that has little slope (PCTFLAT). These Copyright © 2012 SciRes. 3  Z. K. MOON ET AL. Copyright © 2012 SciRes. 4 two variables are taken from the DEM data. Table 1 contains definitions, the first two moments, and Moran’s I for all vari- ables. Methods As noted above, the extent of afforestation is analyzed using a spatial lag model, which provides an empirical insight into regional influences. Ordinary least squares regression analysis was performed and is provided for comparison. Residuals from the OLS model demonstrated significant spatial autocorrelation, suggesting the violation of the assumption of independence. Additionally, diagnostic techniques (Anselin et al., 2006), spe- cifically the Lagrange Multiplier for the lag variable as well as for the error term, indicate the appropriateness of using the spatial lag model. Results for the OLS and spatial lag models are presented in Table 2. yafforestation = β1POPDEN + β2WORKERS + β3MOVERS + β4RD_DENS + β5NATRES + β6NEWHOMES + β7DIST_ΒNR + β8DIST_NF + β9PCTSOUTH + β10PCTFLAT + β11DIST_HWY + β12DIST_METRO + β13DIST_MICRO + β14ELECTRICITY + β15PHONES + β16y*lag + ε Results Spatial lag regression findings provide a regional overview of the processes associated with afforestation in the study area. The endogenous variable is “Afforested” or that percentage of the area within each 1 square kilometer block analytical unit that changed from any other type of land cover to “Forest”. As would be expected from an examination of the Moran’s I values for the variables, a regression model accounting for spatial dependencies significantly improves the model fit over an or- dinary least squares (OLS) approach. Inclusion of the spatial lag variable substantively improved the adjusted R-square, AIC, and reduced the spatial autocorrelation in the residuals (see Table 2 for comparison of OLS and spatial lag regression mod- els). The spatial lag model explains nearly 60% of the variation in the model (R-square = 0.59). The lag variable is significant and the strongest parameter in the model, demonstrating the spatial association of changes in land cover due to afforestation. With the exception of population density, the demographic and economic factors included are not significant. Change in population density is negative, indicating that increasing popu- lation densities result in less afforestation. This is as anticipated given the rapidly growing population levels in this area over the time period in question. The road density parameter is positive while the distance to a major highway is negative. These seemingly contradictory in- dicators, however, might be better understood as tied to devel- opment corridors where land once cleared for farming is now used for residential purposes, increasing the density of roads, but also resulting in tree plantings around housing and with nearby cleared lands reverting to forest cover. Housing devel- opment is likely to take place near transportation arteries, re- sulting in the relationship of increasing afforestation as distance to a major highway decreases. Table 1. Univariates, Moran’s I, and definitions of variables. Variable Mean Standard Deviation Variance Moran’s I Definition POPDEN 2.649 15.078 227.35 0.144 Persons per square kilometer, change 1990-2000 MOVERS 0.136 0.596 0.36 0.573 Percentage who lived in different place 5 years ago, change 1990-2000 WORKERS –0.222 0.539 0.29 0.596 Percentage working age (16 - 64), change 1990-2000 NATRES –0.025 0.082 0.01 0.532 Percentage employed in natural resource activities (farming, forestry, mining), change 1990-2000 NEWHOMES 0.035 0.242 0.06 0.430 Percentage housing built within last 5 years, change 1990-2000 RD_DENS 45.757 41.072 1686.94 0.335 Kilometers per square kilometer PCTFLAT 94.790 8.665 75.09 0.563 Percentage land with less than 20% slope DIST_BNR 25.066 15.112 228.37 na Distance from centroid of analytical unit to nearest segment of Buffalo National River boundary DIST_NF 22.385 14.597 213.08 na Distance from centroid of analytical unit to nearest segment of Ozark National Forest boundary PCTSOUTH 36.099 15.362 236.00 0.176 Percentage land with southern aspect ELECTRICITY 0.084 0.295 0.09 0.494 Percentage homes using electricity as heating source, change 1990-2000 PHONES 0.129 0.598 0.36 0.459 Percentage homes with telephones, change 1990-2000 DIST_METRO 94.125 35.261 1243.34 na Distance from centroid of analytical unit to centroid of nearest metropolitan statistical area DIST_MICRO 35.785 15.769 248.67 na Distance from centroid of analytical unit to centroid of nearest micropolitan statistical area DIST_HWY 2.379 1.864 3.47 na Distance from centroid of analytical unit to nearest segment of state highway AFFORESTED 7.76 7.37 54.36 0.587 Change to forest from any other land cover category 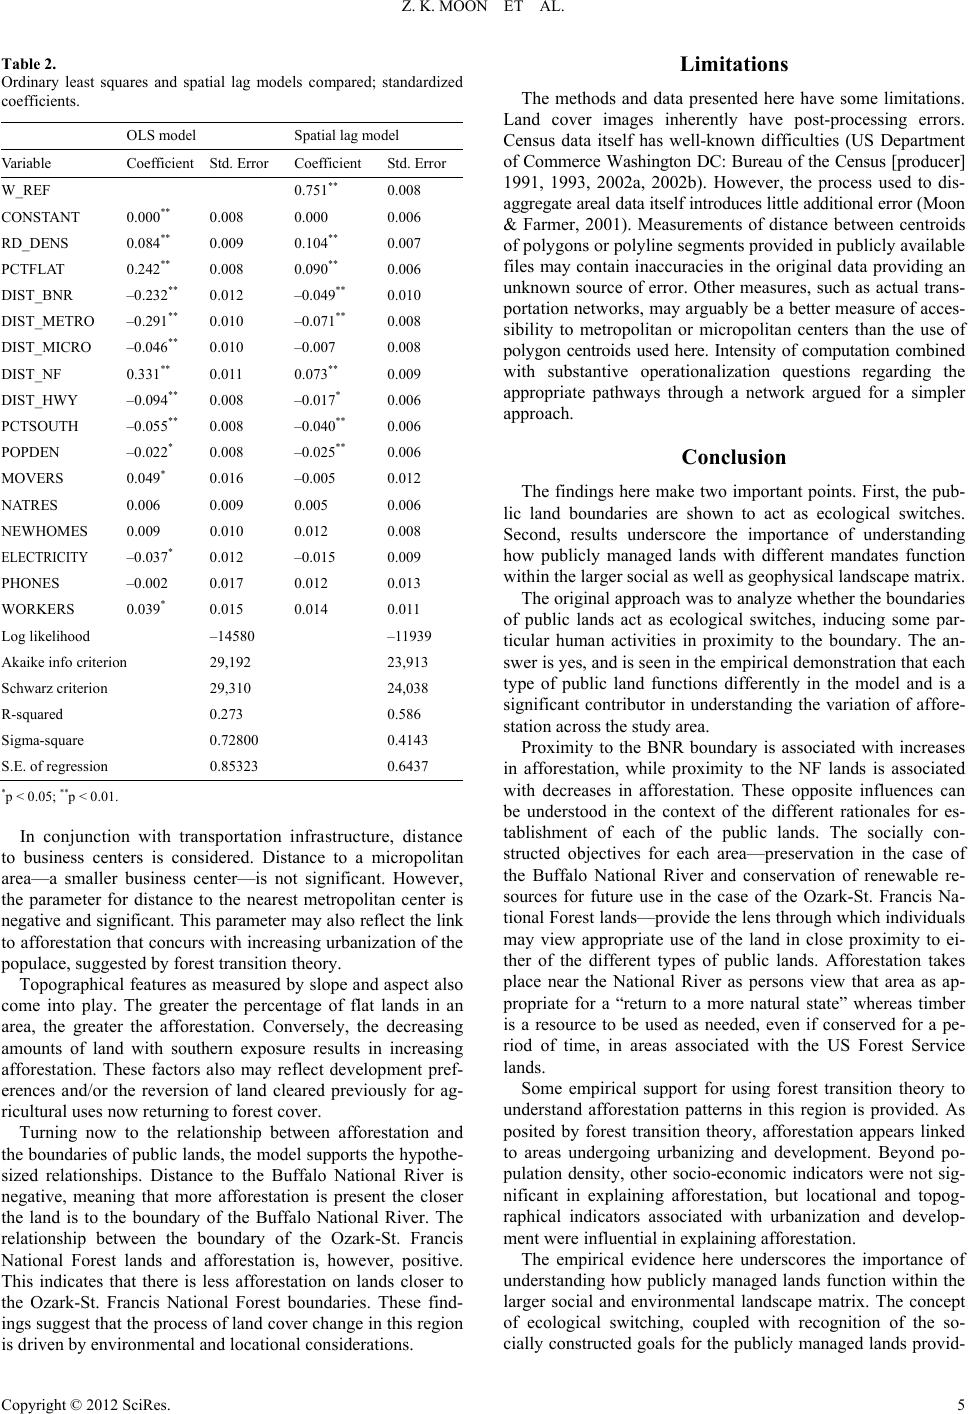 Z. K. MOON ET AL. Table 2. Ordinary least squares and spatial lag models compared; standardized coefficients. OLS model Spatial lag model Variable Coefficient Std. Error Coefficient Std. Error W_REF 0.751** 0.008 CONSTANT 0.000** 0.008 0.000 0.006 RD_DENS 0.084** 0.009 0.104** 0.007 PCTFLAT 0.242** 0.008 0.090** 0.006 DIST_BNR –0.232** 0.012 –0.049** 0.010 DIST_METRO –0.291** 0.010 –0.071** 0.008 DIST_MICRO –0.046** 0.010 –0.007 0.008 DIST_NF 0.331** 0.011 0.073** 0.009 DIST_HWY –0.094** 0.008 –0.017* 0.006 PCTSOUTH –0.055** 0.008 –0.040** 0.006 POPDEN –0.022* 0.008 –0.025** 0.006 MOVERS 0.049* 0.016 –0.005 0.012 NATRES 0.006 0.009 0.005 0.006 NEWHOMES 0.009 0.010 0.012 0.008 ELECTRICITY –0.037* 0.012 –0.015 0.009 PHONES –0.002 0.017 0.012 0.013 WORKERS 0.039* 0.015 0.014 0.011 Log likelihood –14580 –11939 Akaike info criterion 29,192 23,913 Schwarz criterion 29,310 24,038 R-squared 0.273 0.586 Sigma-square 0.72800 0.4143 S.E. of regression 0.85323 0.6437 *p < 0.05; **p < 0.01. In conjunction with transportation infrastructure, distance to business centers is considered. Distance to a micropolitan area—a smaller business center—is not significant. However, the parameter for distance to the nearest metropolitan center is negative and significant. This parameter may also reflect the link to afforestation that concurs with increasing urbanization of the populace, suggested by forest transition theory. Topographical features as measured by slope and aspect also come into play. The greater the percentage of flat lands in an area, the greater the afforestation. Conversely, the decreasing amounts of land with southern exposure results in increasing afforestation. These factors also may reflect development pref- erences and/or the reversion of land cleared previously for ag- ricultural uses now returning to forest cover. Turning now to the relationship between afforestation and the boundaries of public lands, the model supports the hypothe- sized relationships. Distance to the Buffalo National River is negative, meaning that more afforestation is present the closer the land is to the boundary of the Buffalo National River. The relationship between the boundary of the Ozark-St. Francis National Forest lands and afforestation is, however, positive. This indicates that there is less afforestation on lands closer to the Ozark-St. Francis National Forest boundaries. These find- ings suggest that the process of land cover change in this region is driven by environmental and locational considerations. Limitations The methods and data presented here have some limitations. Land cover images inherently have post-processing errors. Census data itself has well-known difficulties (US Department of Commerce Washington DC: Bureau of the Census [producer] 1991, 1993, 2002a, 2002b). However, the process used to dis- aggregate areal data itself introduces little additional error (Moon & Farmer, 2001). Measurements of distance between centroids of polygons or polyline segments provided in publicly available files may contain inaccuracies in the original data providing an unknown source of error. Other measures, such as actual trans- portation networks, may arguably be a better measure of acces- sibility to metropolitan or micropolitan centers than the use of polygon centroids used here. Intensity of computation combined with substantive operationalization questions regarding the appropriate pathways through a network argued for a simpler approach. Conclusion The findings here make two important points. First, the pub- lic land boundaries are shown to act as ecological switches. Second, results underscore the importance of understanding how publicly managed lands with different mandates function within the larger social as well as geophysical landscape matrix. The original approach was to analyze whether the boundaries of public lands act as ecological switches, inducing some par- ticular human activities in proximity to the boundary. The an- swer is yes, and is seen in the empirical demonstration that each type of public land functions differently in the model and is a significant contributor in understanding the variation of affore- station across the study area. Proximity to the BNR boundary is associated with increases in afforestation, while proximity to the NF lands is associated with decreases in afforestation. These opposite influences can be understood in the context of the different rationales for es- tablishment of each of the public lands. The socially con- structed objectives for each area—preservation in the case of the Buffalo National River and conservation of renewable re- sources for future use in the case of the Ozark-St. Francis Na- tional Forest lands—provide the lens through which individuals may view appropriate use of the land in close proximity to ei- ther of the different types of public lands. Afforestation takes place near the National River as persons view that area as ap- propriate for a “return to a more natural state” whereas timber is a resource to be used as needed, even if conserved for a pe- riod of time, in areas associated with the US Forest Service lands. Some empirical support for using forest transition theory to understand afforestation patterns in this region is provided. As posited by forest transition theory, afforestation appears linked to areas undergoing urbanizing and development. Beyond po- pulation density, other socio-economic indicators were not sig- nificant in explaining afforestation, but locational and topog- raphical indicators associated with urbanization and develop- ment were influential in explaining afforestation. The empirical evidence here underscores the importance of understanding how publicly managed lands function within the larger social and environmental landscape matrix. The concept of ecological switching, coupled with recognition of the so- cially constructed goals for the publicly managed lands provid- Copyright © 2012 SciRes. 5  Z. K. MOON ET AL. ing the context for decision-making, gives managers and policy makers a method for anticipating land cover changes in the future specific to the particular type of public land. REFERENCES Anselin, L., Syabri, I., & Kho, Y. (2006). GeoDa: An introduction to spatial data analysis. Geographical Analysis, 38, 5-22. doi:10.1111/j.0016-7363.2005.00671.x Arkansas Highway and Transportation Department (AHTD). (2000). Roads, all. Center for Advanced Spatial Technologies, University of Arkansas. Arkansas Highway and Transportation Department (AHTD). (2001). Digital elevation model. Fayetteville, AR: University of Arkansas. Arkansas Highway and Transportation Department (AHTD). (2006). Public land boundaries (polygon). URL (last checked 1 October 2006). http://www.geostor.arkansas.gov Arkansas Natural Resource Conservation Commission and the Univer- sity of Arkansas’ Center for Advanced Spatial Technologies. (2005). Land use land cover fall 2004 (raster). Bhattarai, M., & Hammig, M. (2001). Institutions and the environ- mental Kuznets Curve for deforestation: A crosscountry analysis for Latin America, Africa and Asia. World Development, 29, 995-1010. doi:10.1016/S0305-750X(01)00019-5 Caldwell, J. C. (1976). Toward a restatement of demographic transition theory. Population and Development Review, 2, 321-366. doi:10.2307/1971615 Carr, D. L., Suter, L., & Barbieri, A. (2005). Population dynamics and tropical deforestation: State of the debate and conceptual challenges. Population and Environment, 27, 89-113. doi:10.1007/s11111-005-0014-x Evans, T. P., & Kelley, H. (2008). Assessing the transition from defor- estation to forest regrowth with an agent-based model of land cover change for south-central Indiana (USA). Geoforum, 39, 819-832. doi:10.1016/j.geoforum.2007.03.010 Farmer, F. L., Miller, W. P., Moon, Z. K., & Goforth, L. (2010). Rural profile of Arkansas, 2009: Social and economic trends affecting ru- ral Arkansas. Fayetteville, AR: Division of Agriculture, University of Arkansas. Frentz, I. C., Farmer, F. L., Guldin, J. M., & Smith, K. G. (2004). Pub- lic lands and population growth. Society & Natural Resources, 17, 57-68. doi:10.1080/716100627 Kok, K. (2004). The role of population in understanding Honduran land use patterns. Journal of Environmental Management, 72, 73-89. doi:10.1016/j.jenvman.2004.03.013 Lambin, E. F., & Geist, H. J. (2006). Land-use and land-cover change, global change—The IGBP series. Berlin: Springer. Lambin, E. F., & Geist, H. J. (2003). Regional differences in tropical deforestation. E nvironment, 45, 22-36. Laurance, W. F., Albernaz, A. K. M., Schroth, G., Fearnside, P. M., Ber- gen, S., Venticinque, E. M., & Da Costa, C. (2002). Predictors of de- forestation in the Brazilian Amazon. Journal of Biogeography, 29, 737-748. doi:10.1046/j.1365-2699.2002.00721.x Mather, A. S. (1992). The forest transition. Area, 24, 367-379. Mather, A. S., & Needle, C. L. (1998). The forest transition: A theo- retical basis. Area, 30, 117-124. doi:10.1111/j.1475-4762.1998.tb00055.x Moon, Z. K., & Farmer, F. L. (2001). Population density surface: A new approach to an old problem. Society & Natural Resources, 14, 39-49. doi:10.1080/089419201300199545 Moon, Z. K., & Farmer, F. L. (2010). Human induced switches on public lands boundaries: The emergence of ecological islands? Soci- ety & Natural Resources, 23, 1-17. doi:10.1080/08941920802317606 Perz, S. G. (2002). The changing social contexts of deforestation in the Brazilian Amazon. Social Science Quarterly, 83, 35-52. doi:10.1111/1540-6237.00069 Radeloff, V. C., Hammer, R. B., Voss, P. R., Hagen, A. E., Field, D. R., & Mladenoff, D. J. (2001). Human demographic trends and land- scape level forest management in the northwest Wisconsin Pine Bar- rens. Forest Science, 47, 229-241 Rogers, S. (2010). Buffalo National River: The encyclopedia of Arkan- sas history & culture. URL. (last checked 2 May 2010). http://www.encyclopediaofarkansas.net/encyclopedia/entry-detail.aspx? search=1&entryID=7 Rosson Jr., J. F., & Rose, A. K. (2010). Arkansas' forests, 2005. (S. R. Station Ed.) Asheville, NC: US Department of Agriculture Forest Service. Rudel, T. K., Bates, D., & Machinguiashi, R. (2002). A tropical forest transition? Agricultural change, out-migration, and secondary forests in the Ecuadorian Amazon. Annals of the Association of American Geographers, 92, 87-102. doi:10.1111/1467-8306.00281 Rudel, T. K. (1998). Is there a forest transition? Deforestation, refores- tation, and development. Rural Sociology, 63, 533-552. doi:10.1111/j.1549-0831.1998.tb00691.x Rudel, T., & Fu, C. (1996). A requiem for the Southern Regionalists: Reforestation in the South and the uses of regional social science. Social Science Quarterly, 77, 804-820. Rudel, T. K., Coomes, O. T., Moran, E., Achard, F., Angelsen, A., Xu, J., & Lambin, E. (2005). Forest transitions: Towards a global under- standing of land use change. Global Environmental Change, 15, 23- 31. doi:10.1016/j.gloenvcha.2004.11.001 Strausberg, S., & Hough, W.A. (1997). The Ouachita and Ozark-St. Francis National Forests: A history of the lands and USDA Forest service tenure. General Technical Report SO-I 21. Washington, DC: US Department of Agriculture. US Census Bureau—Geography Division. (2006). TIGER/line files, 2006 Second edition. US Department of Commerce. URL. (last checked 8 March 2006). http://www.census.gov/geo/www/tiger US Department of Commerce Washington DC: Bureau of the Census (producer). (1991). Census of population and housing, 1990 (UNITED STATES): Summary Tape File 1A (Computer file). Ann Arbor, MI: Inter-University Consortium for Political and Social Research (dis- tributor), 1999. US Department of Commerce Washington DC: Bureau of the Census (producer). (1993). Census of population and housing, 1990 (UNITED STATES): Summary Tape File 3A (Computer file). Ann Arbor, MI: Inter-University Consortium for Political and Social Research (dis- tributor), 1999. US Department of Commerce Washington DC: Bureau of the Census (producer). (2002a). Census of population and housing, 2000 (UNITED STATES): Summary File 1, Final National (Computer file). Ann Arbor, MI: Inter-University Consortium for Political and Social Re- search (distributor), 2003. US Department of Commerce Washington DC: Bureau of the Census (producer). (2002b). Census of population and housing, 2000 (UNITED STATES): Summary File 3, Arkansas (Computer file). Ann Arbor, MI: Inter-University Consortium for Political and Social Research (distributor). 2002. US Geological Survey. (1999). Landcover 30 M national landcover da- taset 1992 (raster). Wilson, J. B., & King, W. M. (1995). Human-mediated vegetation switches as processes in landscape ecology. Landscape Ecology, 10, 191-196. doi:10.1007/BF00129253 Copyright © 2012 SciRes. 6 |