

Paper Menu >>
Journal Menu >>
 Smart Grid and Renewable Energy, 2012, 3, 43-50 http://dx.doi.org/10.4236/sgre.2012.31006 Published Online February 2012 (http://www.SciRP.org/journal/sgre) 43 Optimization of Renewable Energy Power System for Small Scale Brackish Reverse Osmosis Desalination Unit and a Tourism Motel in Egypt Faten Hosney Fahmy, Ninet Mohamed Ahmed, Hanaa Mohamed Farghally Electronics Research Institute, Giza, Egypt. Email: [email protected] Received December 4th, 2011; revised January 30th, 2012; accepted February 7th, 2012 ABSTRACT The main objective of this work is to design an optimal—efficient economic power renewable energy system that feeds the required electric load of a small scale brackish reverse osmosis desalination unit and a tourism motel located in Hurghada, Egypt. Four renewable energy power systems are presented in this paper to select the most optimum one of them. These suggested renewable energy systems are PV-wind hybrid system, stand-alone wind system, stand-alone photovoltaic system and PV-wind-fuel cell hybrid system. The sizing, optimization and economic estimation of the proposed systems were performed using HOMER software. HOMER solves the optimization problem to minimize the global cost and provides the optimum wind turbine, PV, battery and fuel cell ratings. In addition, a comparison between the four different suggested power system configurations is illustrated in details. PV-wind hybrid system realized the lowest net present cost and levelized cost of energy. Also, this system was able to provide energy approximately all the day. The battery state of charge varies between 83% and 99% and it was found that, the PV-wind hybrid system is more suitable than the others for the selected site and the suggested electrical load. Keywords: PV; Wind Turbine; Fuel Cell; Hybrid System; Net Present Cost; HOMER 1. Introduction As the energy demands around the world increase, the need to alternative energy sources is increased. In addi- tion to, the rapid depletion of conventional energy (fossil fuel) resources on a worldwide basis has necessitated an urgent search for alternative energy sources to cater to the present day demands. The clean green renewable sources of energy are expected to play more significant role in the global energy future. Also, with the increasing concerns on air pollution and global warming, the clean renewable energy sources that are environmentally friendly, unexhausted e.g. solar energy, wind, hydrogen, geothermal etc. have attracted energy sectors to generate power on a large scale. Wind and solar energy technolo- gies are the forerunners amongst various types of re- newable sources [1,2]. The vast and continuous devel- opment of the Red Sea zone has led to extensive and in- creasing potable water demands to match the tourist, in- dustrial and urban settlements. Given the worsening wa- ter situation in Egypt due to the massive and increasing demand by the agricultural sector, supplementary non- conventional sources including desalination of sea and brackish water, and reuse of waste water, represent very important sources to ensure maximum water allocation for its uses [3]. Also, water demand in a vastly growing and developing Egyptian community was analyzed as characterized by a rising standard of living, expansion of industrialization in mining and petroleum sectors and the vast expansion of tourist development [4]. There are dif- ferent methods of seawater and brackish desalination appropriate for Egyptian environment and recommended the method of selection of the technology to be used in each particular site where the possible energy sources are screened. A small scale reverse osmosis (RO) desalina- tion system powered by renewable energy sources pre- sents an ideal solution to provide freshwater to small communities isolated at remote areas [5]. In the last dec- ade, desalination, especially by RO, has become one of the principal safe sources of supply of potable water, and even water for agricultural use, it is in the Mediterranean, Africa, the Middle East, and so on, where the potable water supply is a high priority problem. All this leads to the need to identify new sources of supply such as the desalination of brackish or sea water [6,7]. Coupling of renewable energy and desalination systems holds great promise for increasing water supplies in water scarce Copyright © 2012 SciRes. SGRE 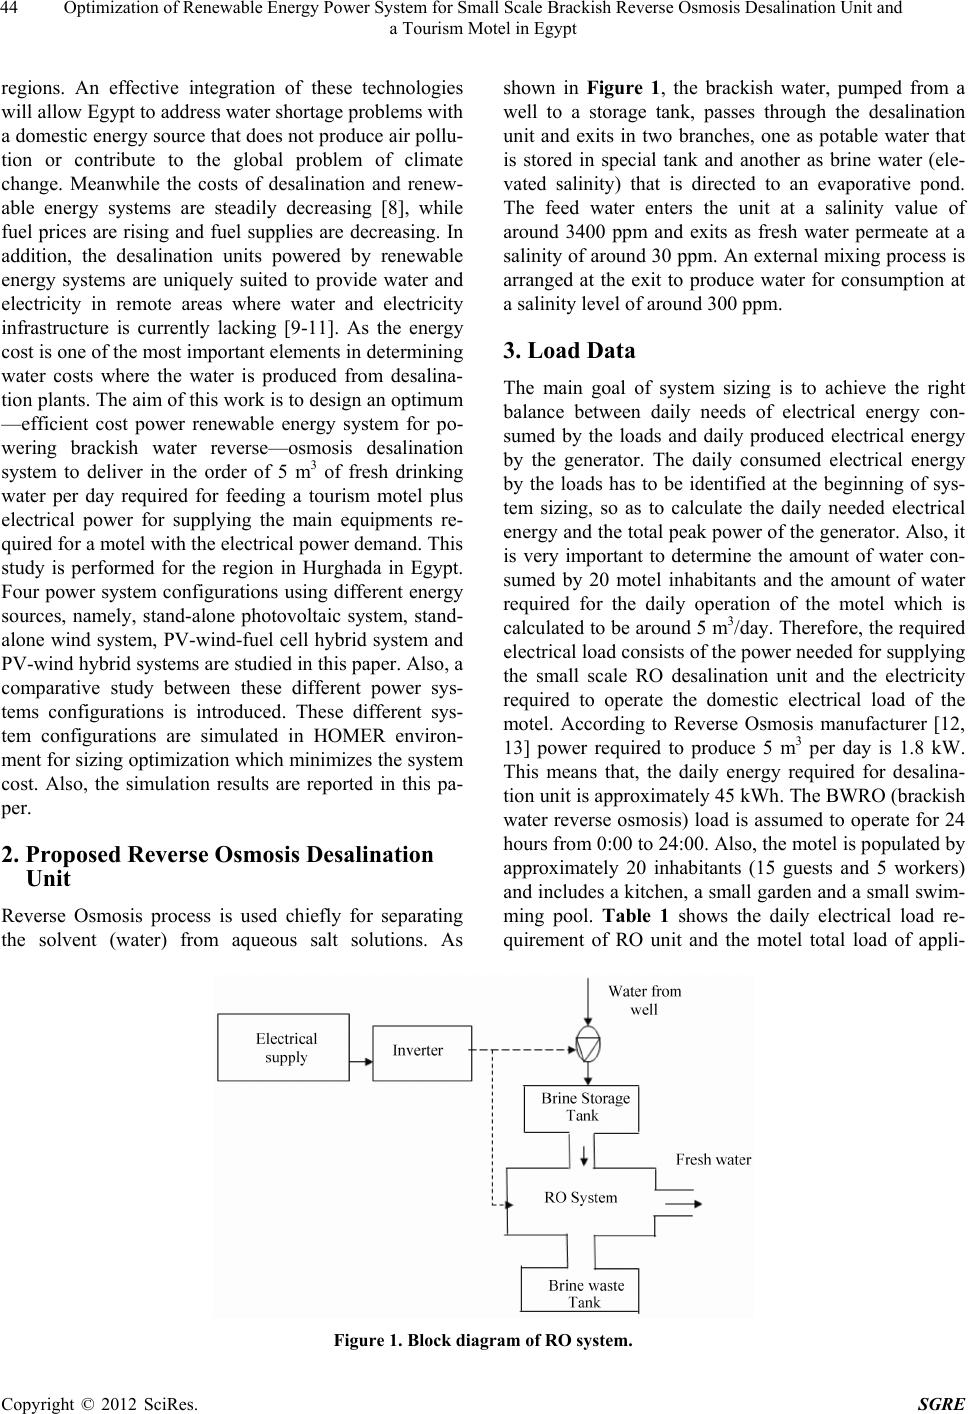 Optimization of Renewable Energy Power System for Small Scale Brackish Reverse Osmosis Desalination Unit and a Tourism Motel in Egypt 44 regions. An effective integration of these technologies will allow Egypt to address water shortage problems with a domestic energy source that does not produce air pollu- tion or contribute to the global problem of climate change. Meanwhile the costs of desalination and renew- able energy systems are steadily decreasing [8], while fuel prices are rising and fuel supplies are decreasing. In addition, the desalination units powered by renewable energy systems are uniquely suited to provide water and electricity in remote areas where water and electricity infrastructure is currently lacking [9-11]. As the energy cost is one of the most important elements in determining water costs where the water is produced from desalina- tion plants. The aim of this work is to design an optimum —efficient cost power renewable energy system for po- wering brackish water reverse—osmosis desalination system to deliver in the order of 5 m3 of fresh drinking water per day required for feeding a tourism motel plus electrical power for supplying the main equipments re- quired for a motel with the electrical power demand. This study is performed for the region in Hurghada in Egypt. Four power system configurations using different energy sources, namely, stand-alone photovoltaic system, stand- alone wind system, PV-wind-fuel cell hybrid system and PV-wind hybrid systems are studied in this paper. Also, a comparative study between these different power sys- tems configurations is introduced. These different sys- tem configurations are simulated in HOMER environ- ment for sizing optimization which minimizes the system cost. Also, the simulation results are reported in this pa- per. 2. Proposed Reverse Osmosis Desalination Unit Reverse Osmosis process is used chiefly for separating the solvent (water) from aqueous salt solutions. As shown in Figure 1, the brackish water, pumped from a well to a storage tank, passes through the desalination unit and exits in two branches, one as potable water that is stored in special tank and another as brine water (ele- vated salinity) that is directed to an evaporative pond. The feed water enters the unit at a salinity value of around 3400 ppm and exits as fresh water permeate at a salinity of around 30 ppm. An external mixing process is arranged at the exit to produce water for consumption at a salinity level of around 300 ppm. 3. Load Data The main goal of system sizing is to achieve the right balance between daily needs of electrical energy con- sumed by the loads and daily produced electrical energy by the generator. The daily consumed electrical energy by the loads has to be identified at the beginning of sys- tem sizing, so as to calculate the daily needed electrical energy and the total peak power of the generator. Also, it is very important to determine the amount of water con- sumed by 20 motel inhabitants and the amount of water required for the daily operation of the motel which is calculated to be around 5 m3/day. Therefore, the required electrical load consists of the power needed for supplying the small scale RO desalination unit and the electricity required to operate the domestic electrical load of the motel. According to Reverse Osmosis manufacturer [12, 13] power required to produce 5 m3 per day is 1.8 kW. This means that, the daily energy required for desalina- tion unit is approximately 45 kWh. The BWRO (brackish water reverse osmosis) load is assumed to operate for 24 hours from 0:00 to 24:00. Also, the motel is populated by approximately 20 inhabitants (15 guests and 5 workers) and includes a kitchen, a small garden and a small swim- ming pool. Table 1 shows the daily electrical load re- quirement of RO unit and the motel total load of appli- Figure 1. Block diagram of RO system. Copyright © 2012 SciRes. SGRE 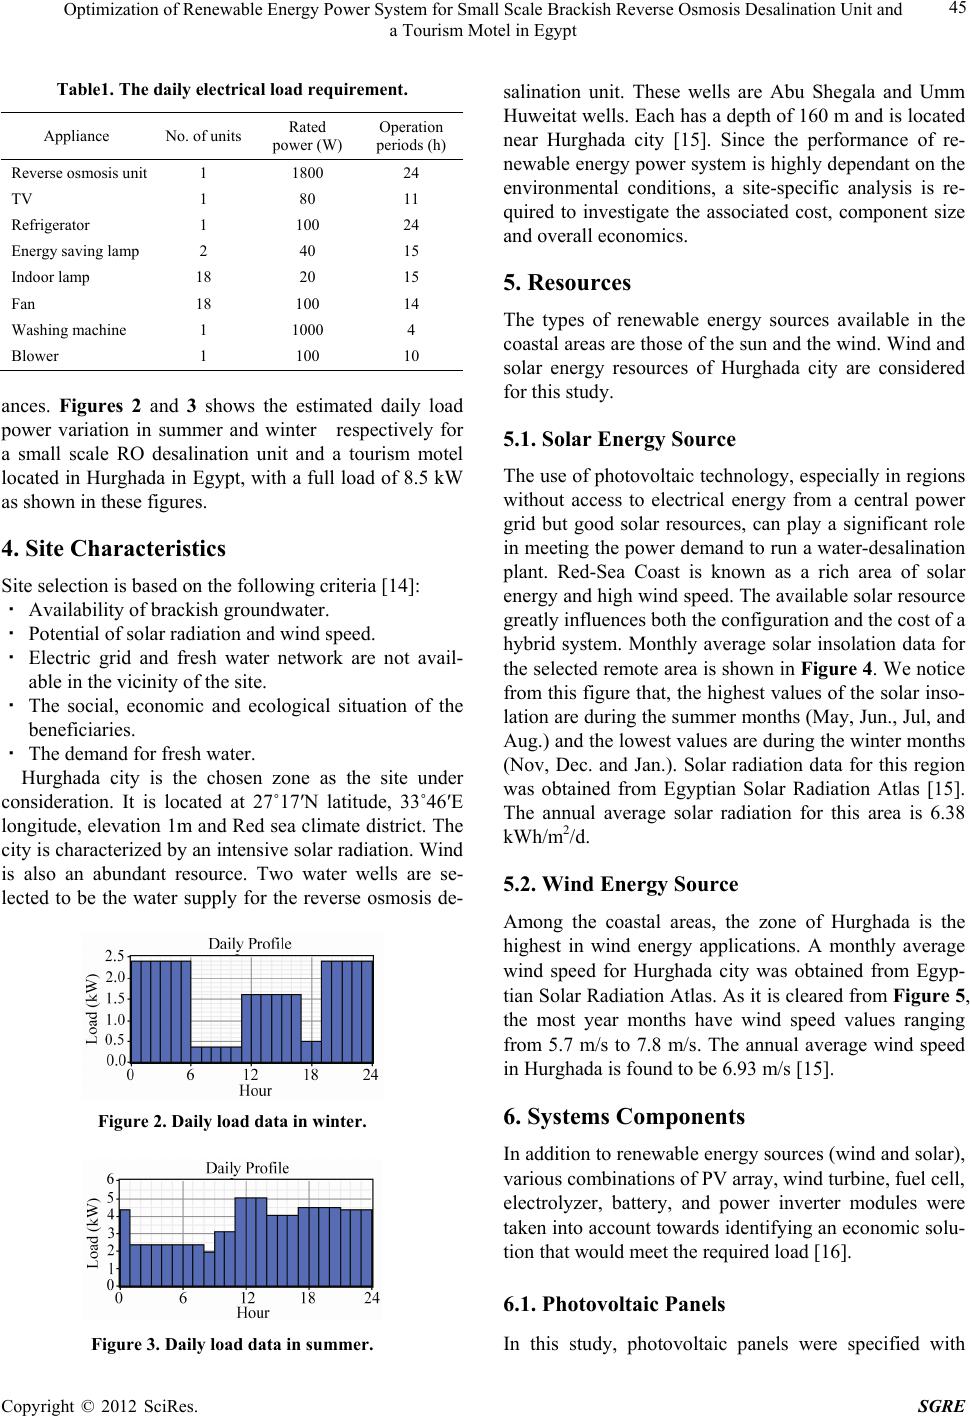 Optimization of Renewable Energy Power System for Small Scale Brackish Reverse Osmosis Desalination Unit and a Tourism Motel in Egypt 45 Table1. The daily electrical load requirement. Appliance No. of unitsRated power (W) Operation periods (h) Reverse osmosis unit 1 1800 24 TV 1 80 11 Refrigerator 1 100 24 Energy saving lamp 2 40 15 Indoor lamp 18 20 15 Fan 18 100 14 Washing machine 1 1000 4 Blower 1 100 10 ances. Figures 2 and 3 shows the estimated daily load power variation in summer and winter respectively for a small scale RO desalination unit and a tourism motel located in Hurghada in Egypt, with a full load of 8.5 kW as shown in these figures. 4. Site Characteristics Site selection is based on the following criteria [14]: · Availability of brackish groundwater. · Potential of solar radiation and wind speed. · Electric grid and fresh water network are not avail- able in the vicinity of the site. · The social, economic and ecological situation of the beneficiaries. · The demand for fresh water. Hurghada city is the chosen zone as the site under consideration. It is located at 27˚17′N latitude, 33˚46′E longitude, elevation 1m and Red sea climate district. The city is characterized by an intensive solar radiation. Wind is also an abundant resource. Two water wells are se- lected to be the water supply for the reverse osmosis de- Figure 2. Daily load data in winter. Figure 3. Daily load data in summer. salination unit. These wells are Abu Shegala and Umm Huweitat wells. Each has a depth of 160 m and is located near Hurghada city [15]. Since the performance of re- newable energy power system is highly dependant on the environmental conditions, a site-specific analysis is re- quired to investigate the associated cost, component size and overall economics. 5. Resources The types of renewable energy sources available in the coastal areas are those of the sun and the wind. Wind and solar energy resources of Hurghada city are considered for this study. 5.1. Solar Energy Source The use of photovoltaic technology, especially in regions without access to electrical energy from a central power grid but good solar resources, can play a significant role in meeting the power demand to run a water-desalination plant. Red-Sea Coast is known as a rich area of solar energy and high wind speed. The available solar resource greatly influences both the configuration and the cost of a hybrid system. Monthly average solar insolation data for the selected remote area is shown in Figure 4. We notice from this figure that, the highest values of the solar inso- lation are during the summer months (May, Jun., Jul, and Aug.) and the lowest values are during the winter months (Nov, Dec. and Jan.). Solar radiation data for this region was obtained from Egyptian Solar Radiation Atlas [15]. The annual average solar radiation for this area is 6.38 kWh/m2/d. 5.2. Wind Energy Source Among the coastal areas, the zone of Hurghada is the highest in wind energy applications. A monthly average wind speed for Hurghada city was obtained from Egyp- tian Solar Radiation Atlas. As it is cleared from Figure 5, the most year months have wind speed values ranging from 5.7 m/s to 7.8 m/s. The annual average wind speed in Hurghada is found to be 6.93 m/s [15]. 6. Systems Components In addition to renewable energy sources (wind and solar), various combinations of PV array, wind turbine, fuel cell, electrolyzer, battery, and power inverter modules were taken into account towards identifying an economic solu- tion that would meet the required load [16]. 6.1. Photovoltaic Panels I n this study, photovoltaic panels were specified with Copyright © 2012 SciRes. SGRE 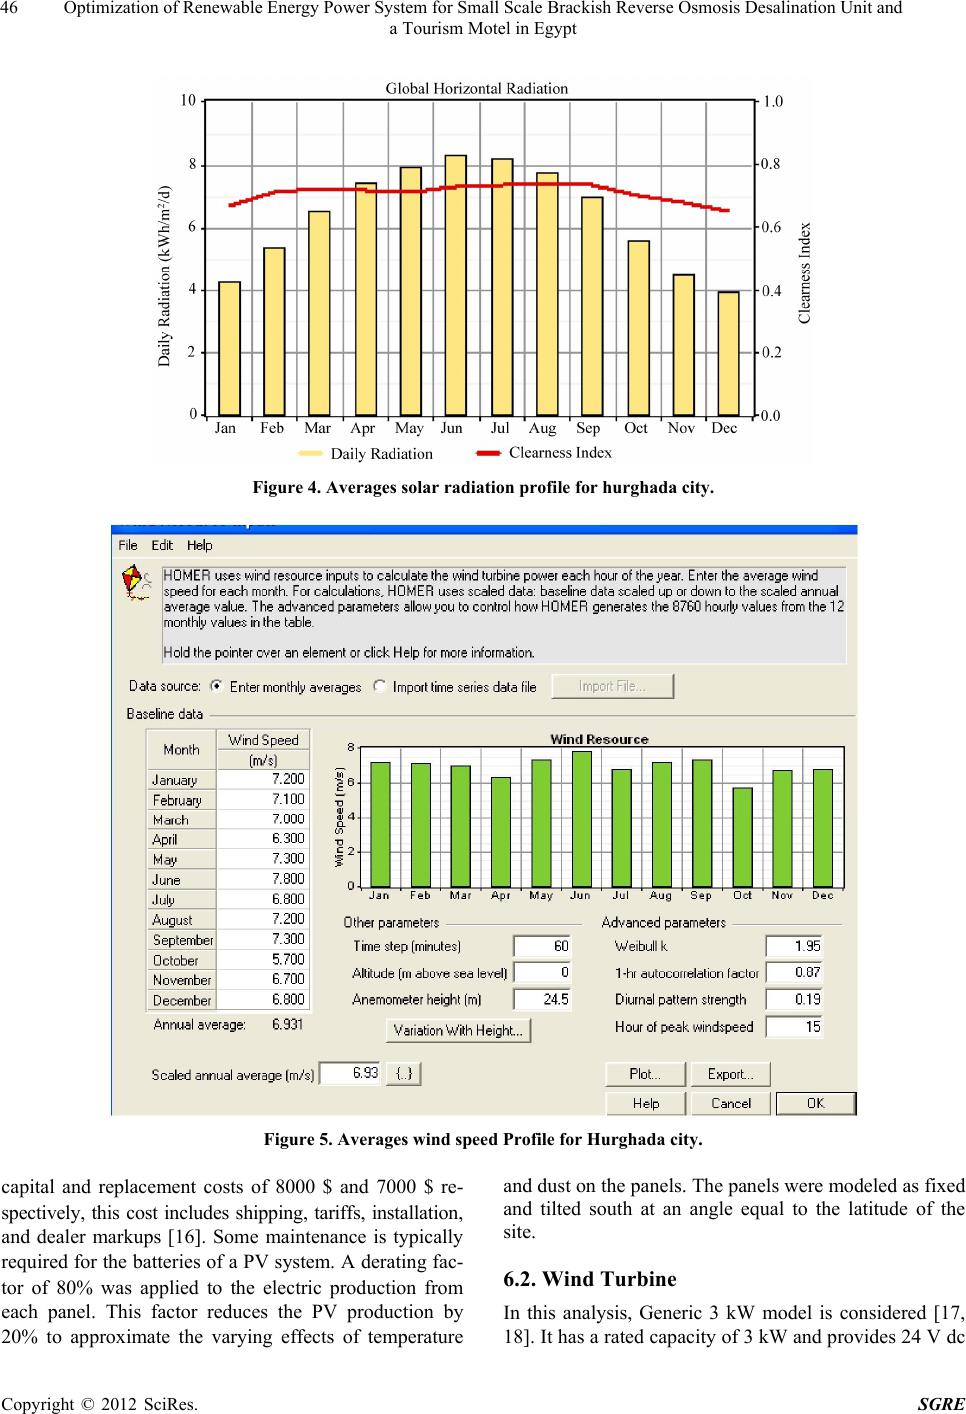 Optimization of Renewable Energy Power System for Small Scale Brackish Reverse Osmosis Desalination Unit and a Tourism Motel in Egypt 46 Figure 4. Averages solar radiation profile for hurghada city. Figure 5. Averages wind speed Profile for Hurghada city. capital and replacement costs of 8000 $ and 7000 $ re- spectively, this cost includes shipping, tariffs, installation, and dealer markups [16]. Some maintenance is typically required for the batteries of a PV system. A derating fac- tor of 80% was applied to the electric production from each panel. This factor reduces the PV production by 20% to approximate the varying effects of temperature and dust on the panels. The panels were modeled as fixed and tilted south at an angle equal to the latitude of the site. 6.2. Wind Turbine In this analysis, Generic 3 kW model is considered [17, 18]. It has a rated capacity of 3 kW and provides 24 V dc Copyright © 2012 SciRes. SGRE  Optimization of Renewable Energy Power System for Small Scale Brackish Reverse Osmosis Desalination Unit and a Tourism Motel in Egypt 47 as output. Cost of one unit is considered to be $1200 while replacement and maintenance costs are taken as $800 and $75/year respectively [17]. The life time of the turbine is estimated to be 20 years. 6.3. Fuel Cell The fuel cell considered in this study has a capacity of 1 kW. Its initial cost is $3000 and its replacement is $2500. Annual operation and maintenance cost is $175. The life time of fuel cell is estimated to be 5 years [18,19]. 6.4. Electrolyzer Water electrolyzer consists of several cells connected in series. Two electrodes of the elcrolyzer are separated by an aqueous electrolyte or solid polymer electrolyte. Elec- trical current through the electrolyzer enables the de- composition of water into hydrogen and oxygen. The capital cost of one kilowatt of the electrolyzer in- cludes electrolyzer electronics is 2000 $. The replace- ment cost of the electrolyzer is assumed to lower than the capital cost because some components included in the capital cost have longer life time than the stack itself. The replacement cost is 1500 $. A durability of 20 years was given within the scope of this simulation[19]. 6.5. Hydrogen Tank Hydrogen storage tanks are also included in the electro- lyzer model. Cost of a tank with 1 kg capacity is assumed to be $1300. The replacement and operational costs are taken as $1200 and $15/year respectively [19]. 6.6. Batteries One of the major requirements for renewable energy power systems is to ensure continuous power flow by storing excess energy from the renewable sources. Tor- gan L16P lead acid battery type was chosen because it is a popular and inexpensive option. HOMER considered the battery sizes from 0 - 20. The voltage regulated lead acid battery is rate at 24V and has a capacity 360 Ah. Initially cost for one battery is $275. The replacement batteries will cost another $275. The operation and main- tenance cost add further 3 $ with a minimum life time of 5 year [16]. 6.7. Inverter A reliable and efficient power electronic inverter is needed to maintain flow of energy between the ac and dc components. The inverter size of 1 kW is taken in this model. Lifetime of the inverter is considered to be 15 years with an efficiency of 90%. It is one of the major costs of the system. For a 1 kW inverter, the initial and replacement costs for the inverter each is $700, with no cost for operation and maintenance [16]. 7. Basic Economical Modeling The total Net Present Cost (NPC) of the power system is the objective function to be minimized in the optimiza- tion process. To calculate the NPC of the system we si- mulate it throughout its lifetime, obtaining the energy produced and consumed by the components, their own lifetimes, the number of times in which the components must be replaced, the operating and maintenance costs, the fuel costs, etc. The renewable energy system cost represented by the net present cost (NPC) is expressed as: 1 & M Ti ii i CCICMOCRc i S (1) where CT is the total system cost, This cost takes into account the initial (capital) and all other costs required for the system to operate properly over its life. m is the number of used energy sources, five main parts are con- sidered: PV array, wind turbine, battery bank, fuel cell and the inverter. CI is the initial capital cost, CR is the replacement cost, CM & O is the operation and mainte- nance cost and CS is the salvage value at the end of the project [20,21]. The constraints of the optimization problem are ex- pressed as follows: Subject to loadpower output maxunserved load%Load 8. Simulation We perform the simulation to obtain the optimum power system configuration that meets the previously men- tioned load profile. National Renewable Energy Labora- tory (NREL)’s, Hybrid Optimization Model for Electric Renewables (HOMER Version. 268Beta) has been used as the sizing and optimization software tool. It contains a number of energy component models and evaluates suit- able technology options based on cost and availability of resources [18,22,23]. Analysis with HOMER requires information on resources, economic constraints, and con- trol methods. The four previously mentioned power system con- figurations which are submitted to the technical and eco- nomical analysis can be addressed as follow: Power system 1: “PV-wind hybrid system”. Power system 2: “stand-alone wind system”. Power system 3: “stand-alone PV system”. Power system 4: “PV-wind-fuel cell hybrid system”. Copyright © 2012 SciRes. SGRE  Optimization of Renewable Energy Power System for Small Scale Brackish Reverse Osmosis Desalination Unit and a Tourism Motel in Egypt Copyright © 2012 SciRes. SGRE 48 9. Optimization Results The simulation results of the four power system configu- rations are displayed in Table 2. Power system 1, which is the PV-wind-battery hybrid system offers the much lower NPC and Levelized cost of energy (LCOE) with PV and wind combined together. On the other hand, power system 3 has higher Initial Capital Costs, NPC and LCOE. While system 2 has the cheapest initial capital cost while the NPC and LCOE are higher than power system 1. This is due to considerable increase of re- placement, O&M costs. It is cleared that the use of initial capital cost as the primary decision criteria in remote area power generation systems is misleading and inap- propriate. Relying on LCOE, NPC as the key decision parameters instead of using initial capital cost will result in the better selection of remote energy technologies. Also, the high PV-wind-fuel cell power system cost over PV-buttery system is due to the high capital cost of fuel cell system and electrolyser compared to the battery. Economic competitiveness for hydrogen energy systems is obtainable only with a significant reduction of capital costs together with a strong decrease in energy prices. According to the results of the optimization process the optimal power system comprises a 5 kW PV array, a 6 kW wind turbine, a 10 kW inverter and 10 batteries. Figure 6 shows the PV-wind-Battery hybrid system ar- chitecture simulated in HOMER. The proposed system gives us a total net present cost of $69,524. The cost of energy is 0.321 $/kWh and the initial capital required is $40,750. As shown in Figures 7(a), (b) the load is supplied with a hybrid system comprising of a PV array, wind generator and battery storage. As cleared in Figure 7(a), the PV/Wind hybrid system is able to provide energy approximately all time of the day. It can be observed that, the load could be met right through the day .The battery state of charge varies between 83% and 99% as shown in Figure 7(b). Figure 6. HOMER implementation of the PV-wind-battery hybrid system. (a) (b) Figure 7. Hourly data for pow er system 1. Table 2. Optimization sizing results. tem Power system 1 PV-Wind-Battery system Power system 2 Wind-Battery system Power system 3 PV-Battery system Power system 4 PV-Wind-Fuel cell system Optimization sizing results 5 kw PV array 6 kW PV wind turbine 10 battery each 8.64 kw·h 10 kw inverter 12 kW wind turbine 20 battery each 8.64 kw·h 10 kw inverter 10 kw PV array 10 battery each 8.64 kw·h 10 kw inverter 100 kw PV array 120 kw wind turbine 14 kW fuel cell 80 kw electrelyzer 50 kg hydrogen tank 10 kw inverter Capital cost ($) 40,750 36,500 51,250 799,800 O & M ($) 5,016 10,033 314 37,790 Replacement cost ($) 26,983 30,677 40,175 127,996 Net Present cost ($) (NPC) 69,524 74,652 87,956 903,281 Levelized cost of energy (LCOE) ($/kwh) 0.321 0.356 0.414 4.305 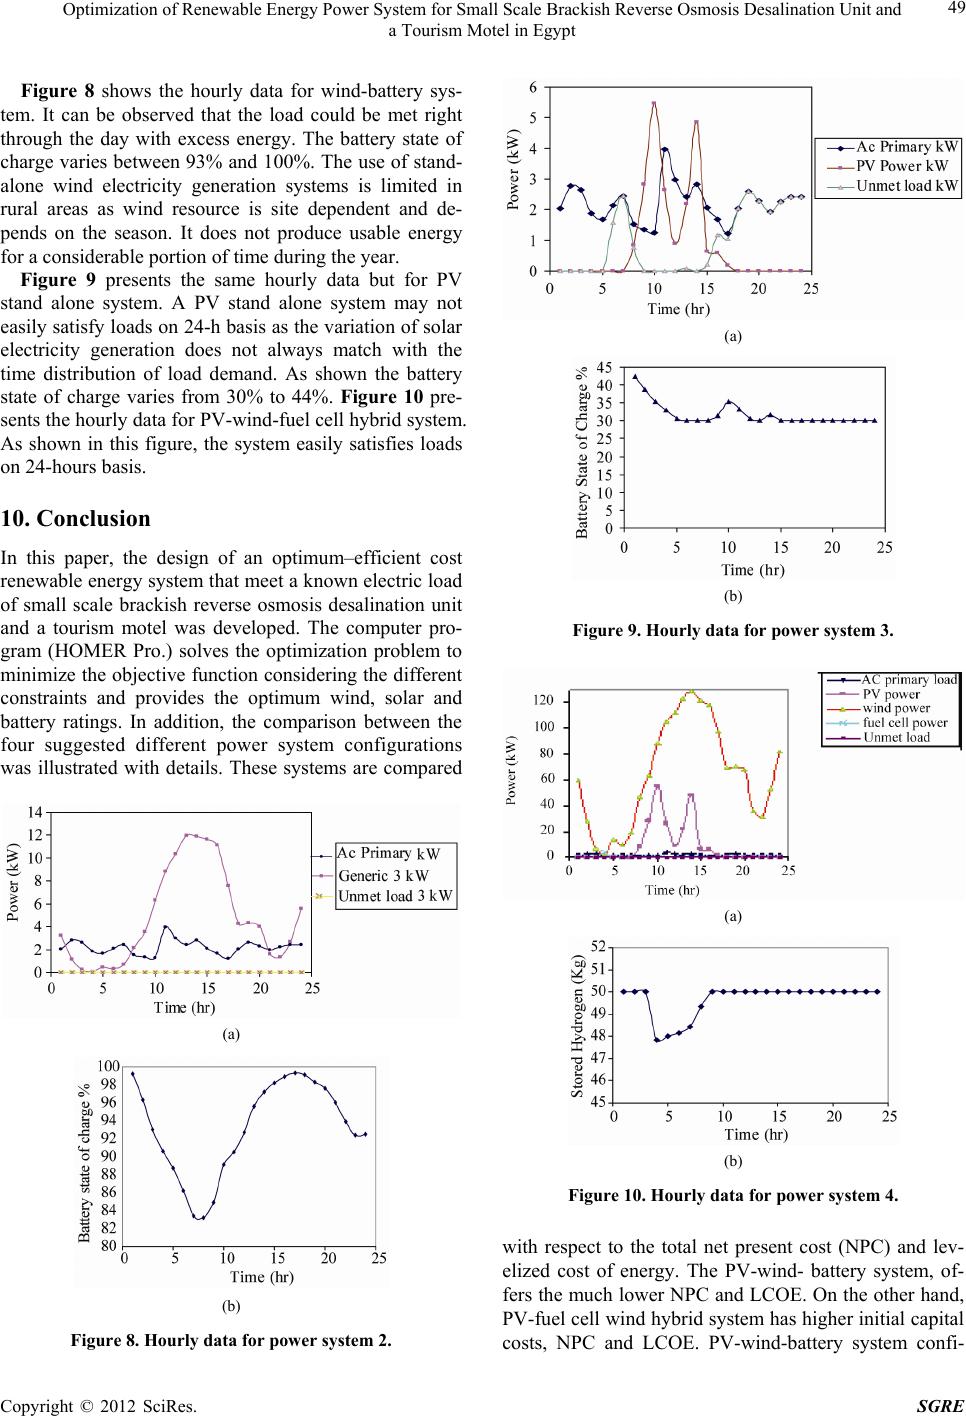 Optimization of Renewable Energy Power System for Small Scale Brackish Reverse Osmosis Desalination Unit and a Tourism Motel in Egypt 49 Figure 8 shows the hourly data for wind-battery sys- tem. It can be observed that the load could be met right through the day with excess energy. The battery state of charge varies between 93% and 100%. The use of stand- alone wind electricity generation systems is limited in rural areas as wind resource is site dependent and de- pends on the season. It does not produce usable energy for a considerable portion of time during the year. Figure 9 presents the same hourly data but for PV stand alone system. A PV stand alone system may not easily satisfy loads on 24-h basis as the variation of solar electricity generation does not always match with the time distribution of load demand. As shown the battery state of charge varies from 30% to 44%. Figure 10 pre- sents the hourly data for PV-wind-fuel cell hybrid system. As shown in this figure, the system easily satisfies loads on 24-hours basis. 10. Conclusion In this paper, the design of an optimum–efficient cost renewable energy system that meet a known electric load of small scale brackish reverse osmosis desalination unit and a tourism motel was developed. The computer pro- gram (HOMER Pro.) solves the optimization problem to minimize the objective function considering the different constraints and provides the optimum wind, solar and battery ratings. In addition, the comparison between the four suggested different power system configurations was illustrated with details. These systems are compared (a) (b) Figure 8. Hourly data for pow er system 2. (a) (b) Figure 9. Hourly data for pow er system 3. (a) (b) Figure 10. Hourly data for power system 4. with respect to the total net present cost (NPC) and lev- elized cost of energy. The PV-wind- battery system, of- fers the much lower NPC and LCOE. On the other hand, PV-fuel cell wind hybrid system has higher initial capital costs, NPC and LCOE. PV-wind-battery system confi- Copyright © 2012 SciRes. SGRE  Optimization of Renewable Energy Power System for Small Scale Brackish Reverse Osmosis Desalination Unit and a Tourism Motel in Egypt 50 guration comprising of 5 kW PV array, a 6 kW wind turbine and 10 batteries each has a capacity of 8.64 kWh is the most economic solution under given resource and load conditions. Also, the high PV-wind-fuel cell system cost over PV-buttery system is due to the high capital cost of fuel cell system and electrolyser compared to bat- tery. Therefore, the major obstacle in using hydrogen as a storage medium is the high cost associated with it. REFERENCES [1] D. M. Atia, F. H. Fahmy, N. M. Ahmed and H. T. Dorrah, “Comparative Study of PV-Wind Power Systems for Aquaculture System using Genetic Algorithm,” Proceed- ings of 1st International Conference on New Paradigms in Electronics and Information Technologies.(PEIT’011), Alexandria, Egypt, 9-12 October 2011. [2] I. S. E. Fraunhofer, “Co-Ordination Action for Autono- mous Desalination Units Based on Renewable Energy Systems,” INCO-CT-2004-50-90-93, 2006. http://www.adu-res.org [3] E. E. Khalil, “Potable Water Technology Development in Egypt,” Desalination, Vol. 136, No. 1-3, 2001, pp. 57-62. doi:10.1016/S0011-9164(01)00165-5 [4] A. El-Sadek, “Water Desalination: An Imperative Meas- ure for Water Security in Egypt,” Desalination, Vol. 250, No. 3, 2010, pp. 876-884. doi:10.1016/j.desal.2009.09.143 [5] H. Aybar, J. S. Akhatov, N. R. Avezova and A. S. Hali- mov, “Solar Powered RO Desalination: Investigations on Pilot Project of PV Powered RO Desalination System 1,” Applied Solar Energy, Vol. 46, No. 4, 2010, pp. 275-284. doi:10.3103/S0003701X10040080 [6] T. Espinoa, B. Peñate, G. Piernavieja, D. Heroldb and Apostel Neskakis, “Optimised Desalination of Seawater by a PV Powered Reverse Osmosis Plant for a Decentral- ised Coastal Water Supply,” Desalination, Vol. 156, No. 1-3, 2003, pp. 349-350. doi:10.1016/S0011-9164(03)00365-5 [7] A. Ghermandi and R. Messalem, “Solar-Driven Desalina- tion with Reverse Osmosis: The State of Art,” Desalina- tion and Water Treatment, Vol. 7, No. 1-3, 2009, pp. 285-296. doi:10.5004/dwt.2009.723 [8] M. E1-Kady and F. E1-Shibini, “Desalination in Egypt and the Future Application in Supplementary Irrigation,” Desalination, Vol. 136, No. 1-3, 2001, pp. 63-72. doi:10.1016/S0011-9164(01)00166-7 [9] A. Al-Alawi and S. Islam, “Estimation of Electricity De- mand for Remote Area Power Supply Systems Including Water Desalination and Demand Side Management Mo- dels,” 2011. http://itee.uq.edu.au [10] E. Gkeredaki, “Autonomous Photovoltaic-Powered Re- verse Osmosis for Remote Coastal Areas,” Master Thesis, Delft University of Technology, Delft, 2011. [11] Zejli, O-K. Bouhelal, R. Benchrifa and A. Bennouna. “Ap- plications of Solar and Wind Energy Sources to Sea- Water Desalination-Economical Aspects,” International Conference on Nuclear Desalination: Challenges and Options, Marrakech, Morocco, 16-18 October. [12] M. M. Mahmoud, “Solar Electric Powered Reverse Os- mosis Water Desalination System for the Rural Village Al Maleh: Design and Simulation,” International Journal of Solar Energy, 2003, Vol. 23, No. 1-2, pp. 51-62. [13] The Official Website of Citor Pty. Ltd. Company. Fre- mantle, Western Australia, 2002. http://www.citor.com.au [14] A. Muhaidat, M. Kabariti, K. Touryan and A. Hoffman, “Design, Sizing and Simulation of Solar Powered De- salination Unit for Brackish Water in Jordan,” Desalina- tion and Water Treatment, Vol. 13, No. 1-3, 2010, pp. 238-246. doi:10.5004/dwt.2010.1067 [15] New and Renewable Energy Authority, Ministry of Elec- tricity and Energy, Egyptain Solar Radiation Atlas, Cairo, Egypt, 1998. [16] Kh Abulqasem, M. A. Alghoul, M. N. Mohammed, A. Mustafa, Kh Glaisa, N. Amin, A. Zaharim and K. Sopian, “Optimization of Renewable Power System for Small Scale Seawater Reverse Osmosis Desalination Unit in Mrair-Gabis Village, Libya,” Recent Researches in Ap- plied Mathematics, Simulation and Modelling, 2011, pp. 155-160. [17] HOMER Program, Ver.2 68 Beta, “National Renewable Energy Laboratory,” Golden, 2010. [18] B. E. Türkay, “Selection of Optimum Hybrid Stand Alone Systems,” Proceedings of the 14th International Middle East Power Systems Conference (MEPCON’10), Cairo University, Cairo, 19-21 December 2010, pp. 994-1000. [19] M. J. Khan and M. T. Iqbal, “Pre-Feasibility Study of Stand-Alone Hybrid Energy Systems for Applications in Newfoundland,” Renewable Energy, Vol. 30, No. 6, 2005, pp. 835-854. doi:10.1016/j.renene.2004.09.001 [20] R. Dufo-López, J. L. Bernal-Agustín and J. Contreras, “Optimization of Control Strategies for Stand-Alone Re- newable Energy Systems with Hydrogen Storage,” Re- newable Energy, Vol. 32, No. 7, 2007, pp. 1102-1126. doi:10.1016/j.renene.2006.04.013 [21] S. A. Kershrnana, J. Rheinländer and H. Gablerb, “Sea- water Reverse Osmosis Powered from Renewable Energy Sources—Hybrid Wind/Photovoltaic/Grid Power Supply for Small-Scale Desalination in Libya,” Desalination, Vol. 153, No. 1-3, 2002, pp. 17-23. [22] J. Cotrell and W. Pratt, “Modeling the Feasibility of Us- ing Fuel Cells and Hydrogen Internal Combustion En- gines in Remote Renewable Energy Systems,” NREL/ TP-500-34648, September 2003. [23] P. Bajpai, S. Kumar and N. K. Kishore, “Sizing Optimi- zation and Analysis of a Stand-Alone WTG System Us- ing Hybrid Energy Storage Technologies,” PEA-AIT In- ternational Conference on Energy and Sustainable De- velopment: Issues, and Strategies (ESD 2010), Thailand, 2-4 June 2010, pp. 1-6. Copyright © 2012 SciRes. SGRE |