

Paper Menu >>
Journal Menu >>
 Smart Grid and Renewable Energy, 2012, 3, 10-16 http://dx.doi.org/10.4236/sgre.2012.31002 Published Online February 2012 (http://www.SciRP.org/journal/sgre) A New Method for Optimal Placement of TCSC Based on Sensitivity Analysis for Congestion Management Abouzar Samimi1, Peyman Naderi2 1Department of Electrical Engineering, Islamic Azad University Boroujerd Branch, Boroujerd, Iran; 2Department of Electrical Engi- neering, Shahid Rajaee University, Tehran, Iran. Email: [email protected], [email protected] Received June 5th, 2011; revised December 7th, 2011; accepted December 14th, 2011 ABSTRACT In this paper a new method has been proposed to determine optimal location and best setting of Thyristor Controlled Series Compensator (TCSC). Seeking the best place is performed using the sensitivity analysis and optimum setting of TCSC is managed using the genetic algorithm. The configuration of a typical TCSC from a steady-state perspective is the fixed capacitor with a thyristor controlled reactor (TCR). The effect of TCSC on the network can be modeled as a controllable reactance inserted in the related transmission line. This paper employs the DIgSILENT simulator and the DPL as a programming tool of the DIgSILENT to show the validity of the proposed method. The effectiveness of sug- gested approach has been tested on IEEE 14-bus system. Keywords: TCSC; Optimal Placement; Sensitivity Analysis; Genetic Algorithm 1. Introduction In recent years, with increasing in development of power networks, the economical operation of power system is more considered. Because of deregulation and restruc- turing of the electricity markets use of Flexible AC Trans- mission Systems (FACTS) devices is inevitable. The maximum capability of power systems can be exploited by means of FACTS devices. Nowadays, development of power electronics switches causes reduction in the cost of FACTS and therefore application of FACTS devices especially in distribution networks is more economical. Because of the economical considerations, installation of FACTS controller in all of the buses or the lines is impossible and unnecessary. There are several methods for finding optimal locations of FACTS devices in power systems [1-7]. In [1], a sensitivity based method has been suggested to optimally locate the Thyristor Controlled Series Com- pensator (TCSC) and Unified Power Flow Controller (UPFC) for enhancing the system security under different operating conditions and at optimal settings of FACTS parameters. The DC power flow equations have been employed for calculating the sensitivity indices. In [2], a genetic algorithm (GA) based method is used to deter- mine the optimal sitting of FACTS controller in power system. The fitness function is to minimize the genera- tion cost. In [3], the genetic algorithm is used to seek the optimal location of multi-type FACTS devices in a power system. The optimizations are performed on three pa- rameters: the location of the devices, their types, and their values. In [4], the Tabu Search (TS) method is used to solve the combinatorial (i.e. to determine number and location) problem of FACTS device allocation. Refer- ence [5] compares three heuristic methods, simulated annealing (SA), TS and GA, applied to the optimal loca- tion of FACTS devices in order to enhance the system security. The objective function is based on indices quan- tifying the severity of the contingencies in terms of branch loading and voltage levels. The three methods lead to similar results, but generally TS and GA converge faster than SA to an optimal solution. In [6], a real power flow performance sensitivity index has been proposed to decide optimal location of FACTS controllers. In [7], extended voltage phasors approach (EVPA) is proposed for placement of FACTS controllers in power systems within the voltage stability viewpoint. In this paper a new method has been proposed to op- timally locate TCSC in power systems. The suggested approach is composed of sensitivity analysis and the ge- netic algorithm. Finding the best place for TCSC is per- formed using the sensitivity analysis and sizing of TCSC is managed using the genetic algorithm. The IEEE 14- bus system has been applied to test the suggested algo- rithm. The rest of the paper is organized as follows. Sec- tion 2 presents the modeling of the TCSC adapted for this study. The search space in optimal placement of series Copyright © 2012 SciRes. SGRE 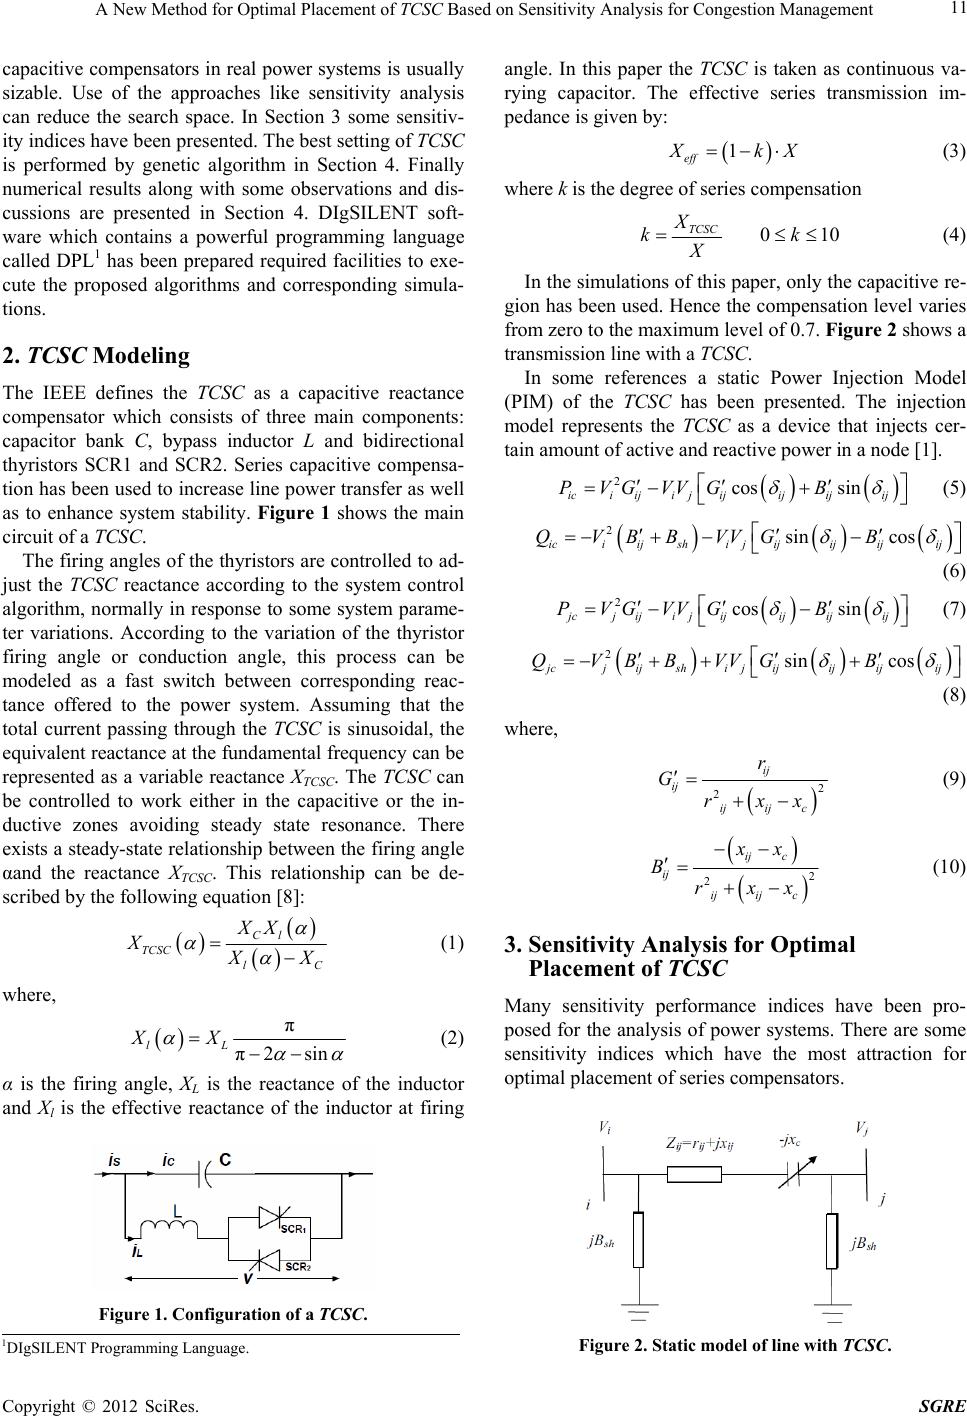 A New Method for Optimal Placement of TCSC Based on Sensitivity Analysis for Congestion Management 11 capacitive compensators in real power systems is usually sizable. Use of the approaches like sensitivity analysis can reduce the search space. In Section 3 some sensitiv- ity indices have been presented. The best setting of TCSC is performed by genetic algorithm in Section 4. Finally numerical results along with some observations and dis- cussions are presented in Section 4. DIgSILENT soft- ware which contains a powerful programming language called DPL1 has been prepared required facilities to exe- cute the proposed algorithms and corresponding simula- tions. 2. TCSC Modeling The IEEE defines the TCSC as a capacitive reactance compensator which consists of three main components: capacitor bank C, bypass inductor L and bidirectional thyristors SCR1 and SCR2. Series capacitive compensa- tion has been used to increase line power transfer as well as to enhance system stability. Figure 1 shows the main circuit of a TCSC. The firing angles of the thyristors are controlled to ad- just the TCSC reactance according to the system control algorithm, normally in response to some system parame- ter variations. According to the variation of the thyristor firing angle or conduction angle, this process can be modeled as a fast switch between corresponding reac- tance offered to the power system. Assuming that the total current passing through the TCSC is sinusoidal, the equivalent reactance at the fundamental frequency can be represented as a variable reactance XTCSC. The TCSC can be controlled to work either in the capacitive or the in- ductive zones avoiding steady state resonance. There exists a steady-state relationship between the firing angle αand the reactance XTCSC. This relationship can be de- scribed by the following equation [8]: Cl TCSC lC XX X X X (1) where, π π2sin lL XX (2) α is the firing angle, XL is the reactance of the inductor and Xl is the effective reactance of the inductor at firing Figure 1. Configuration of a TCSC. angle. In this paper the TCSC is taken as continuous va- rying capacitor. The effective series transmission im- pedance is given by: 1 eff X kX (3) where k is the degree of series compensation TCSC X k X (4) 01k0 In the simulations of this paper, only the capacitive re- gion has been used. Hence the compensation level varies from zero to the maximum level of 0.7. Figure 2 shows a transmission line with a TCSC. In some references a static Power Injection Model (PIM) of the TCSC has been presented. The injection model represents the TCSC as a device that injects cer- tain amount of active and reactive power in a node [1]. 2cos sin iciiji jijijijij PVGVVGB (5) 2sin cos iciijshi jijijijij QVBBVVG B (6) 2cos sin jcjiji jijijijij PVGVVG B (7) 2sin cos jcjijshi jijijijij QVBBVVG B (8) where, 2 2 ij ij ijij c r G rxx (9) 2 2 ij c ij ijij c xx B rxx (10) 3. Sensitivity Analysis for Optimal Placement o f TCSC Many sensitivity performance indices have been pro- posed for the analysis of power systems. There are some sensitivity indices which have the most attraction for optimal placement of series compensators. Figure 2. Static model of line with TCSC. 1DIgSILENT Programming Language. Copyright © 2012 SciRes. SGRE 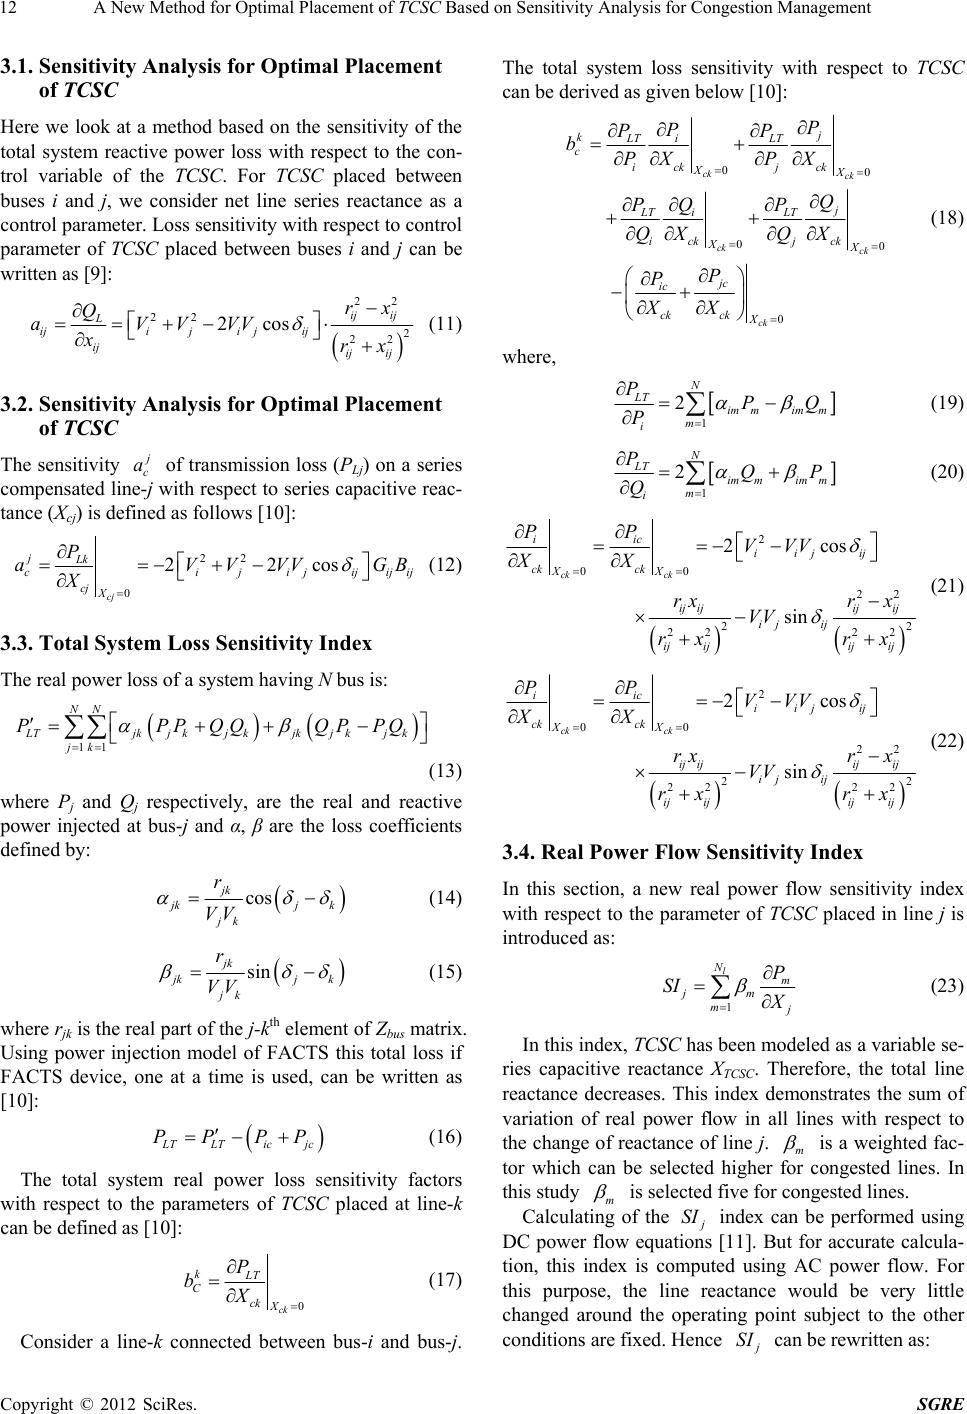 A New Method for Optimal Placement of TCSC Based on Sensitivity Analysis for Congestion Management 12 3.1. Sensitivity Analysis for Optimal Placement of TCSC Here we look at a method based on the sensitivity of the total system reactive power loss with respect to the con- trol variable of the TCSC. For TCSC placed between buses i and j, we consider net line series reactance as a control parameter. Loss sensitivity with respect to control parameter of TCSC placed between buses i and j can be written as [9]: 22 22 2 22 2cos ij ij L ijijij ij ij ij ij rx Q aVVVV xrx (11) 3.2. Sensitivity Analysis for Optimal Placement of TCSC The sensitivity j c a of transmission loss (PLj) on a series compensated line-j with respect to series capacitive reac- tance (Xcj) is defined as follows [10]: 22 0 22cos cj jLk cijij cj X P aVVVV X ijijij GB PQ (12) 3.3. Total System Loss Sensitivity Index The real power loss of a system having N bus is: 11 NN LTjkj kjkjkj kjk jk PPPQQQP (13) where Pj and Qj respectively, are the real and reactive power injected at bus-j and α, β are the loss coefficients defined by: cos jk j kj jk r VV k (14) sin jk j kj jk r VV k (15) where rjk is the real part of the j-kth element of Zbus matrix. Using power injection model of FACTS this total loss if FACTS device, one at a time is used, can be written as [10]: L TLT icjc PP PP (16) The total system real power loss sensitivity factors with respect to the parameters of TCSC placed at line-k can be defined as [10]: 0 ck kLT C ck X P bX (17) Consider a line-k connected between bus-i and bus-j. The total system loss sensitivity with respect to TCSC can be derived as given below [10]: 00 00 0 ck ck ck ck ck j ki LT LT c ick jck XX j i LT LT ickjck XX jc ic ckckX P P PP bPX PX Q Q PP QX QX P P XX (18) where, 1 2 N LT im mimm m i PPQ P (19) 1 2 N LT immim m m i PQP Q (20) 2 00 22 22 22 22 2cos sin ck ck iic iij ij ck ck XX ij ijijij ij ij ij ijij ij PP VVV XX rxr x VV rx rx (21) 2 00 22 22 22 22 2cos sin ck ck iic iij ij ck ck XX ij ijijij ij ij ij ijij ij PP VVV XX rxr x VV rx rx (22) 3.4. Real Power Flow Sensitivity Index In this section, a new real power flow sensitivity index with respect to the parameter of TCSC placed in line j is introduced as: 1 l N m jm m j P SI X (23) In this index, TCSC has been modeled as a variable se- ries capacitive reactance XTCSC. Therefore, the total line reactance decreases. This index demonstrates the sum of variation of real power flow in all lines with respect to the change of reactance of line j. m is a weighted fac- tor which can be selected higher for congested lines. In this study m is selected five for congested lines. Calculating of the j SI index can be performed using DC power flow equations [11]. But for accurate calcula- tion, this index is computed using AC power flow. For this purpose, the line reactance would be very little changed around the operating point subject to the other conditions are fixed. Hence j SI can be rewritten as: Copyright © 2012 SciRes. SGRE  A New Method for Optimal Placement of TCSC Based on Sensitivity Analysis for Congestion Management 13 10 l j N m jm mjX P SI X (24) This index is calculated for all the lines. After that SI- min and SImax are specified by sorting the SI values, nor- malized real power flow index is defined as: min max min j j SI SI SIn SI SI (25) TCSC must be placed in a line having the most posi- tive sensitivity index. 4. Optimal Setting of TCSC Using the Genetic Algorithm The genetic algorithm has been used to find the optimum sizing of TCSCs. Genetic algorithms are based on the mechanisms of natural selection. The principles and de- tails of the genetic algorithm have been presented in many references. 4.1. Objective Function The objective function has been made of the severity of the system loading by the following relationship: Minimize: 2 max 1 l n N Lm mLm S FS (26) where, L m P max : Apparent power flow in line m L m N P: The rated capacity of line-m l The objective function F will be small when all the lines are within their limits and reach a high value when there are overloads. Thus, it provides a good measure of severity of the line overloads for given state of the power system. Most of the works on contingency selection algo- rithms utilize the second order performance indices which, in general, suffer from masking effects. The lack of dis- crimination, in which the performance index for a case with many small violations may be comparable in value to the index for a case with one huge violation, is known as masking effect. By most of the operational standards, the system with one huge violation is much more severe than that with many small violations. Masking effect to some extent can be avoided using higher order perform- ance indices. However, in this study, the value of expo- nent has been taken as 2. : The number of power system lines 4.2. Initial Population Some responses as chromosomes of initial population must be created for starting algorithm. The length of each chromosome (the number of genes formed a chromo- some) is the number of decimal places. In fact every gene is a number between 0 - 9 and each chromosome shows exact the degree of series compensation (k) for TCSC. 4.3. Selection Operator The best solutions in the current population are selected by roulette wheel technique. 4.4. Crossover Operator Two random chromosomes in the middle generation are selected. Then a random number (n) between 1 to the length of chromosome are selected and pairs of selected chromosomes from n-th gene to later are swapped to each other to produce new chromosomes. 4.5. Mutation Operator To test each element for fitness and to avoid algorithm stopping at a local optimum some solutions are also ran- domly modified. Therefore a chromosome is selected randomly, then some of it genes are replaced with an- other random numbers. 5. Numerical Results The case study for examination of the proposed algo- rithm is the IEEE 14-bus system. All the loads of IEEE 14-bus system have been mod- eled by the following polynomial equations: 0 0 V PP V (27) 0 0 V QQV (28) where P0 and Q0 stand for the real and reactive powers consumed at a reference voltage V0. In this study the value of exponents have been taken as 1.6 and 1.8 . In addition a 30% increasing coefficient for active and reactive power loads rather than the base val- ues is considered. Having been calculated the real power flow sensitivity indices, the results are shown in Table 1 Regarding to the results shown in Table 1, line 1 - 5 has the most posi- tive sensitivity index. Therefore this line is selected for installing of TCSC. Analyzing the results of loading, it was clear this place is close to the most congested line 1 - 2. Figure 3 shows situation of this place on the network. The degree of compensation (k) is calculated as 0.59 by implementing the genetic algorithm. Table 2 shows the loading of lines in the base state and after placing TCSC in line 1 - 5. The most congested Copyright © 2012 SciRes. SGRE 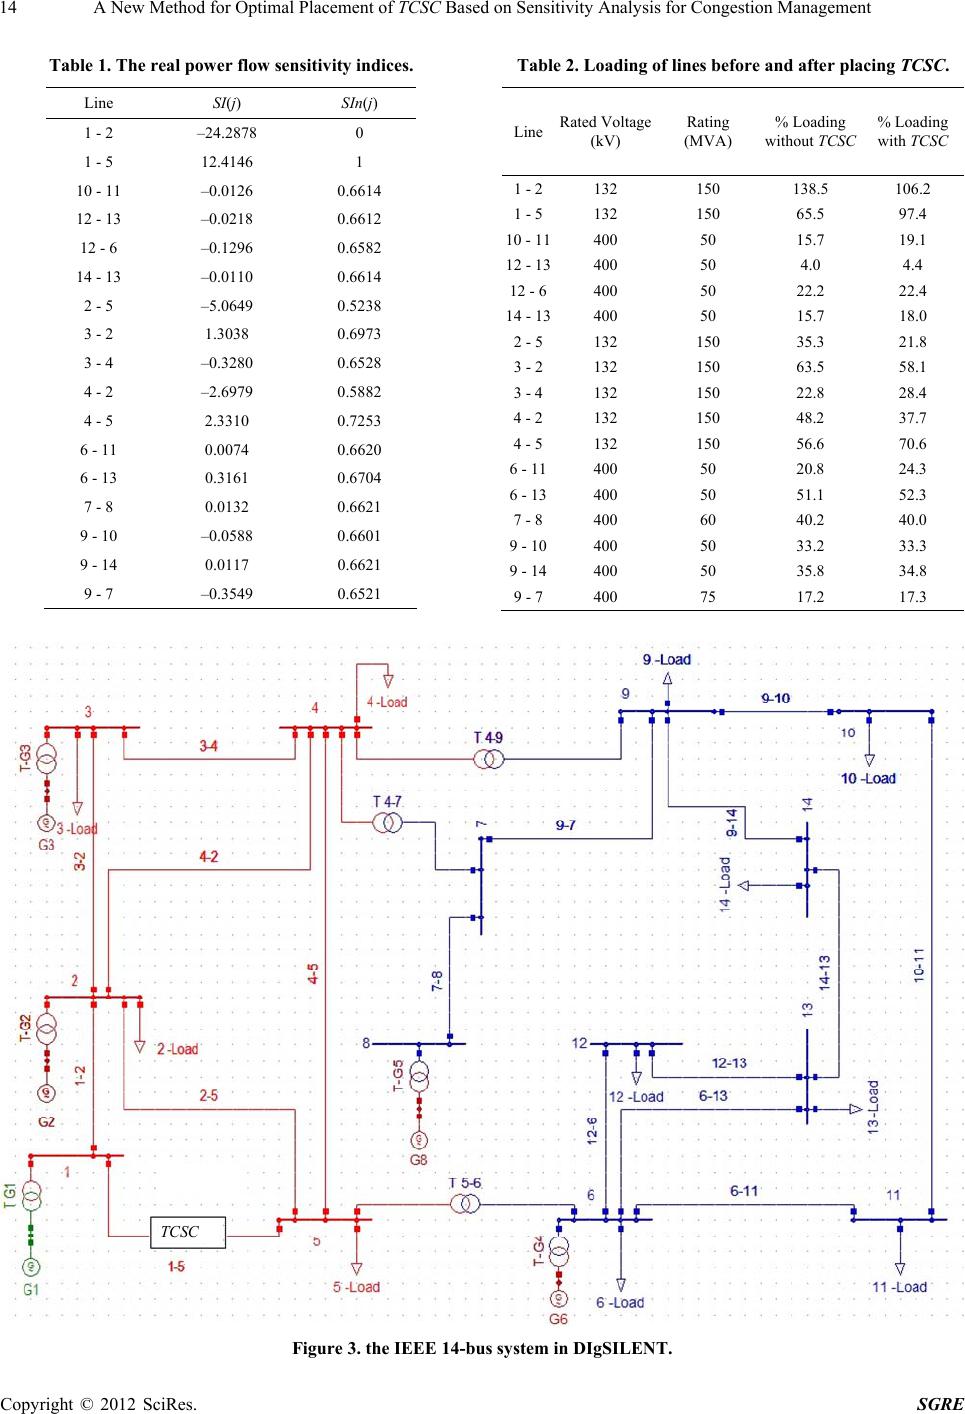 A New Method for Optimal Placement of TCSC Based on Sensitivity Analysis for Congestion Management Copyright © 2012 SciRes. SGRE 14 Table 2. Loading of lines before and after placing TCSC. Table 1. The real power flow sensitivity indices. Line Rated Voltage (kV) Rating (MVA) % Loading without TCSC % Loading with TCSC 1 - 2132 150 138.5 106.2 1 - 5132 150 65.5 97.4 10 - 11400 50 15.7 19.1 12 - 13400 50 4.0 4.4 12 - 6400 50 22.2 22.4 14 - 13400 50 15.7 18.0 2 - 5132 150 35.3 21.8 3 - 2132 150 63.5 58.1 3 - 4132 150 22.8 28.4 4 - 2132 150 48.2 37.7 4 - 5132 150 56.6 70.6 6 - 11400 50 20.8 24.3 6 - 13400 50 51.1 52.3 7 - 8400 60 40.2 40.0 9 - 10400 50 33.2 33.3 9 - 14400 50 35.8 34.8 9 - 7400 75 17.2 17.3 Line SI(j) SIn(j) 1 - 2 –24.2878 0 1 - 5 12.4146 1 10 - 11 –0.0126 0.6614 12 - 13 –0.0218 0.6612 12 - 6 –0.1296 0.6582 14 - 13 –0.0110 0.6614 2 - 5 –5.0649 0.5238 3 - 2 1.3038 0.6973 3 - 4 –0.3280 0.6528 4 - 2 –2.6979 0.5882 4 - 5 2.3310 0.7253 6 - 11 0.0074 0.6620 6 - 13 0.3161 0.6704 7 - 8 0.0132 0.6621 9 - 10 –0.0588 0.6601 9 - 14 0.0117 0.6621 9 - 7 –0.3549 0.6521 TCSC Figure 3. the IEEE 14-bus system in DIgSILENT. 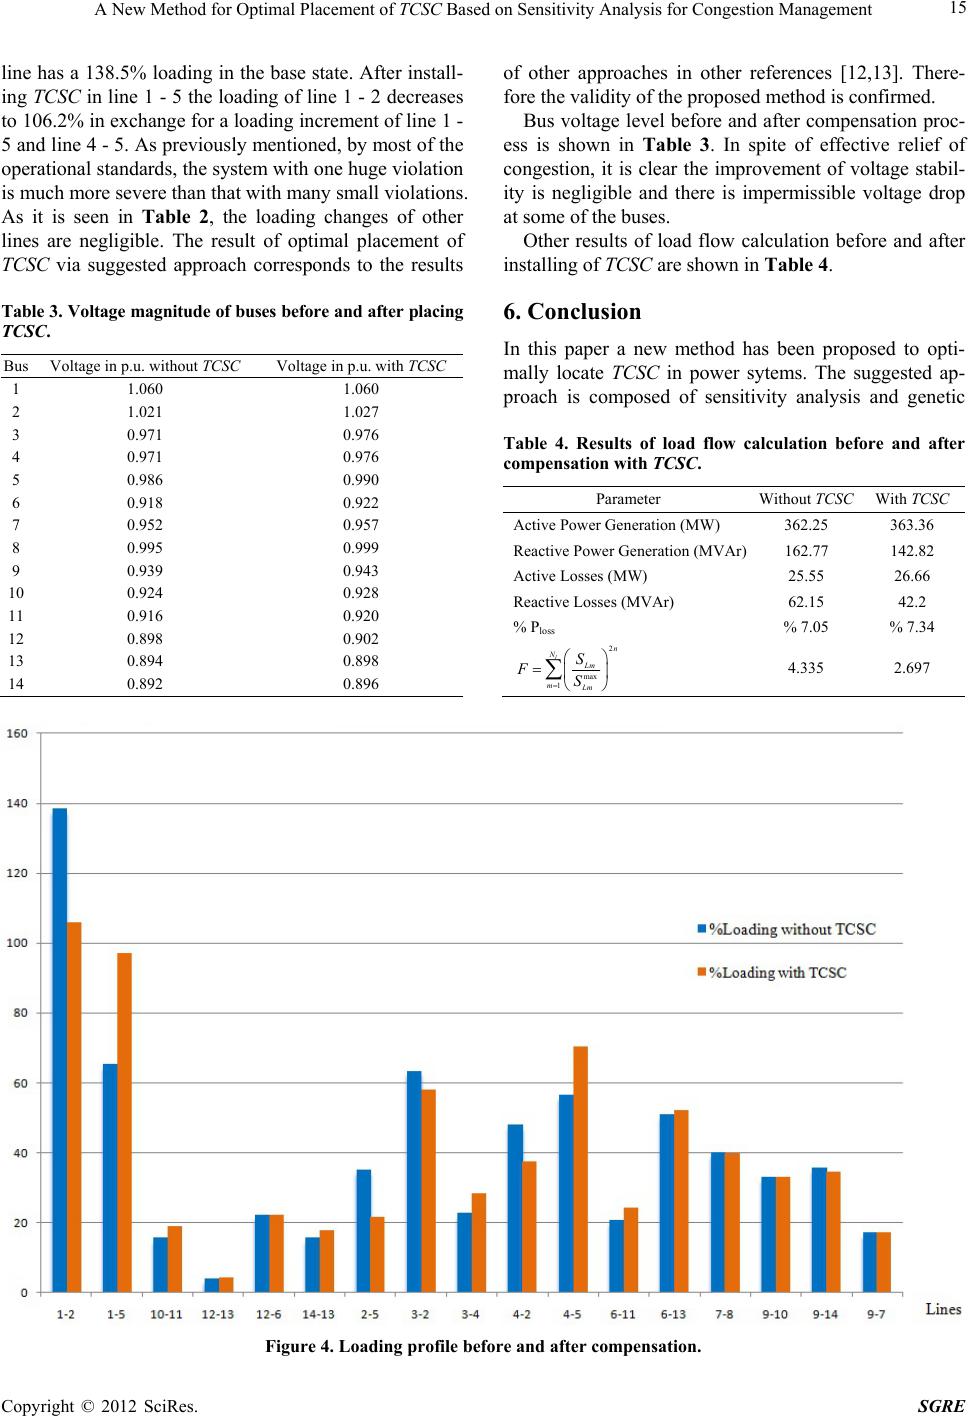 A New Method for Optimal Placement of TCSC Based on Sensitivity Analysis for Congestion Management 15 line has a 138.5% loading in the base state. After install- ing TCSC in line 1 - 5 the loading of line 1 - 2 decreases to 106.2% in exchange for a loading increment of line 1 - 5 and line 4 - 5. As previously mentioned, by most of the operational standards, the system with one huge violation is much more severe than that with many small violations. As it is seen in Table 2, the loading changes of other lines are negligible. The result of optimal placement of TCSC via suggested approach corresponds to the results Table 3. Voltag e magnitude of buses before and after placing TCSC. Bus Voltage in p.u. without TCSC Voltage in p.u. with TCSC 1 1.060 1.060 2 1.021 1.027 3 0.971 0.976 4 0.971 0.976 5 0.986 0.990 6 0.918 0.922 7 0.952 0.957 8 0.995 0.999 9 0.939 0.943 10 0.924 0.928 11 0.916 0.920 12 0.898 0.902 13 0.894 0.898 14 0.892 0.896 of other approaches in other references [12,13]. There- fore the validity of the proposed method is confirmed. Bus voltage level before and after compensation proc- ess is shown in Table 3. In spite of effective relief of congestion, it is clear the improvement of voltage stabil- ity is negligible and there is impermissible voltage drop at some of the buses. Other results of load flow calculation before and after installing of TCSC are shown in Table 4. 6. Conclusion In this paper a new method has been proposed to opti- mally locate TCSC in power sytems. The suggested ap- proach is composed of sensitivity analysis and genetic Table 4. Results of load flow calculation before and after compensation with TCSC. Parameter Without TCSC With TCSC Active Power Generation (MW) 362.25 363.36 Reactive Power Generation (MVAr) 162.77 142.82 Active Losses (MW) 25.55 26.66 Reactive Losses (MVAr) 62.15 42.2 % Ploss % 7.05 % 7.34 2 max 1 l n N Lm mLm S FS 4.335 2.697 Figure 4. Loading profile before and after compensation. Copyright © 2012 SciRes. SGRE 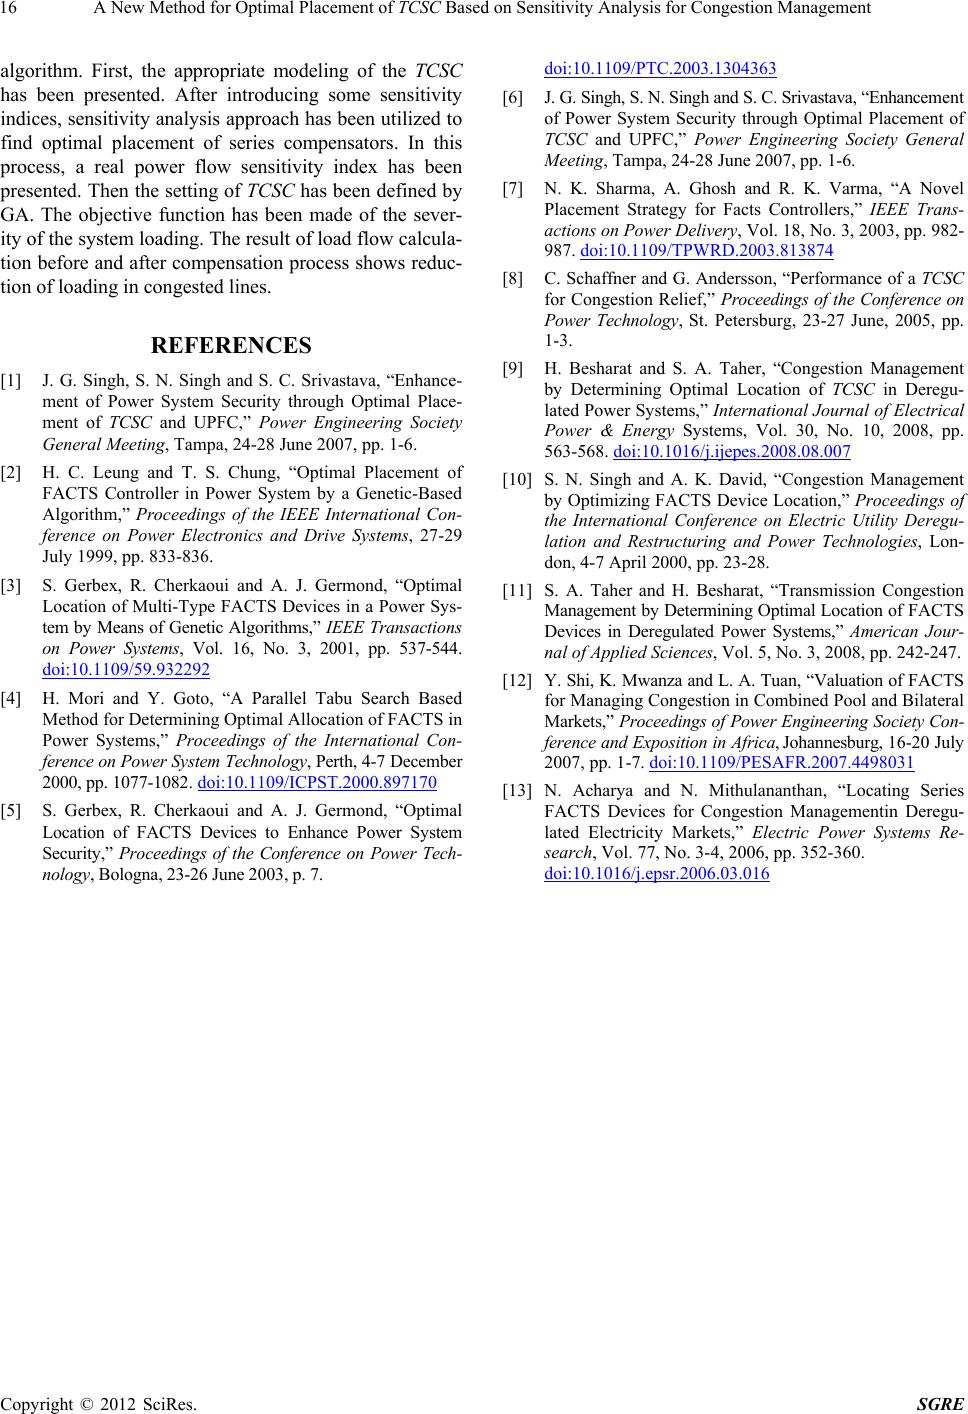 A New Method for Optimal Placement of TCSC Based on Sensitivity Analysis for Congestion Management 16 algorithm. First, the appropriate modeling of the TCSC has been presented. After introducing some sensitivity indices, sensitivity analysis approach has been utilized to find optimal placement of series compensators. In this process, a real power flow sensitivity index has been presented. Then the setting of TCSC has been defined by GA. The objective function has been made of the sever- ity of the system loading. The result of load flow calcula- tion before and after compensation process shows reduc- tion of loading in congested lines. REFERENCES [1] J. G. Singh, S. N. Singh and S. C. Srivastava, “Enhance- ment of Power System Security through Optimal Place- ment of TCSC and UPFC,” Power Engineering Society General Meeting, Tampa, 24-28 June 2007, pp. 1-6. [2] H. C. Leung and T. S. Chung, “Optimal Placement of FACTS Controller in Power System by a Genetic-Based Algorithm,” Proceedings of the IEEE International Con- ference on Power Electronics and Drive Systems, 27-29 July 1999, pp. 833-836. [3] S. Gerbex, R. Cherkaoui and A. J. Germond, “Optimal Location of Multi-Type FACTS Devices in a Power Sys- tem by Means of Genetic Algorithms,” IEEE Transactions on Power Systems, Vol. 16, No. 3, 2001, pp. 537-544. doi:10.1109/59.932292 [4] H. Mori and Y. Goto, “A Parallel Tabu Search Based Method for Determining Optimal Allocation of FACTS in Power Systems,” Proceedings of the International Con- ference on Power System Technology, Perth, 4-7 December 2000, pp. 1077-1082. doi:10.1109/ICPST.2000.897170 [5] S. Gerbex, R. Cherkaoui and A. J. Germond, “Optimal Location of FACTS Devices to Enhance Power System Security,” Proceedings of the Conference on Power Tech- nology, Bologna, 23-26 June 2003, p. 7. doi:10.1109/PTC.2003.1304363 [6] J. G. Singh, S. N. Singh and S. C. Srivastava, “Enhancement of Power System Security through Optimal Placement of TCSC and UPFC,” Power Engineering Society General Meeting, Tampa, 24-28 June 2007, pp. 1-6. [7] N. K. Sharma, A. Ghosh and R. K. Varma, “A Novel Placement Strategy for Facts Controllers,” IEEE Trans- actions on Power Delivery, Vol. 18, No. 3, 2003, pp. 982- 987. doi:10.1109/TPWRD.2003.813874 [8] C. Schaffner and G. Andersson, “Performance of a TCSC for Congestion Relief,” Proceedings of the Conference on Power Technology, St. Petersburg, 23-27 June, 2005, pp. 1-3. [9] H. Besharat and S. A. Taher, “Congestion Management by Determining Optimal Location of TCSC in Deregu- lated Power Systems,” International Journal of Electrical Power & Energy Systems, Vol. 30, No. 10, 2008, pp. 563-568. doi:10.1016/j.ijepes.2008.08.007 [10] S. N. Singh and A. K. David, “Congestion Management by Optimizing FACTS Device Location,” Proceedings of the International Conference on Electric Utility Deregu- lation and Restructuring and Power Technologies, Lon- don, 4-7 April 2000, pp. 23-28. [11] S. A. Taher and H. Besharat, “Transmission Congestion Management by Determining Optimal Location of FACTS Devices in Deregulated Power Systems,” American Jour- nal of Applied Sciences, Vol. 5, No. 3, 2008, pp. 242-247. [12] Y. Shi, K. Mwanza and L. A. Tuan, “Valuation of FACTS for Managing Congestion in Combined Pool and Bilateral Markets,” Proceedings of Power Engineering Society Con- ference and Exposition in Africa, Johannesburg, 16-20 July 2007, pp. 1-7. doi:10.1109/PESAFR.2007.4498031 [13] N. Acharya and N. Mithulananthan, “Locating Series FACTS Devices for Congestion Managementin Deregu- lated Electricity Markets,” Electric Power Systems Re- search, Vol. 77, No. 3-4, 2006, pp. 352-360. doi:10.1016/j.epsr.2006.03.016 Copyright © 2012 SciRes. SGRE |