

Paper Menu >>
Journal Menu >>
 International Journal of Geosciences, 2012, 3, 237-257 http://dx.doi.org/10.4236/ijg.2012.31027 Published Online February 2012 (http://www.SciRP.org/journal/ijg) Sequence Stratigraphic Analysis of “XB Field”, Central Swamp Depobelt, Niger Delta Basin, Southern Nigeria Samuel Okechukwu Onyekuru*, Emmanuel Chukwudi Ibelegbu, Julian Chukwuma Iwuagwu, Akan Godfrey Essien, Casmir Zanders Akaolisa Department of Geology, Federal University of Technology, Owerri, Nigeria Email: *[email protected] Received October 1, 2011; revised November 21, 2011; accepted December 26, 2011 ABSTRACT Well logs and biostratigraphic data from six wells in the “XB Field”, central Swamp Depobelt, Niger Delta were inte- grated to carry out a sequence stratigraphic analysis of depositional systems in the field. The analysis revealed four 3rd order depositional sequ ences (SEQ1 to 4) bounded by three erosional unconformities interp reted as Sequence Bounda- ries (SB1 to 3). Transgressive Surfaces of Erosion (TSE1 to 3) that mark the onset of marine flooding and turnarounds from progradational facies to retrogradational facies during sequence build-up were delineated. Three 3rd order Maxi- mum Flooding Surfaces (MFS1, MFS2 and MFS3) characterized by marker shales, high faunal abundance and diversity were also delineated and dated 15.9, 17.4 and 19.4 Ma, respectively. The delineated sequences comprised Lowstand Systems Tracts (progradational packages), Transgressive Systems Tracts (retrogradational packages) and Highstand Systems Tracts (aggradational packages), which reflect depositional systems deposited during different phases of base level changes. The Lowstand Systems Tract (LST) consists of Basin Floor Fans (BFF), Slope Fans and Channel Sands deposited when sea level was low and accommodation space lower than rate of sediment influx. Transgressive Systems Tract (TST) consists of retrogradational marine shales deposited during high relative sea levels and when accommoda- tion space was higher than rate of sediment influx. Highstand Systems Tracts (HST) consisted of shoreface sands dis- playing mostly aggradational to progradational stacking patterns. The sands of LST and HST show good reservoir qua- lities while the shales of the TSTs could fo rm poten tial reservoir seals. The abo ve recognized sequ ences, were deposited within the Neritic to Bathyal paleoenvironments and are dated mid-Miocene (15.9 - 20.4 Ma) in age. Keywords: Sequence Stratigraphy; Unconformities; Progradation; Retrogradational; Aggradational; Paleoenvironments and Reservoir 1. Introduction The stratigraphy of the Tertiary Niger Delta is co mplica- ted by syndepositional collapse of clastic wedges as shales of the underlying Akata Formation are mobilized under loads of the prograding overlying deposits of the deltaic Agbada and fluvial Benin Formations. This situation ma kes correlation of reservoirs of same genetic units difficult. The understanding of the geology, structure and reser- voir architecture and continuity of the Tertiary Niger Delta basin fills is expected to improve immensely with the ap - plication of a new and proven concept of sequence stra- tigraphy. Sequence Stratigraphy is the study of rocks re- lationships within a chronostratigraphic framework whe- rein the succession of rocks is cyclic and generally com- prised of genetically related stratal units [1]. The concept explains vertical and lateral variations of sedimentary suc- cessions in terms of relative sea level fluctuations and ba- sin tectonics. Sequence stratigraphic techniq ue was applied in the ana- lysis of six wells in the “XB Field”, in the western part of the Central Swamp Depobelt, Niger Delta Basin. The eva- luation ensured the subdivision of the delineated vertical sedimentary sections into genetically related depos itional sequences bounded by surfaces of same chronological age using wire line logs and biostratigraphic data. The vari- ous contemporaneously deposited sediment packages (sys- tems tracts) within the sequences were also mapped to b e able to reconstruct the depositional sequence model of the field, so that reservoir quality and arch itecture can be predicted. Source and reservoir rocks within the systems tracts were characterized and evaluated for hydrocarbon potential and trapping mechanisms. The area under study is located at the western end of the Central Swamp Depobelt of the Tertiary Niger Delta that lies between Latitudes 5˚N and 6˚N and Longitudes 5˚E and 6˚E, covering an areal extent of about 675 km2 (Figure 1). It is part of the Tertiary Niger Delta (Akata- Agbada) Petroleum System. The Niger Delta sedimentary *Corresponding author. C opyright © 2012 SciRes. IJG 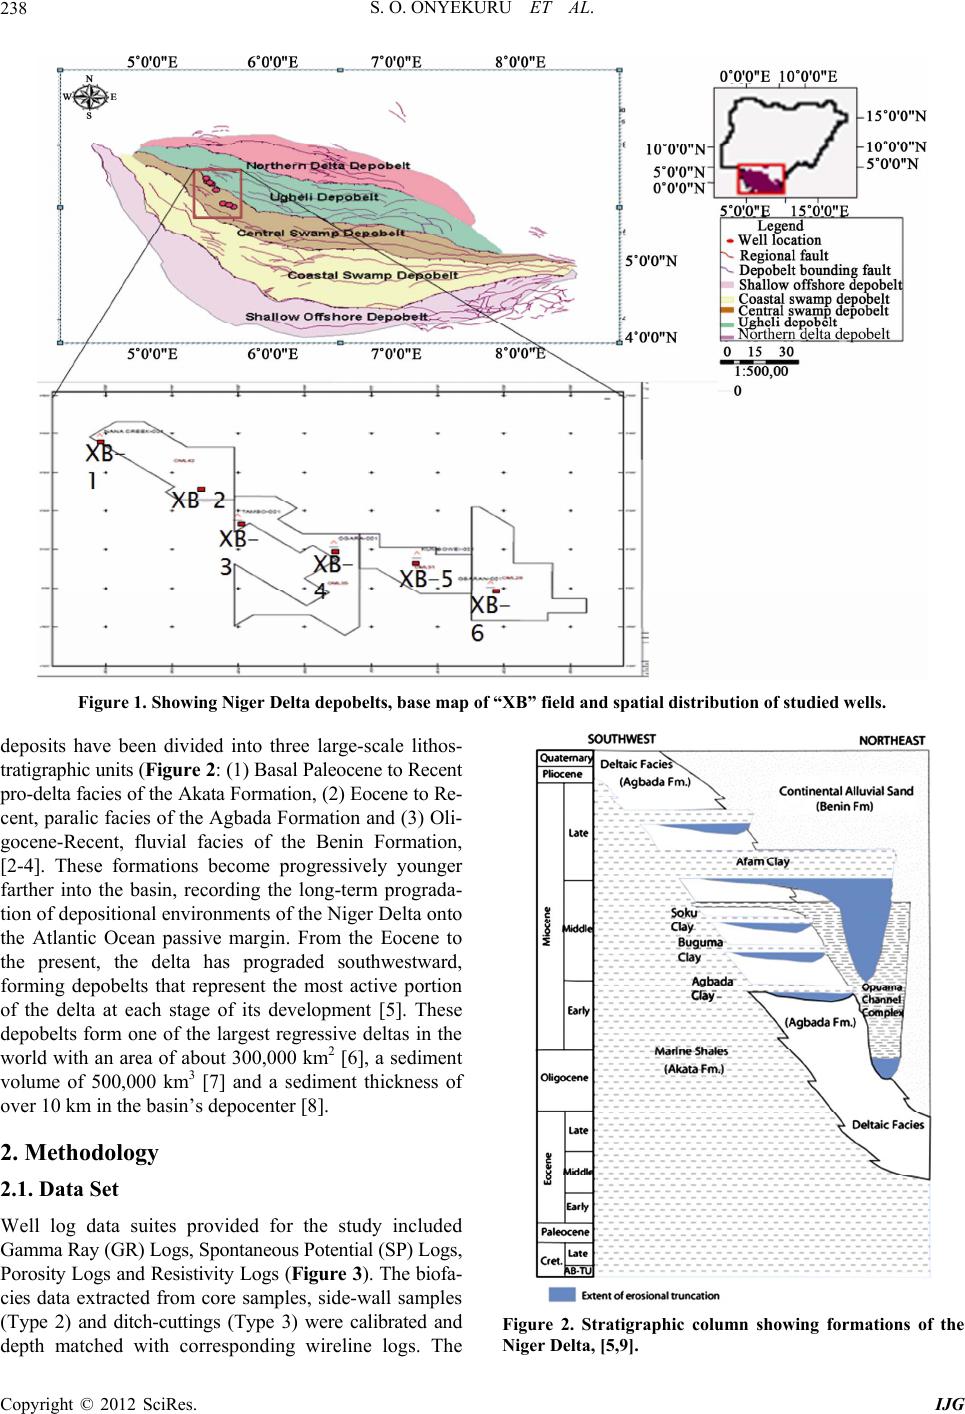 S. O. ONYEKURU ET AL. 238 Figure 1. Showing Niger Delta depobelts, base map of “XB” field and spatial distribution of studied w ells. deposits have been divided into three large-scale lithos- tratigraphic units (Figure 2: (1) Basal Paleocene to Recent pro-delta facies of the Akata Formation, (2) Eocene to Re- cent, paralic facies of the Agbada Formation and (3) Oli- gocene-Recent, fluvial facies of the Benin Formation, [2-4]. These formations become progressively younger farther into the basin, recording the long-term prograda- tion of depositional environments of the Niger Delta onto the Atlantic Ocean passive margin. From the Eocene to the present, the delta has prograded southwestward, forming depobelts that represent the most active portion of the delta at each stage of its development [5]. These depobelts form one of the largest regressive deltas in the world with an area of about 30 0,000 km2 [6], a sediment volume of 500,000 km3 [7] and a sediment thickness of over 10 km in the basin’s depocenter [8]. 2. Methodology 2.1. Data Set Well log data suites provided for the study included Gamma Ray (GR) Logs, Spontaneous Potential (SP) Logs, Porosity Logs and Resistivity Logs (Figure 3). The biofa- cies data extracted from core samples, side-wall samples (Type 2) and ditch-cuttings (Type 3) were calibrated and depth matched with corresponding wireline logs. The Figure 2. Stratigraphic column showing formations of the Niger Delta, [5,9]. Copyright © 2012 SciRes. IJG 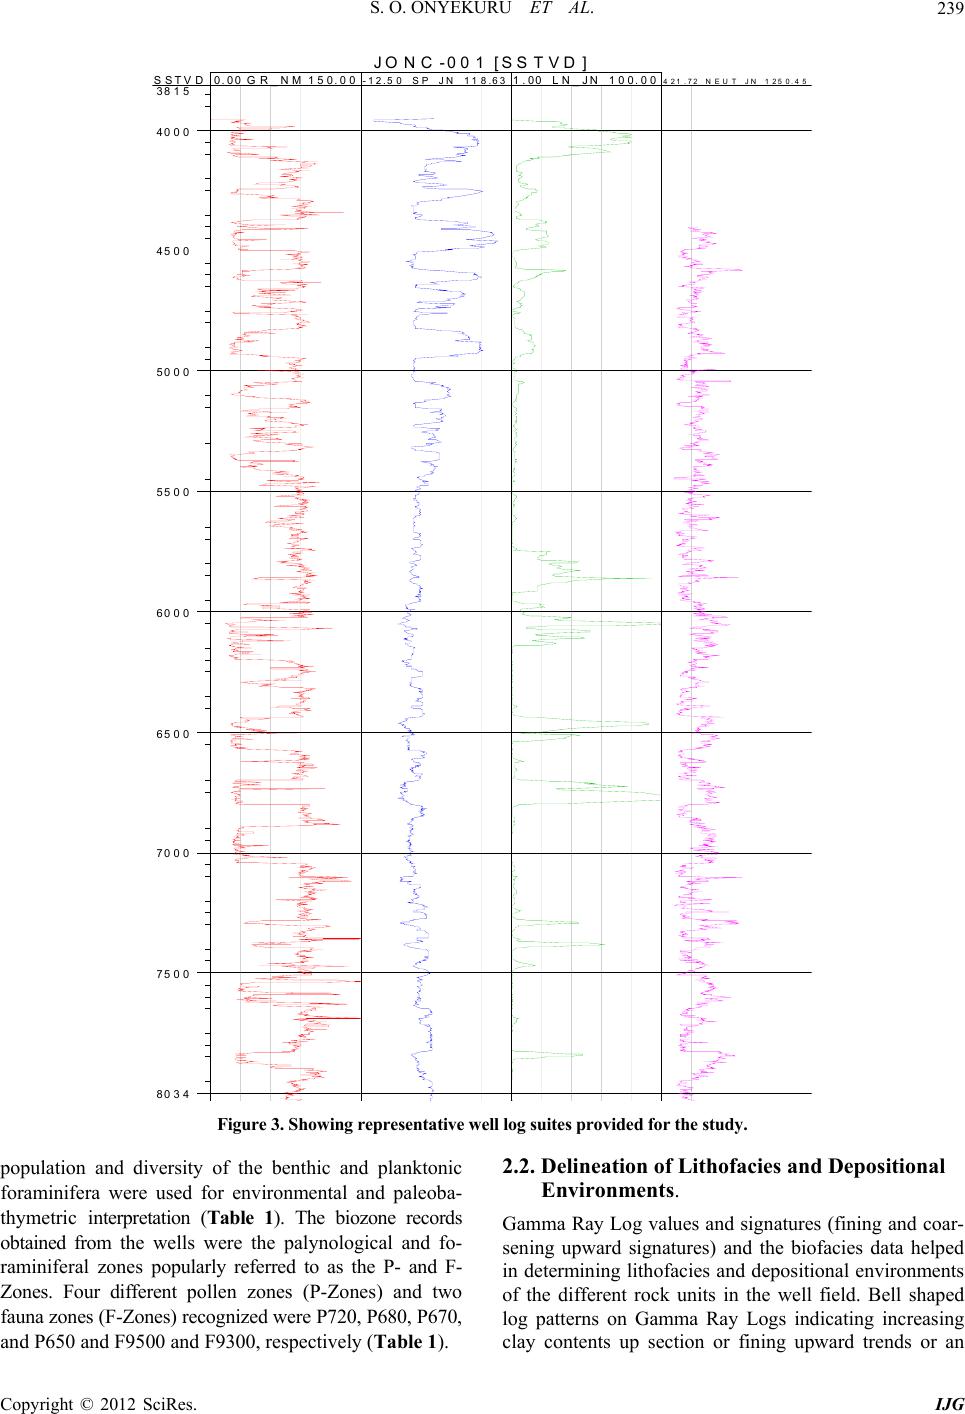 S. O. ONYEKURU ET AL. 239 SSTVD 40 0 0 45 0 0 50 0 0 55 0 0 60 0 0 65 0 0 70 0 0 75 0 0 80 3 4 38 1 50.001 5 0.0 0GR_NM -12.5011 8.63SP_JN 1.00100.00LN_JN421.72 1250.45NEUT_JN JONC-001 [S ST V D] Figure 3. Showing representative well log suites provided for the study. population and diversity of the benthic and planktonic foraminifera were used for environmental and paleoba- thymetric interpretation (Table 1). The biozone records obtained from the wells were the palynological and fo- raminiferal zones popularly referred to as the P- and F- Zones. Four different pollen zones (P-Zones) and two fauna zones (F-Zones) recognized were P720, P680, P670, and P650 and F9500 and F9300, respectively (Table 1). 2.2. Delineation of Lithofacies and Depositional Environments. Gamma Ray Log values and signatures (fining and coar- sening upward signatures) and the biofacies data helped in determining lithofacies and depositional environments of the different rock units in the well field. Bell shaped log patterns on Gamma Ray Logs indicating increasing clay contents up section or fining upward trends or an Copyright © 2012 SciRes. IJG 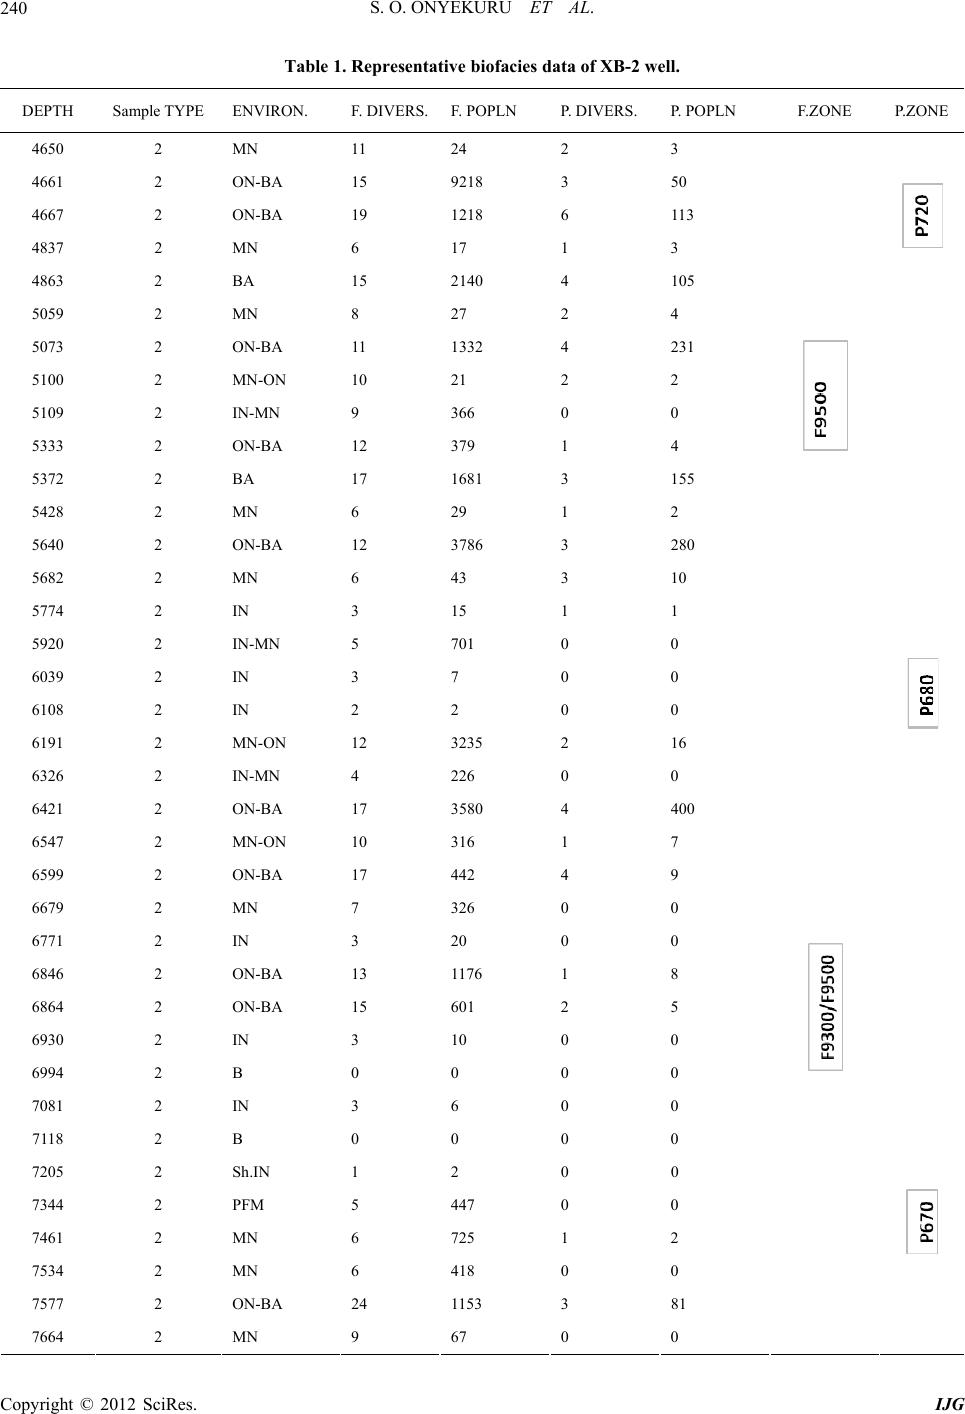 S. O. ONYEKURU ET AL. 240 Table 1. Representative biofacies data of XB-2 well. DEPTH Sample TYPE ENVIRON. F. DIVERS.F. POPLN P. DIVERS. P. POPLN F.ZONE P.ZONE 4650 2 MN 11 24 2 3 4661 2 ON-BA 15 9218 3 50 4667 2 ON-BA 19 1218 6 113 4837 2 MN 6 17 1 3 4863 2 BA 15 2140 4 105 5059 2 MN 8 27 2 4 5073 2 ON-BA 11 1332 4 231 5100 2 MN-ON 10 21 2 2 5109 2 IN-MN 9 366 0 0 5333 2 ON-BA 12 379 1 4 5372 2 BA 17 1681 3 155 5428 2 MN 6 29 1 2 5640 2 ON-BA 12 3786 3 280 5682 2 MN 6 43 3 10 5774 2 IN 3 15 1 1 5920 2 IN-MN 5 701 0 0 6039 2 IN 3 7 0 0 6108 2 IN 2 2 0 0 6191 2 MN-ON 12 3235 2 16 6326 2 IN-MN 4 226 0 0 6421 2 ON-BA 17 3580 4 400 6547 2 MN-ON 10 316 1 7 6599 2 ON-BA 17 442 4 9 6679 2 MN 7 326 0 0 6771 2 IN 3 20 0 0 6846 2 ON-BA 13 1176 1 8 6864 2 ON-BA 15 601 2 5 6930 2 IN 3 10 0 0 6994 2 B 0 0 0 0 7081 2 IN 3 6 0 0 7118 2 B 0 0 0 0 7205 2 Sh.IN 1 2 0 0 7344 2 PFM 5 447 0 0 7461 2 MN 6 725 1 2 7534 2 MN 6 418 0 0 7577 2 ON-BA 24 1153 3 81 7664 2 MN 9 67 0 0 Copyright © 2012 SciRes. IJG 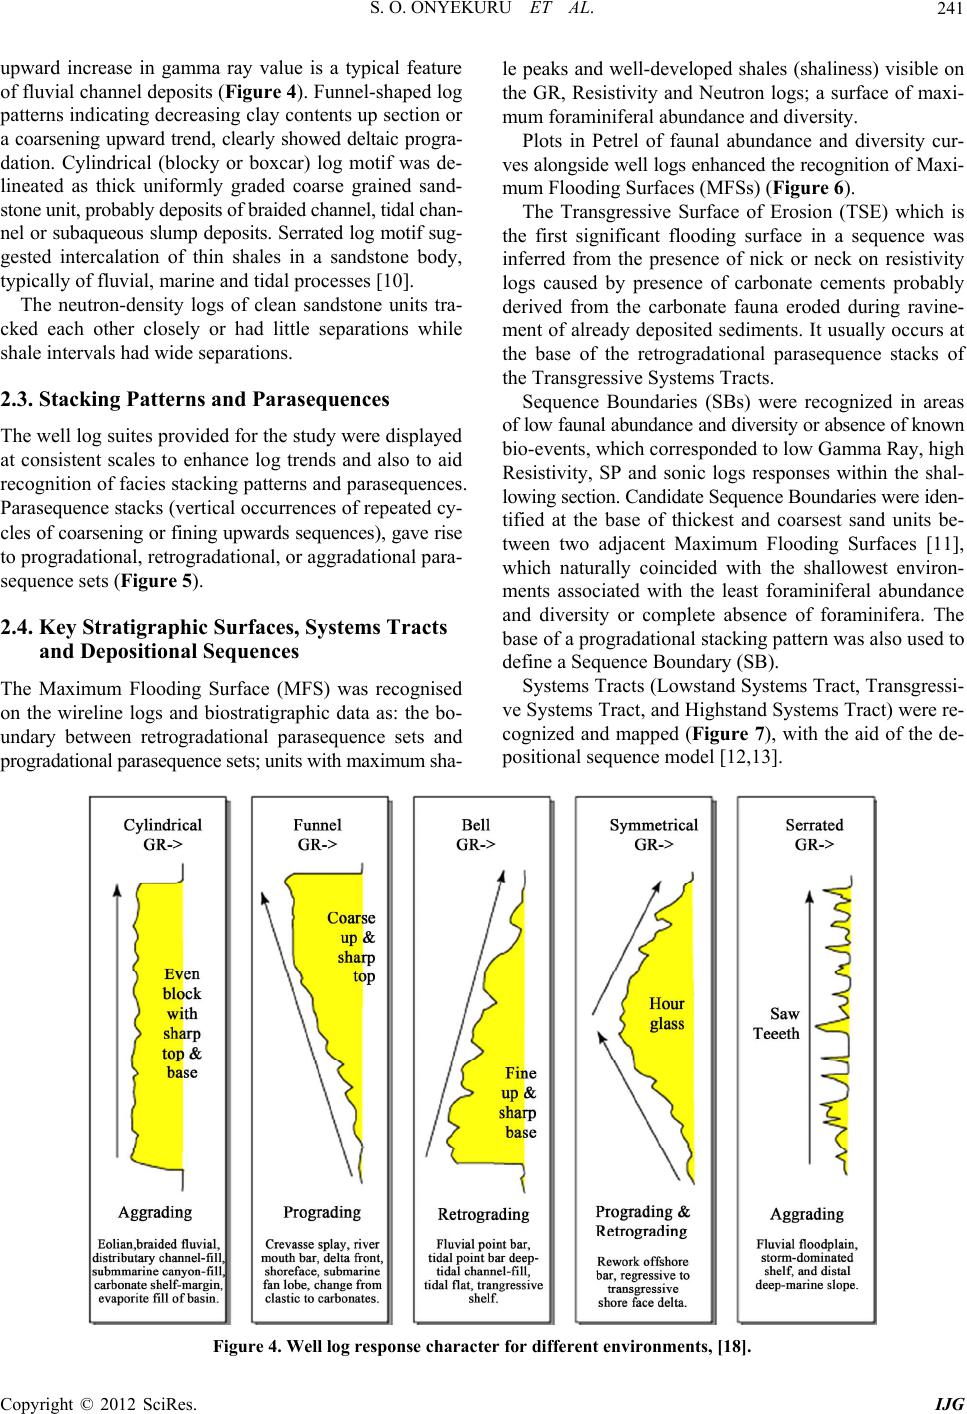 S. O. ONYEKURU ET AL. 241 upward increase in gamma ray value is a typical feature of fluvial channel deposits ( Figure 4). Funnel-shaped log patterns indicating decreasing clay contents up section or a coarsening upward trend, clearly showed deltaic progra- dation. Cylindrical (blocky or boxcar) log motif was de- lineated as thick uniformly graded coarse grained sand- stone unit, probably deposits of braided channel, tidal chan- nel or subaqueous slump deposits. Serrated log motif sug- gested intercalation of thin shales in a sandstone body, typically of fluvial, marine and tidal processes [10]. The neutron-density logs of clean sandstone units tra- cked each other closely or had little separations while shale intervals had wide separations. 2.3. Stacking Patterns and Parasequences The well log suites provid ed for the study were d isplayed at consistent scales to enhance log trends and also to aid recognition of facies stacking patterns and parasequences. Parasequence stacks (vertical occurrences of repeated cy- cles of coarsening or fining upwards sequences), gave rise to progradational, retrogradational, or aggradational para- sequence sets (Figure 5). 2.4. Key Stratigraphic Surfaces, Systems Tracts and Depositional Sequences The Maximum Flooding Surface (MFS) was recognised on the wireline logs and biostratigraphic data as: the bo- undary between retrogradational parasequence sets and progradational parasequence sets; units with maximum sha- le peaks and well-developed shales (shaliness) visible on the GR, Resistivity and Neutron logs; a surface of maxi- mum foraminiferal abundance and diversity. Plots in Petrel of faunal abundance and diversity cur- ves alongside well logs enhanced the recognition of Maxi- mum Flooding Surfaces (MFSs) (Figure 6). The Transgressive Surface of Erosion (TSE) which is the first significant flooding surface in a sequence was inferred from the presence of nick or neck on resistivity logs caused by presence of carbonate cements probably derived from the carbonate fauna eroded during ravine- ment of already deposited sediments. It usually occurs at the base of the retrogradational parasequence stacks of the Transgressive Systems Tracts. Sequence Boundaries (SBs) were recognized in areas of low faunal abundance and div ersity or absence of known bio-events, which corresponded to low Gamma Ray, high Resistivity, SP and sonic logs responses within the shal- lowing section. Candidate Sequence Boundaries were iden- tified at the base of thickest and coarsest sand units be- tween two adjacent Maximum Flooding Surfaces [11], which naturally coincided with the shallowest environ- ments associated with the least foraminiferal abundance and diversity or complete absence of foraminifera. The base of a progradational stacking pattern was also used to define a Sequence Boundary (SB). Systems Tracts (Lowstand Systems Tract, Transgressi- ve Systems Tract, and Highstand Systems Tract) were re- cognized and mapped (Figure 7), with the aid of the de- positional sequence model [12,13]. Figure 4. Well log response character for different environments, [18]. Copyright © 2012 SciRes. IJG 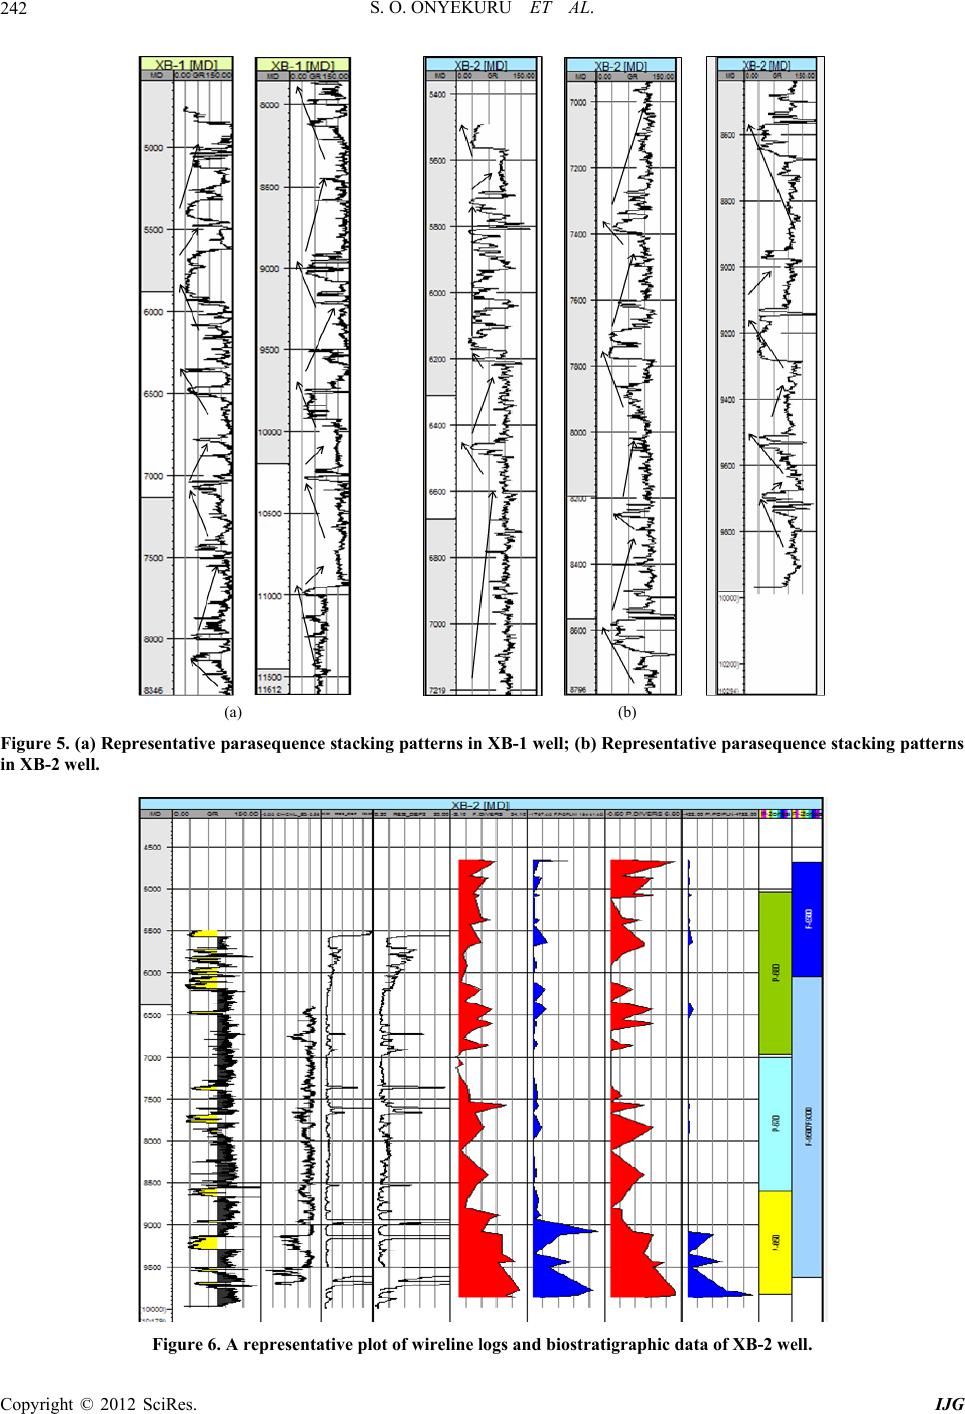 S. O. ONYEKURU ET AL. 242 (a) (b) Figure 5. (a) Representative parasequence stacking patterns in XB-1 well; (b) Representative parasequence stacking patterns in XB-2 well. Figure 6. A representative plot of wireline logs and biostratigraphic data of XB-2 well. Copyright © 2012 SciRes. IJG 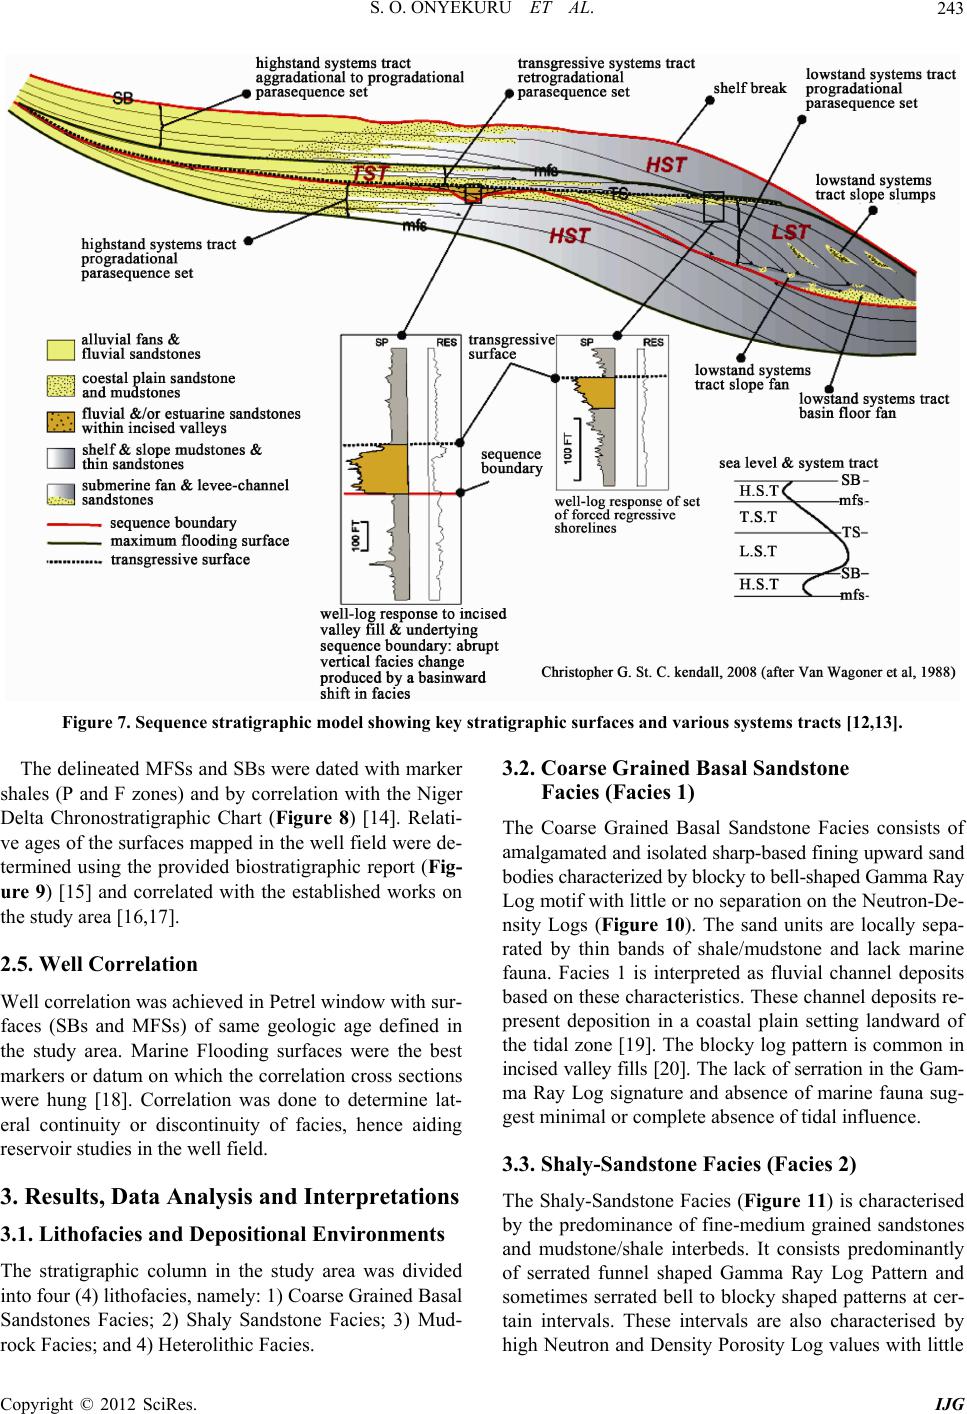 S. O. ONYEKURU ET AL. Copyright © 2012 SciRes. IJG 243 Figure 7. Sequence stratigraphic model showing key stratigraphic surfaces and various systems tracts [12,13]. 3.2. Coarse Grained Basal Sandstone Facies (Facies 1) The delineated MFSs and SBs were dated with marker shales (P and F zones) and by correlation with the Niger Delta Chronostratigraphic Chart (Figure 8) [14]. Relati- ve ages of the surfaces mapped in the well field were de- termined using the provided biostratigraphic report (Fig- ure 9) [15] and correlated with the established works on the study area [16,17]. The Coarse Grained Basal Sandstone Facies consists of amalgamated and isolated sharp-based fining upward sand bodies characterized by blocky to bell-shaped Gamma Ray Log motif with little or no separation on the Neutron-De- nsity Logs (Figure 10). The sand units are locally sepa- rated by thin bands of shale/mudstone and lack marine fauna. Facies 1 is interpreted as fluvial channel deposits based on these characteristics. These channel deposits re- present deposition in a coastal plain setting landward of the tidal zone [19]. The blocky log pattern is common in incised valley fills [20]. The lack of serration in the Gam- ma Ray Log signature and absence of marine fauna sug- gest minimal or complete absence of tidal influence. 2.5. Well Correlation Well correlation was achieved in Petrel window with sur- faces (SBs and MFSs) of same geologic age defined in the study area. Marine Flooding surfaces were the best markers or datum on which the correlation cross sections were hung [18]. Correlation was done to determine lat- eral continuity or discontinuity of facies, hence aiding reservoir studies in the well field. 3.3. Shaly-Sandstone Facies (Facies 2) 3. Results, Data Analysis and Interpretations The Shaly-Sandstone Facies (Figure 11) is characterised by the predominance of fine-medium grained sandstones and mudstone/shale interbeds. It consists predominantly of serrated funnel shaped Gamma Ray Log Pattern and sometimes serrated bell to blocky shaped patterns at cer- tain intervals. These intervals are also characterised by high Neutron and Density Poro sity Log values with little 3.1. Lithofacies and Depositional Environments The stratigraphic column in the study area was divided into four (4) lithofacies, namely: 1) Coarse Grained Basal Sandstones Facies; 2) Shaly Sandstone Facies; 3) Mud- rock Facies; and 4) Heterolithic Facies. 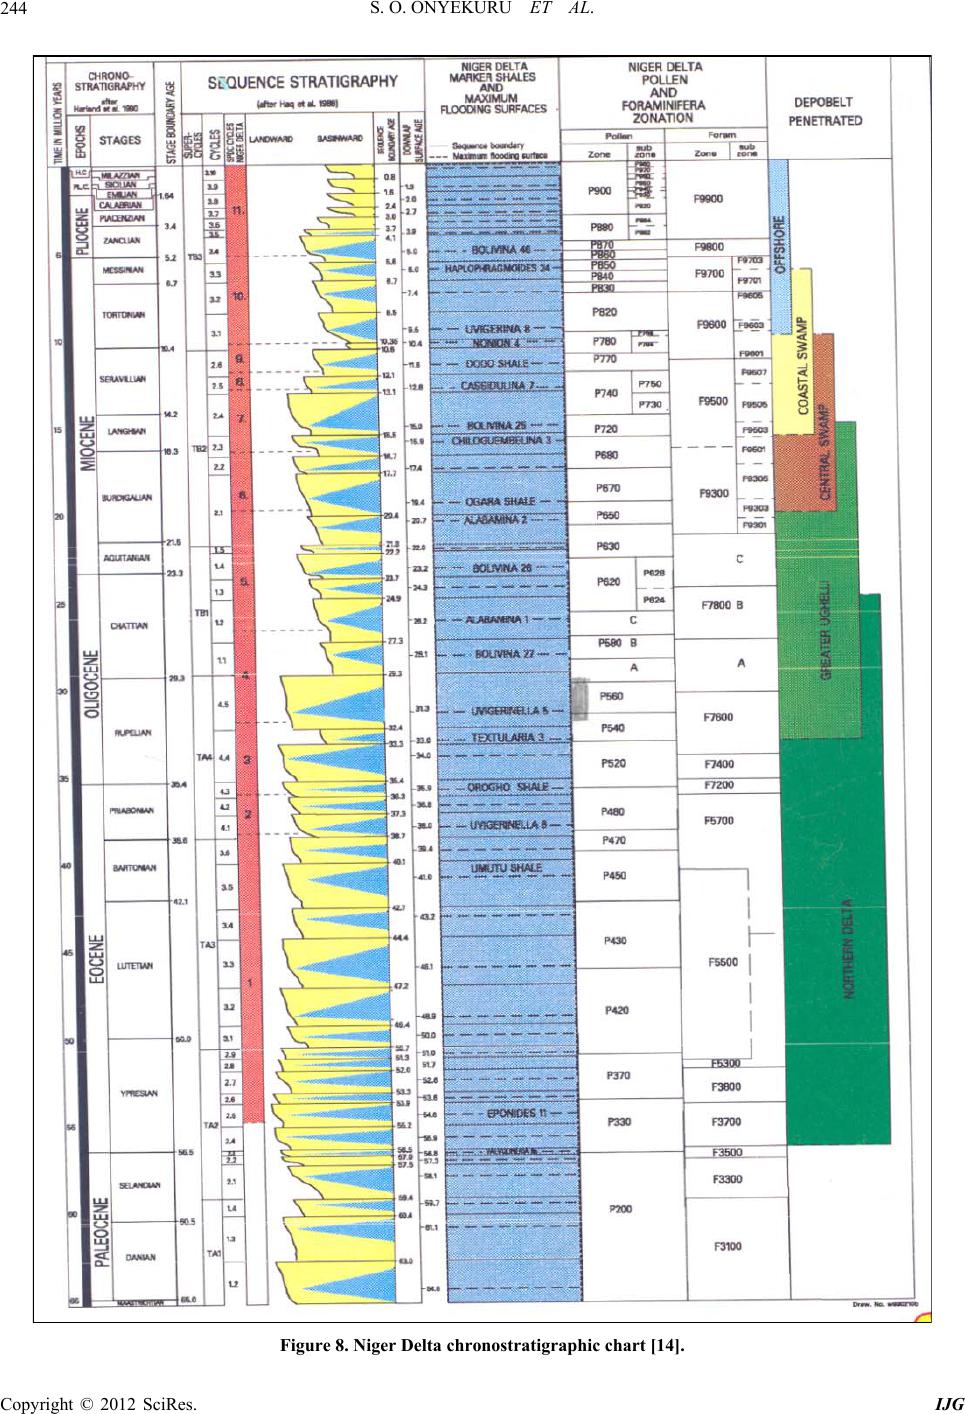 S. O. ONYEKURU ET AL. 244 Figure 8. Niger Delta chronostratig r a p h i c c h a r t [14]. Copyright © 2012 SciRes. IJG 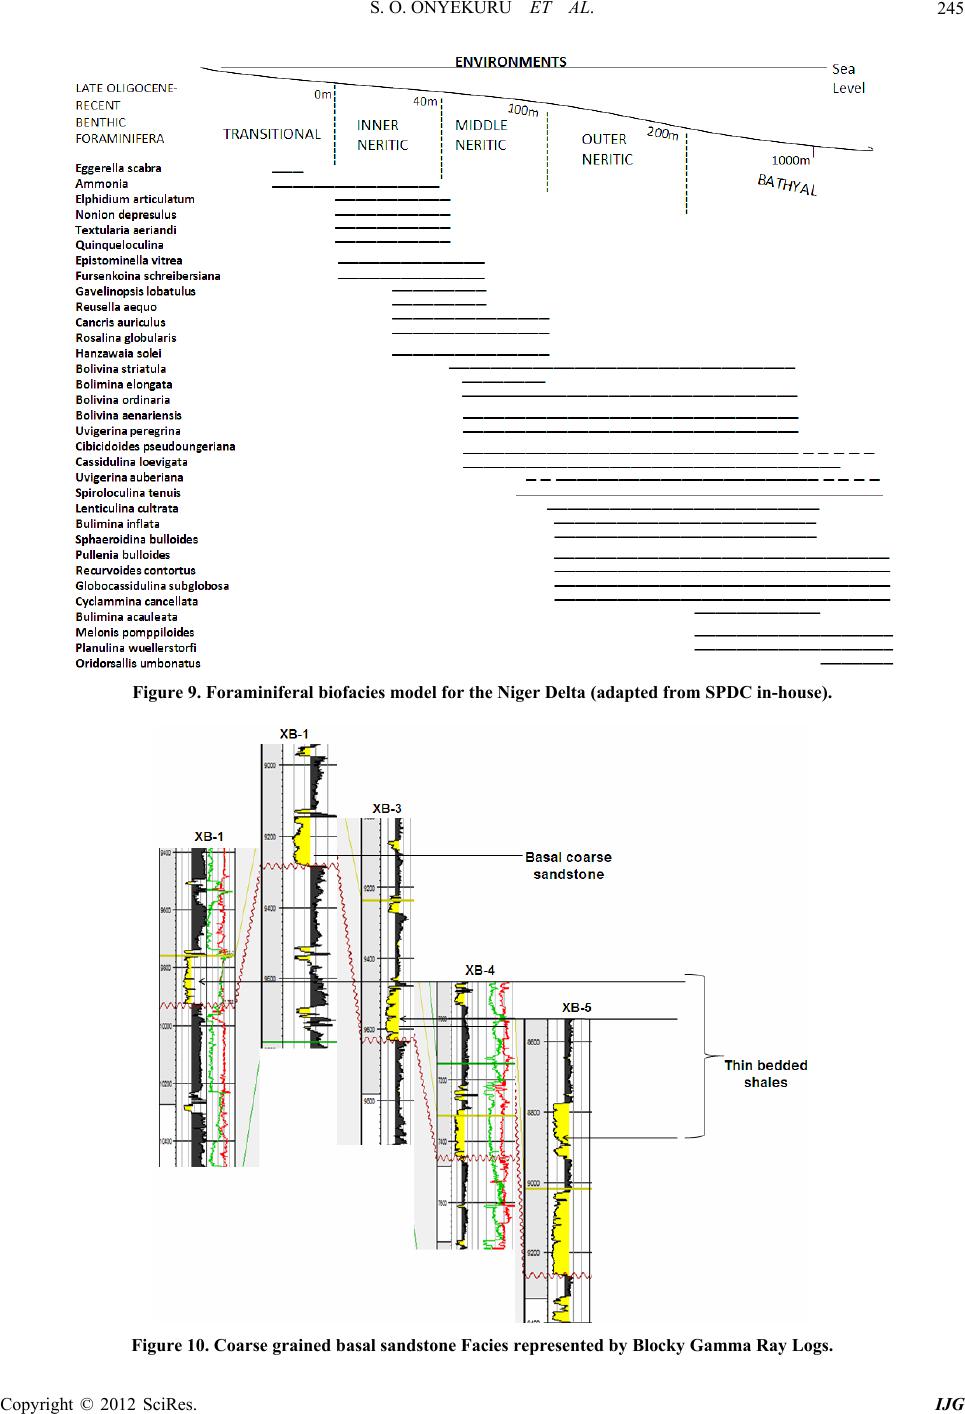 S. O. ONYEKURU ET AL. 245 Figure 9. Foraminiferal biofacies model for the Niger Delta (adapted from SPDC in-house). Figure 10. Coarse grained basal sandstone Facies represented by Blocky Gamma Ray Logs. Copyright © 2012 SciRes. IJG 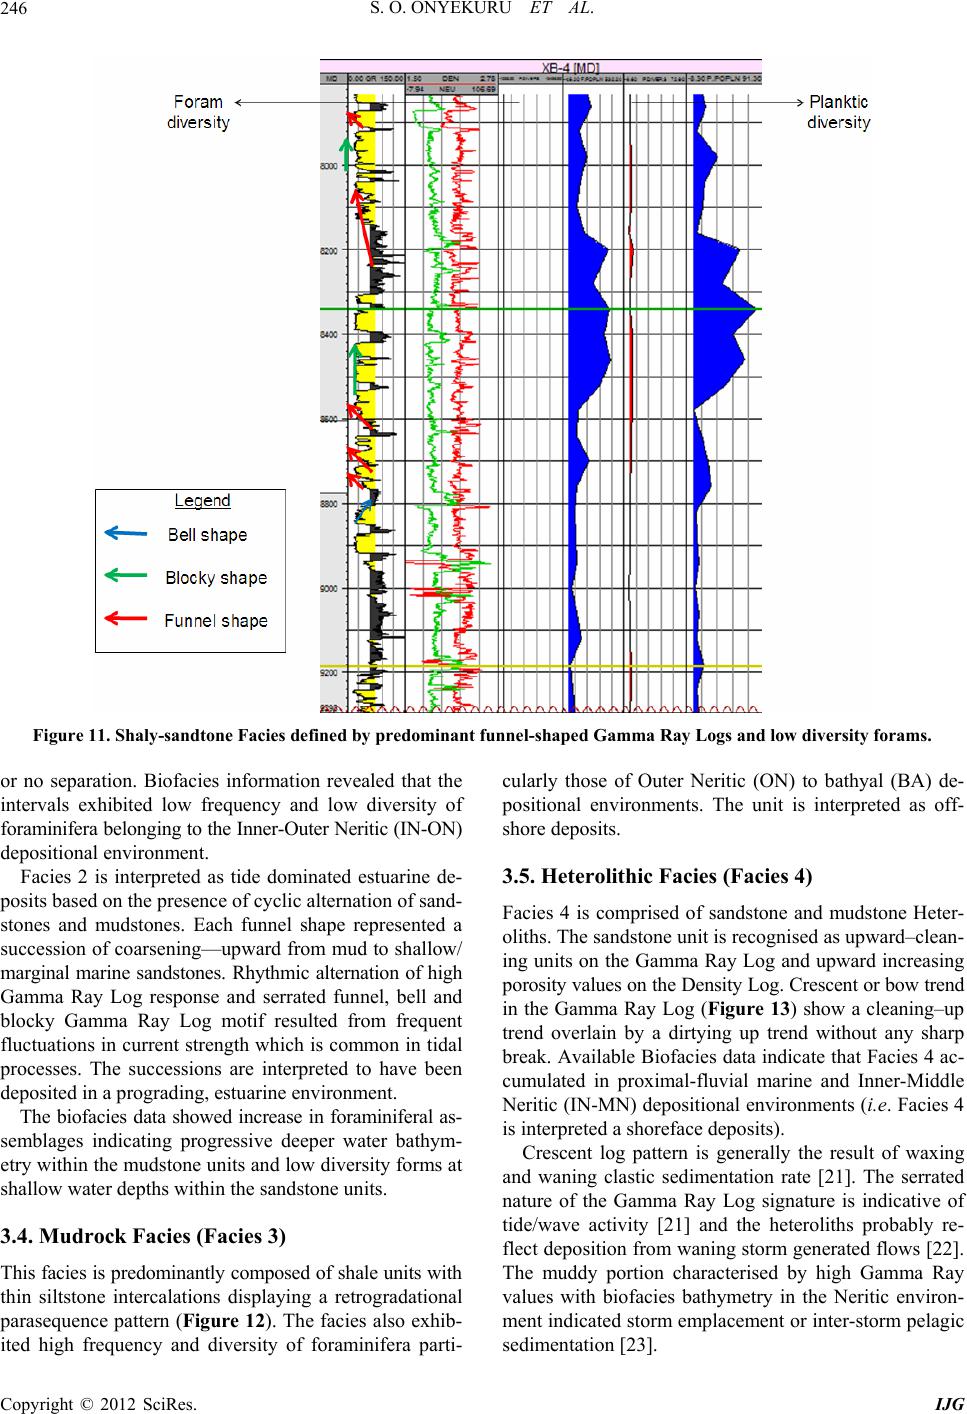 S. O. ONYEKURU ET AL. Copyright © 2012 SciRes. IJG 246 Figure 11. Shaly-sandtone Facie s de fine d by pre dominant funn el-shaped Gamma Ray Logs and low diversity forams. or no separation. Biofacies information revealed that the intervals exhibited low frequency and low diversity of foraminifera belonging to the Inner-Outer Neritic (IN-ON) depositional enviro nment. Facies 2 is interpreted as tide dominated estuarine de- posits based on the presence of cyclic alternation of sand- stones and mudstones. Each funnel shape represented a succession of coarsening—upward from mud to shallow/ marginal marine sandstones. Rhythmic alternation of high Gamma Ray Log response and serrated funnel, bell and blocky Gamma Ray Log motif resulted from frequent fluctuations in current strength which is common in tidal processes. The successions are interpreted to have been deposited in a progr ading, estuarine environmen t. The biofacies data showed increase in foraminiferal as- semblages indicating progressive deeper water bathym- etry within the mudstone units and low diversity forms at shallow water depths within the sandstone units. 3.4. Mudrock Facies (Facies 3) This facies is p redominantly composed of shale units with thin siltstone intercalations displaying a retrogradational parasequence pattern (Figure 12). The facies also exhib- ited high frequency and diversity of foraminifera parti- cularly those of Outer Neritic (ON) to bathyal (BA) de- positional environments. The unit is interpreted as off- shore deposit s. 3.5. Heterolithic Facies (Facies 4) Facies 4 is comprised of sandstone and mudstone Heter- oliths. The sandston e unit is recogn ised as upward –c lean- ing units on the Gamma Ray Log and upward increasing porosity values on the Density Log. Crescent or bow trend in the Gamma Ray Log (Figure 13) show a cleaning–up trend overlain by a dirtying up trend without any sharp break. Available Biofacies data indicate that Facies 4 ac- cumulated in proximal-fluvial marine and Inner-Middle Neritic (IN-MN) depositional environments (i.e. Facies 4 is interpreted a shoreface deposits). Crescent log pattern is generally the result of waxing and waning clastic sedimentation rate [21]. The serrated nature of the Gamma Ray Log signature is indicative of tide/wave activity [21] and the heteroliths probably re- flect deposition from waning storm generated flows [22]. The muddy portion characterised by high Gamma Ray values with biofacies bathymetry in the Neritic environ- ment indicated storm emplacement or inter-storm pelagic sedimentation [23]. 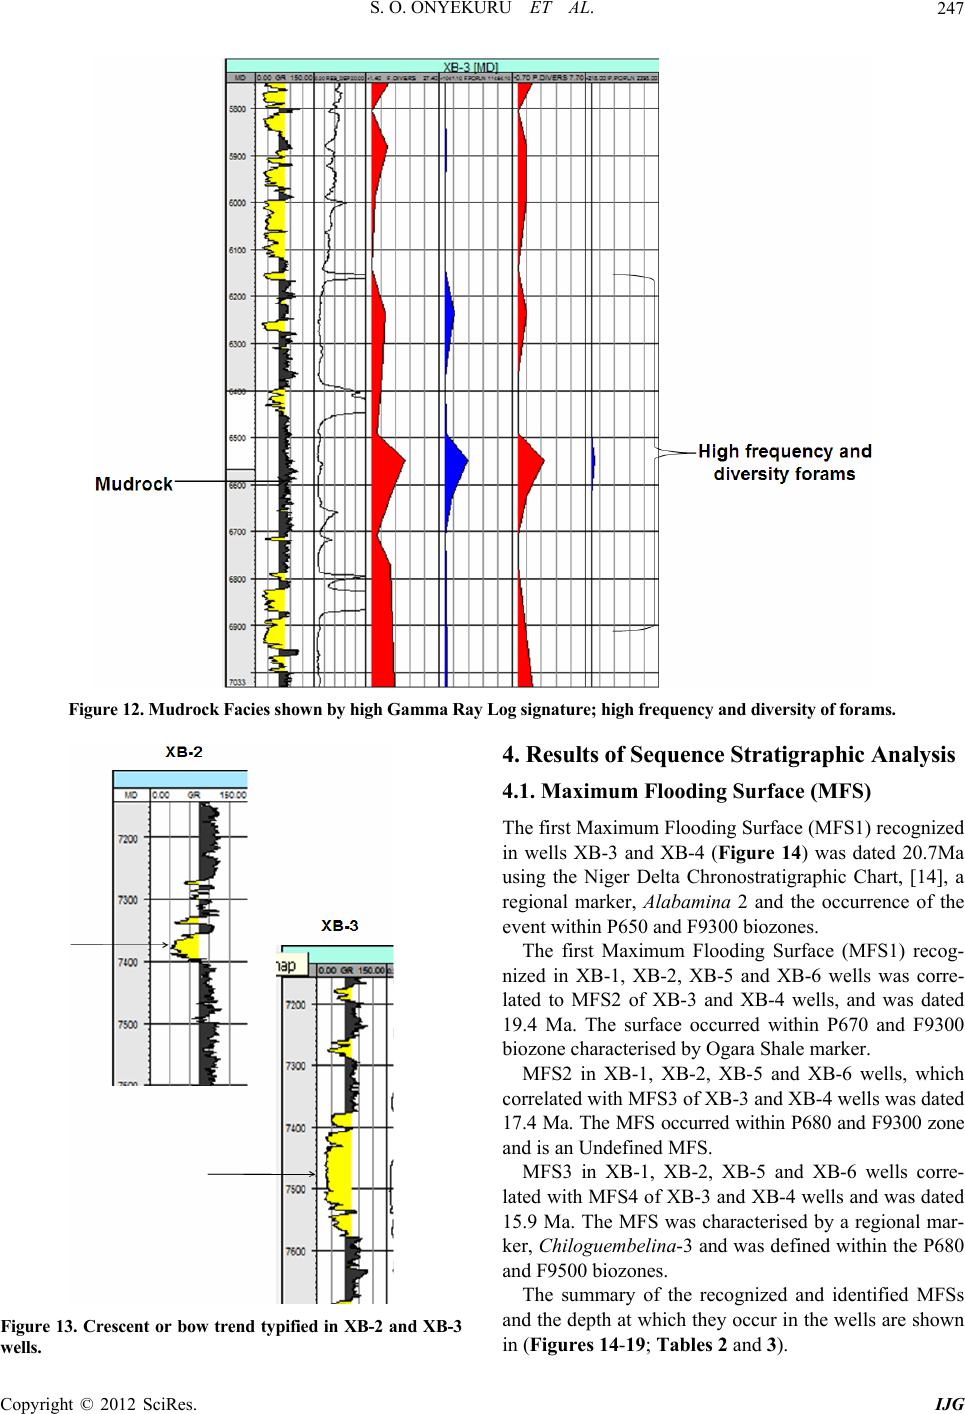 S. O. ONYEKURU ET AL. 247 Figure 12. Mudrock Facies shown by high Gamma Ray Log signature; high frequency and diversity of forams. Figure 13. Crescent or bow trend typified in XB-2 and XB-3 wells. 4. Results of Sequence Stratigraphic Analysis 4.1. Maximum Flooding Surface (MFS) The first Maximum Flooding Surface (MFS1) recognized in wells XB-3 and XB-4 (Figure 14) was dated 20.7Ma using the Niger Delta Chronostratigraphic Chart, [14], a regional marker, Alabamina 2 and the occurrence of the event within P650 and F9300 biozones. The first Maximum Flooding Surface (MFS1) recog- nized in XB-1, XB-2, XB-5 and XB-6 wells was corre- lated to MFS2 of XB-3 and XB-4 wells, and was dated 19.4 Ma. The surface occurred within P670 and F9300 biozone characterised by Ogara Shale marker. MFS2 in XB-1, XB-2, XB-5 and XB-6 wells, which correlated with MFS3 of XB-3 and XB-4 wells was dated 17.4 Ma. The MFS occurred within P680 and F9300 zone and is an Undefined MFS. MFS3 in XB-1, XB-2, XB-5 and XB-6 wells corre- lated with MFS4 of XB-3 and XB-4 wells and was dated 15.9 Ma. The MFS was characterised by a regional mar- ker, Chiloguembelina-3 and was defined within the P680 and F9500 biozones. The summary of the recognized and identified MFSs and the depth at which they occur in the wells are shown in (Figures 14-19; Tables 2 and 3). Copyright © 2012 SciRes. IJG 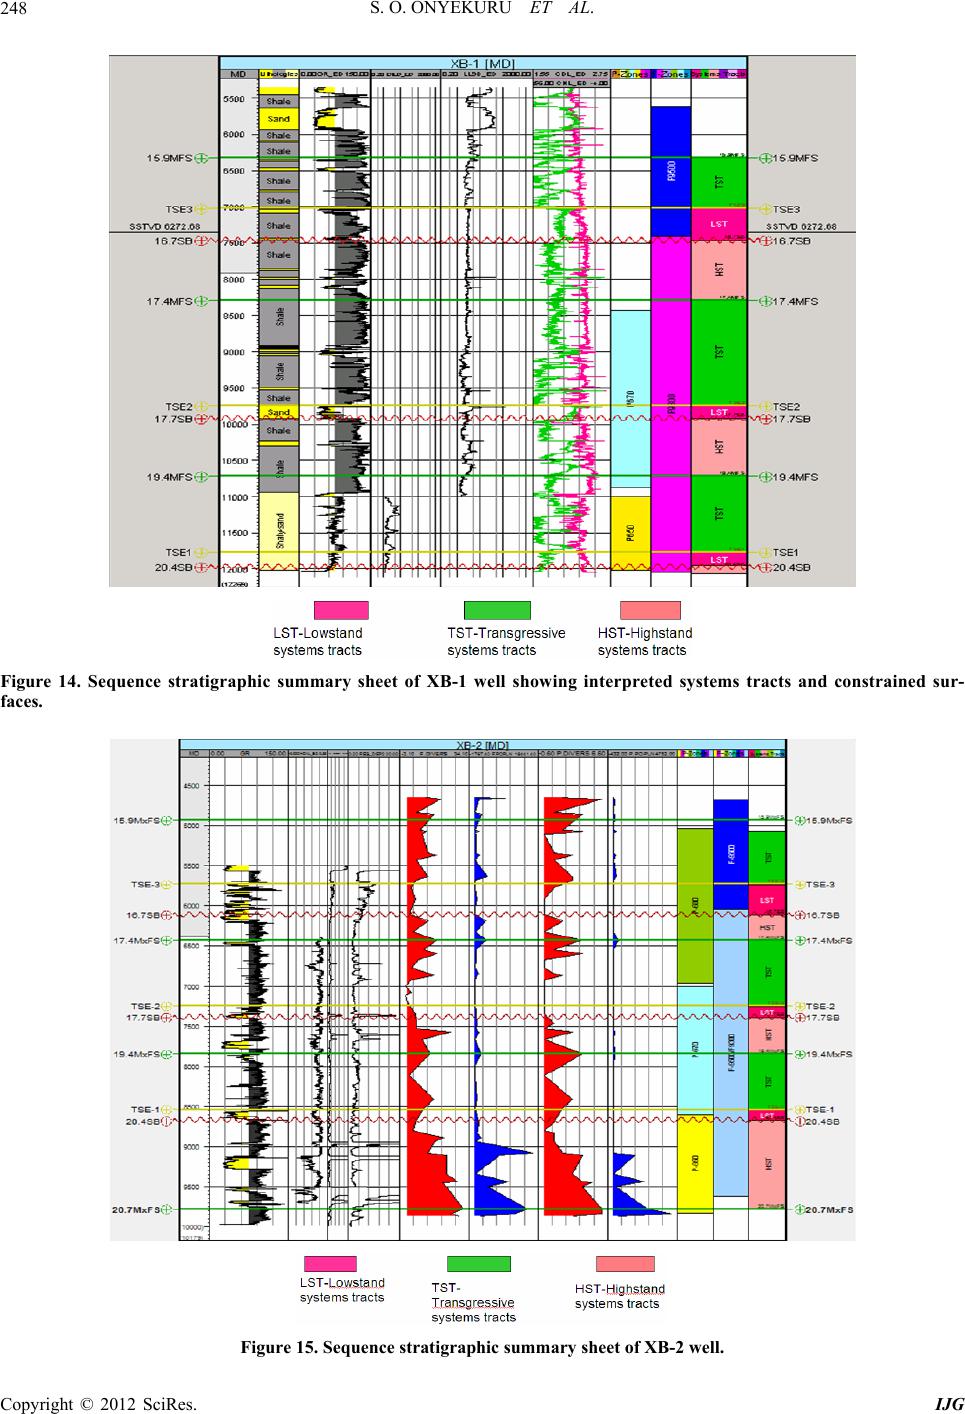 S. O. ONYEKURU ET AL. 248 Figure 14. Sequence stratigraphic summary sheet of XB-1 well showing interpreted systems tracts and constrained sur- faces. Figure 15. Sequence stratigraphic summary sheet of XB-2 well. Copyright © 2012 SciRes. IJG 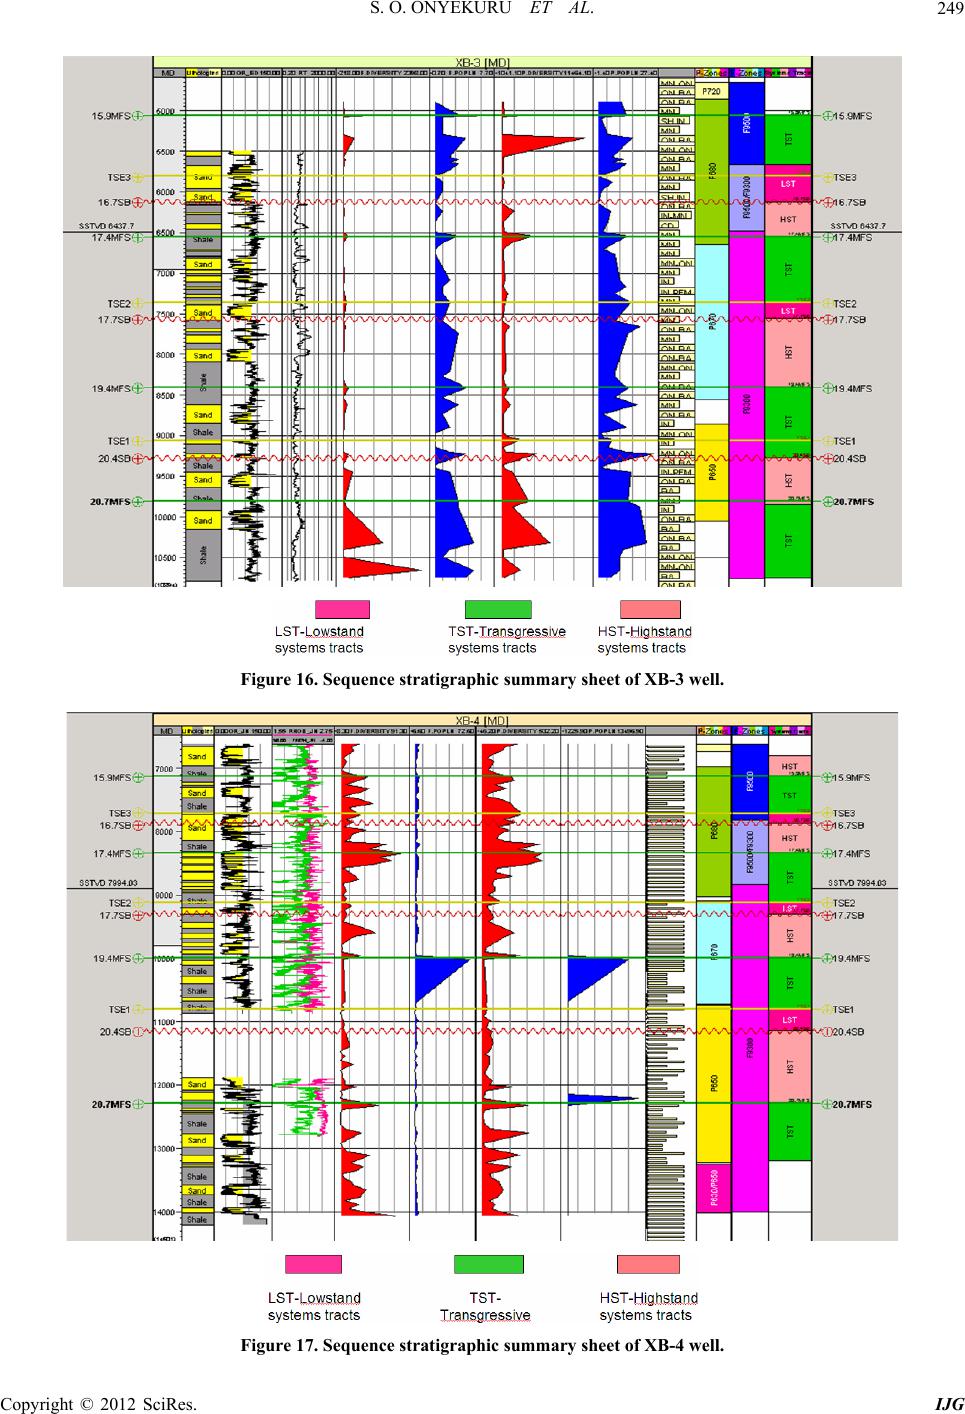 S. O. ONYEKURU ET AL. 249 Figure 16. Sequence stratigraphic summary sheet of XB-3 well. Figure 17. Sequence stratigraphic summary sheet of XB-4 well. Copyright © 2012 SciRes. IJG 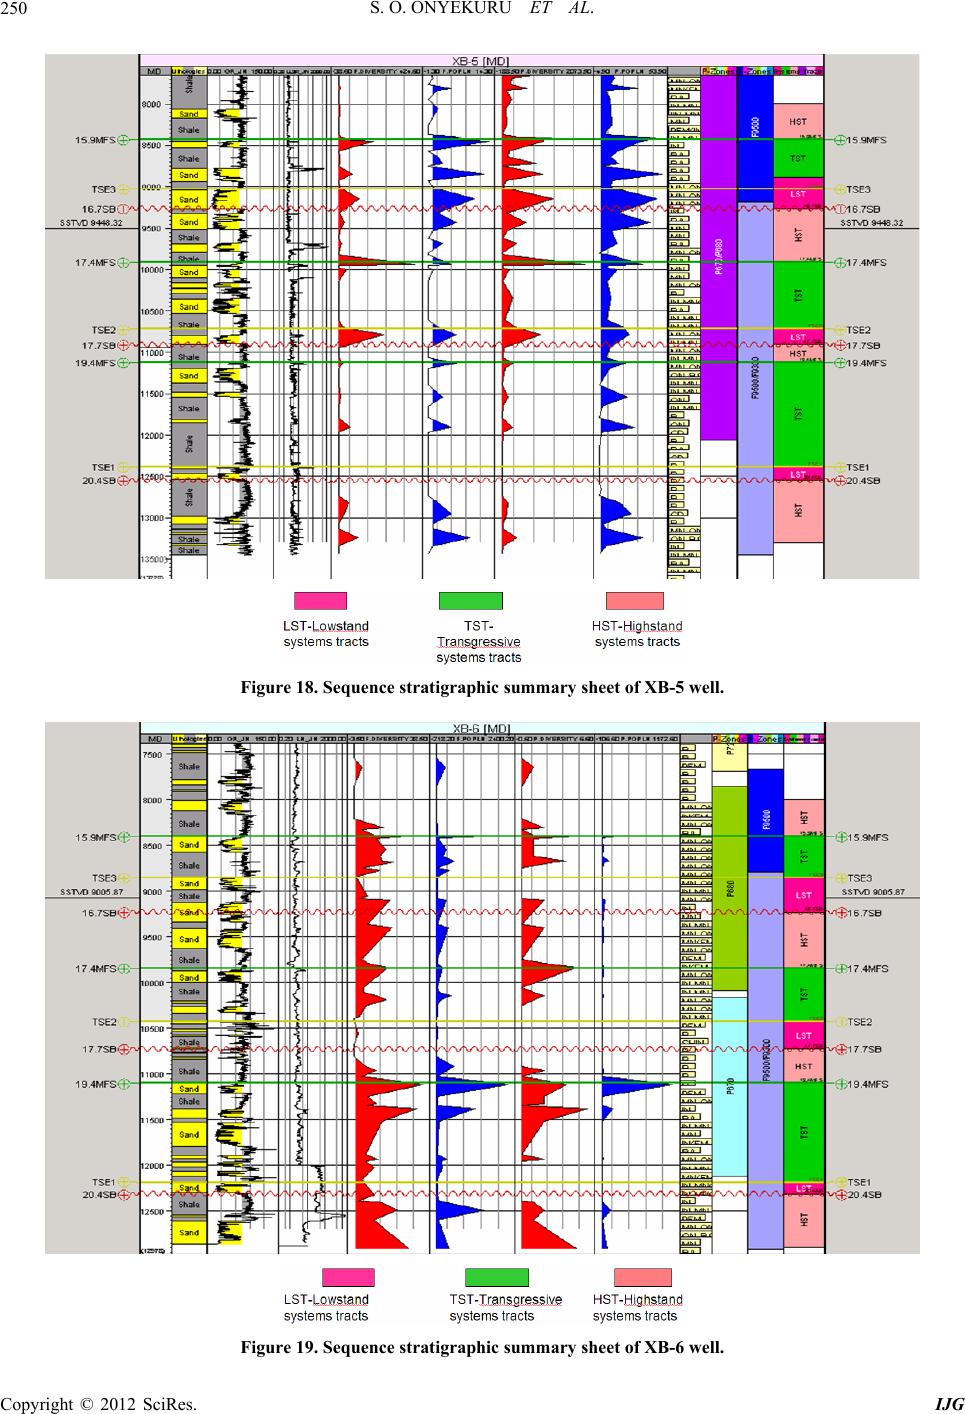 S. O. ONYEKURU ET AL. 250 Figure 18. Sequence stratigraphic summary sheet of XB-5 well. Figure 19. Sequence stratigraphic summary sheet of XB-6 well. Copyright © 2012 SciRes. IJG 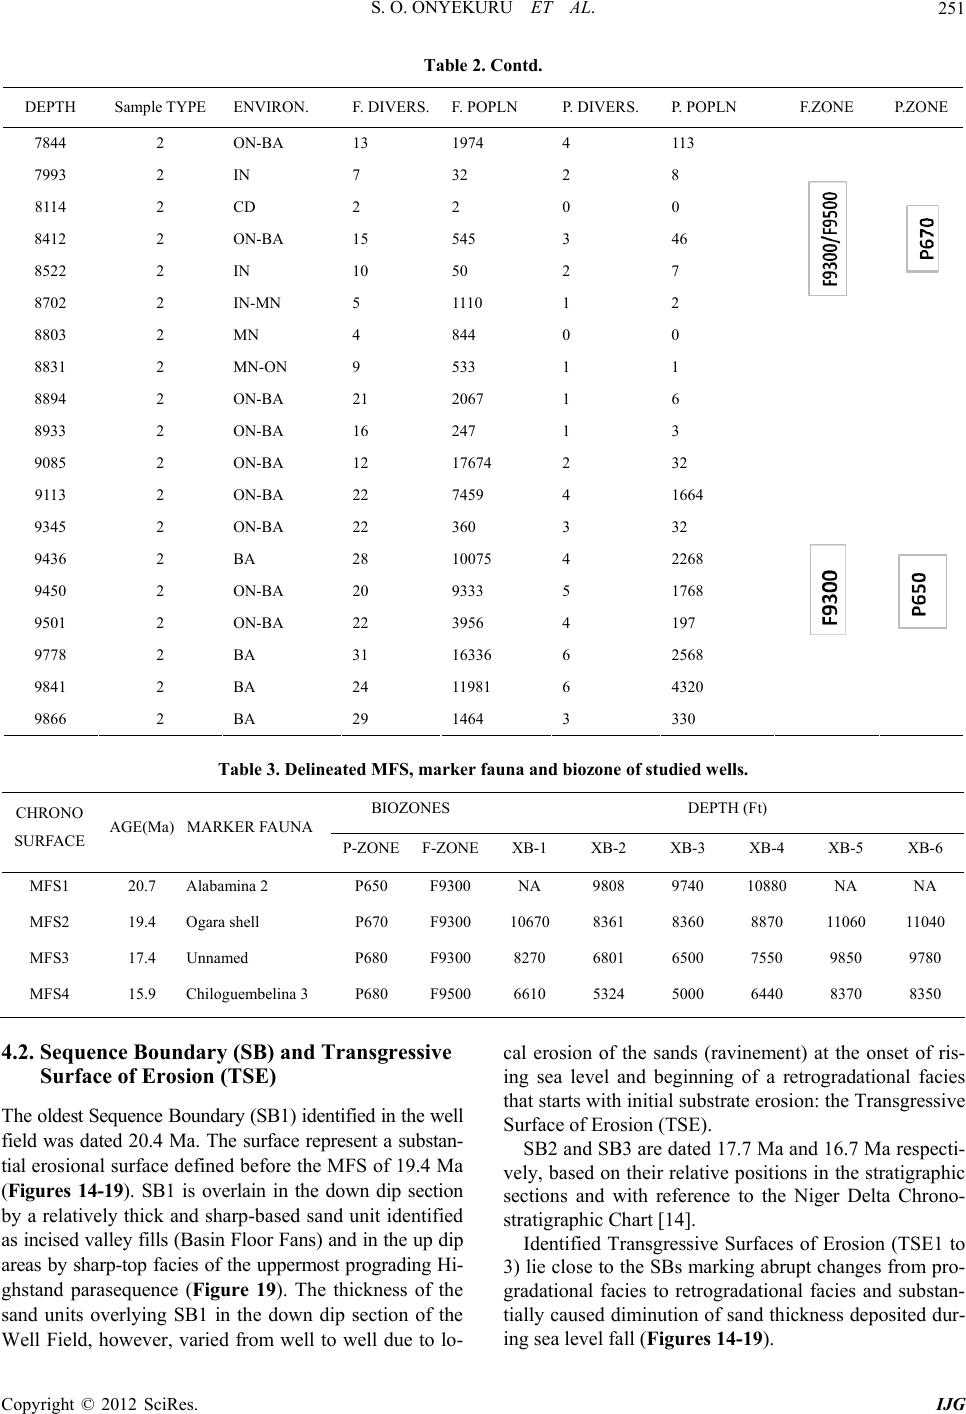 S. O. ONYEKURU ET AL. Copyright © 2012 SciRes. IJG 251 Table 2. Contd. DEPTH Sample TYPE ENVIRON. F. DIVERS.F. POPLN P. DIVERS. P. POPLN F.ZONE P.ZONE 7844 2 ON-BA 13 1974 4 113 7993 2 IN 7 32 2 8 8114 2 CD 2 2 0 0 8412 2 ON-BA 15 545 3 46 8522 2 IN 10 50 2 7 8702 2 IN-MN 5 1110 1 2 8803 2 MN 4 844 0 0 8831 2 MN-ON 9 533 1 1 8894 2 ON-BA 21 2067 1 6 8933 2 ON-BA 16 247 1 3 9085 2 ON-BA 12 17674 2 32 9113 2 ON-BA 22 7459 4 1664 9345 2 ON-BA 22 360 3 32 9436 2 BA 28 10075 4 2268 9450 2 ON-BA 20 9333 5 1768 9501 2 ON-BA 22 3956 4 197 9778 2 BA 31 16336 6 2568 9841 2 BA 24 11981 6 4320 9866 2 BA 29 1464 3 330 Table 3. Delineated MFS, marker fauna and biozone of studied wells. BIOZONES DEPTH (Ft) CHRONO SURFACE AGE(Ma) MARKER FAUNA P-ZONEF-ZONEXB-1 XB-2 XB-3 XB-4 XB-5 XB-6 MFS1 20.7 Alabamina 2 P650 F9300 NA 9808 9740 10880 NA NA MFS2 19.4 Ogara shell P670 F9300 10670 8361 8360 8870 11060 11040 MFS3 17.4 Unnamed P680 F9300 8270 6801 6500 7550 9850 9780 MFS4 15.9 Chiloguembelina 3 P680 F9500 6610 5324 5000 6440 8370 8350 4.2. Sequence Boundary (SB) and Transgressive Surface of Erosion (TSE) cal erosion of the sands (ravinement) at the onset of ris- ing sea level and beginning of a retrogradational facies that starts with initial substrate erosion: the Transgressive Surface of Erosion (TSE). The oldest Sequence Boundary (SB1) identified in the well field was dated 20.4 Ma. The surface represent a substan- tial erosional surface defined before the MFS of 19.4 Ma (Figures 14-19). SB1 is overlain in the down dip section by a relatively thick and sharp-based sand unit identified as incised valley fills (Basin Floor Fans) and in the up dip areas by sharp-top facies of the uppermost prograding Hi- ghstand parasequence (Figure 19). The thickness of the sand units overlying SB1 in the down dip section of the Well Field, however, varied from well to well due to lo- SB2 and SB3 are dated 17.7 Ma and 16.7 Ma respecti- vely, based on their relative pos itions in the stratigraphic sections and with reference to the Niger Delta Chrono- stratigraphic Chart [14]. Identified Transgressive Surfaces of Erosion (TSE1 to 3) lie close to the SBs marking abrupt changes from pro- gradational facies to retrogradational facies and substan- tially caused diminution of sand thickness deposited dur- ing sea level fall (Figures 14-19). 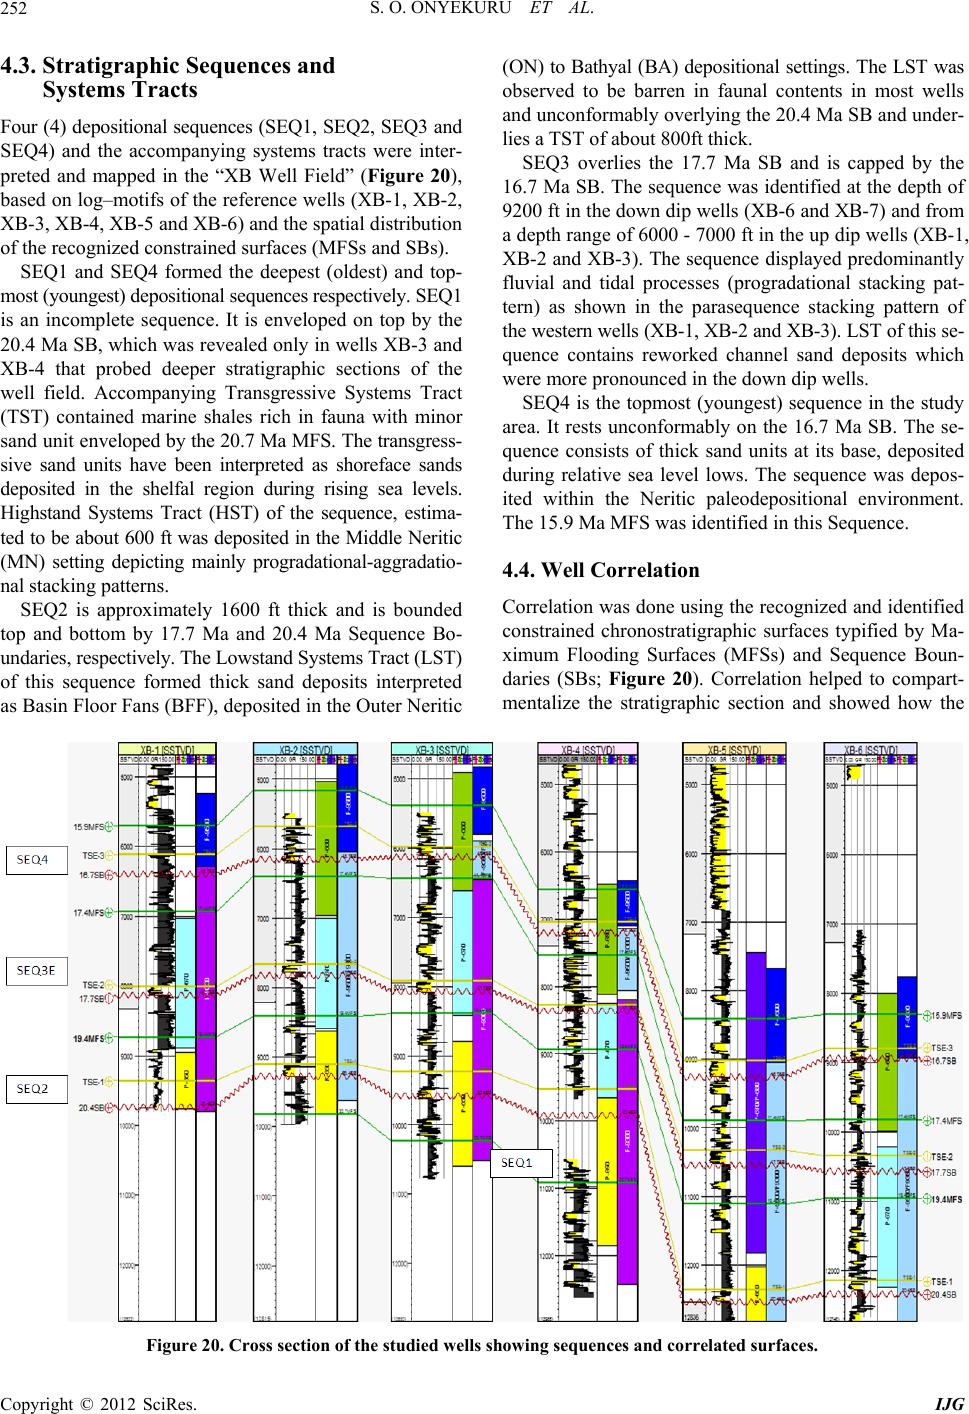 S. O. ONYEKURU ET AL. 252 4.3. Stratigraphic Sequences and Systems Tracts Four (4) depositional sequences (SEQ1, SEQ2, SEQ3 and SEQ4) and the accompanying systems tracts were inter- preted and mapped in the “XB Well Field” (Figure 20), based on log–motif s of the reference w ells (XB-1, XB-2, XB-3, XB-4 , XB-5 an d XB-6 ) and th e sp atial di stribu tio n of the recognized constrained surfaces (MFSs and SBs). SEQ1 and SEQ4 formed the deepest (oldest) and top- most (youngest) depositional seque nces respecti vely . SEQ1 is an incomplete sequence. It is enveloped on top by the 20.4 Ma SB, which was revealed only in wells XB-3 and XB-4 that probed deeper stratigraphic sections of the well field. Accompanying Transgressive Systems Tract (TST) contained marine shales rich in fauna with minor san d uni t e nveloped by the 20.7 Ma MFS. The transgress- sive sand units have been interpreted as shoreface sands deposited in the shelfal region during rising sea levels. Highstand Systems Tract (HST) of the sequence, estima- ted to be about 600 ft was deposited in the Middle Neritic (MN) setting depicting mainly progradational-aggradatio- nal stacking patterns. SEQ2 is approximately 1600 ft thick and is bounded top and bottom by 17.7 Ma and 20.4 Ma Sequence Bo- undaries, respectively. The Lowstand Systems Tract (LST) of this sequence formed thick sand deposits interpreted as Basin Floor Fans (BFF), deposited in the Outer Neritic (ON) to Bathyal (BA) depositional settings. The LST was observed to be barren in faunal contents in most wells and unconfor mably overlying the 20.4 Ma SB and und er- lies a TST of about 800ft thick. SEQ3 overlies the 17.7 Ma SB and is capped by the 16.7 Ma SB. The sequence was identified at the depth of 9200 ft in the down dip wells (XB-6 and XB-7) and from a depth range of 6000 - 7000 ft in the up dip wells (XB-1, XB-2 and XB-3). The sequence displayed predominantly fluvial and tidal processes (progradational stacking pat- tern) as shown in the parasequence stacking pattern of the western wells (XB-1, XB-2 and XB-3). LST of this se- quence contains reworked channel sand deposits which were more pronounced in the down dip wells. SEQ4 is the topmost (youngest) sequence in the study area. It rests unconformably on the 16.7 Ma SB. The se- quence consists of thick sand units at its base, deposited during relative sea level lows. The sequence was depos- ited within the Neritic paleodepositional environment. The 15.9 Ma MFS was identified in this Sequ ence. 4.4. Well Correlation Correlation was done using the recogn ized and identified constrained chronostratigraphic surfaces typified by Ma- ximum Flooding Surfaces (MFSs) and Sequence Boun- daries (SBs; Figure 20). Correlation helped to compart- mentalize the stratigraphic section and showed how the Figure 20. Cross section of the studied wells showing sequences and correlated surfaces. Copyright © 2012 SciRes. IJG  S. O. ONYEKURU ET AL. 253 surfaces correlated along dip and strike at certain depths within the depositional basin, thus depicting basin ge- ometry and depositional sequences across the well field. The displayed correlation panel (Figure 20) indicates that the stratigraphic column appears to be dipping in a N-S direction and striking in the NW–SE direction. De- position tends to be thicker in wells XB-4, XB-5 and XB- 6, which were located down dip. The occurrence of the identified chronostratigraphic surfaces at different depths along dip and strike lines in the studied wells shows evi- dence of faulting in the well field. 5. Discussion 5.1. Depositional Sequence Architecture Depositional systems in the “XB” Well field comprise Lowstand Systems Tracts (LSTs), Transgressive Systems Tracts (TSTs) and Highstand Systems Tracts (HSTs). The LSTs are represented by coeval facies dominated by deposition basinward of the shelf-edge during maxi- mum regression and are characterized by deep-water de- position from gr avity flows and/or traction processes wi- thin shelf-edge or canyon-head delta. The sediments as- sociated with LSTs recognized in the study area are the Fluvial Channel Sands and Slope Fans (SF). Fluvial Channel Sands are associated with erosion of canyons into slopes and incision of fluvial valleys into the shelf. Siliciclastic sediments sometimes bypassed the shelf and slope through the valleys and canyons to feed the Basin Floor Fans (BFF). These turbidites present ex- cellent reservoir qualities. Channel sands seen in SEQ2 lie unconformably on 20.4 Ma SB i n well s XB -1 (810 0 ft), XB-2 (9200 ft) and XB -4 (9600 f t). Chan nel sands ob ser- ved in SEQ3 overlaid the 17.7Ma SB in wells XB-3 (7700 ft), XB-4 (7500 ft) and XB-6 (10,500 ft). Slope fans are made up of turbidity-levee channels and overbank deposits. They overlie the Basin Flo or Fans (BFF) and are downlapped by the overlying Lowstand wedge. Slope fans identified in wells XB-1, XB-2 and XB-3 oc- curred at depths 7400 ft, 7500 ft and 8144 ft, r espectiv ely (Figure 21). The fans were observed to overlie the 17.7 Ma SB in XB-1 and XB-2 Wells and 16.7Ma SB in XB-3 Well. Figure 21. Distribution of depositional systems in “XB” field. Copyright © 2012 SciRes. IJG  S. O. ONYEKURU ET AL. 254 . The Slope Fan system is commonly characterized by crescent log motif in individual levee channel units, thi- ckening and thinning of individual overbank sands and fining upwards of individual channel sands from a sharp base. Slope fans are formed as the rate of eustatic sea le- vel fall becomes less than the rate of rise associated with subsidence [24]. 5.2. Transgressive Systems Tract (TST) The Transgressive Systems Tract developed in response to sea level rise and when sedimentation rate was not able to keep pace with the rate of sea level rise, thus ma- rine facies retrograde landward to flood the shelf; deltaic progradation ceases and much of the sand is trapped up dip in estuaries. The upper boundary of the TST defines the MFS. Condensed sections, characterized by faunal abundance and diversity peaks are developed near this surface [25]. Transgressive Systems Tracts were charac- terized by transition from upward shallowing to upward deepening and transgressive erosional surfaces (TSE) on the shelf. The TSTs capping the LST Facies in the studied well field were observed to be very thick and contained main- ly marine shales with minor transgressive sands. 5.3. Highstand Systems Tracts (HST) The rate of sea level rise decreased during the develop- ment of Highstand Systems Tracts. HSTs are character- ized by intervals of coarsening and shallowing upwards, with both fluvial and deltaic sands near the top of the unit prograding laterally into Neritic shales. In the studied wells, the in tervals are very thi ck. This ma y be attribu ted to very high rates of subsidence, high sediment input and insta- bility similar to sediment pattern in the Gulf Coast [26]. 5.4. Reservoir Potential of the XB-Well Field Six (6) potential reservoirs (R1, R2, R3, R4, R5 and R6) delineated in the “XB Field” were mainly the channel sands and shoreface sands of LSTs and HSTs, respect- tively, that disp layed low Gamma Ray and high Resistiv- ity values (Figure 22). Figure 22. Low Gamma ray and high resistivity values of potential reservoirs in “XB”-field. Copyright © 2012 SciRes. IJG  S. O. ONYEKURU ET AL. 255 5.5. Reservoir Continuity The lateral continuity of sand bodies determines reser- voir’s area of coverage and helps to calculate accumula- ted hydrocarbon volume. Reservoir R1, was identified within the HST of SEQ1 and traceable to XB-2 and XB-3. It can be mapped by the 20.4Ma SB that caps the sequence. Reservoir R2 is found within the shoreface facies of the HST of SEQ2. This reservoir has a lateral continuity extending from well XB- 2 to XB-3 (Figure 22). Reservoir R3 represents the thick channel sand facies of the LST and is correlated to res- ervoir R6. Both reservoirs are underlain by the 16.7Ma SB. Reservoir R4 occurs within the LST of SEQ2 in XB-5 and XB-6 Wells, while reservoir R5 was identified in the sandy facies interbedded in the predominantly shale facies of the TST. 5.6. Reservoir Geometry It has been noted that known reservoir rocks in the Niger Delta are Eocen e to Pliocene in age. The y are often stacked and range in thickness from less than 15 m to 10% being greater than 45 m thick [2]. The thicker reservoirs likely represent composite bodies of stacked channels [5]. The various reservoirs in the wells (Figure 23), which are stacked channel sands, range between 80 (21 m) to 160 feet (42 m) thick. Figure 23. Stacked channel re servoir sands and thic knesses in XB-2 and 3 wells. Copyright © 2012 SciRes. IJG  S. O. ONYEKURU ET AL. 256 Based on reservoir quality and geometry in the “XB” Field, the most important reservoir types are the point bars of distributary channels and coastal barrier bars in- termittently cut by sand-filled channels [6]. 5.7. Source Rock Potential Several thick shale units of the TST identified in the studied wells were considered potential source rocks for the hydrocarbons found in the reservoirs in the “XB” Field. 5.8. Trapping Mechanisms Most known traps in the Niger Delta basin are structural, although stratigraphic traps are not uncommon. The struc- tural traps develo ped during synsedimentary d eformation of Agbada paralic sequences [2,27]. A variety of struc- tural trapping elements, including those associated with simple rollover structures, clay filled channels, structures with multiple growth faults, structures with antithetic faults, and collapsed crest structures, have been described [5]. On the flanks of the delta, stratigraphic traps are like- ly as important as structural traps [28]. The primary seal rock in the Niger Delta is the interbedded shale within the Agbada Formation. The shale provides three types of seals-clay smears along faults, interbedded sealing units against which reservoir sands are juxtaposed due to fault- ing, and vertical seals [5]. Results of well correlation showed that delineated con- strained surfaces were not laterally continuous. These trun- cations were inferred to be caused by sydepositional faults in the field. These faults constitute the major traps for hydrocarbon accumulation. Also, the shale of TST and shale units within the HST could form top and bottom seals for hydrocarbons in the reservoir sand. The reservoir rocks of the LST and HST and the seals from prodelta shales of the TST can com- bined to constitute stratigraphic trap s for hydrocarbon ac- cumulation in the well field. 6. Summary and Conclusions Six wells whose petrophysical well logs and biostrati- graphic data were made available for a sequence strati- graphic study, provided a rare opportunity to interpret de- positional facies and systems of the “XB” field located within the central Swamp depobelt, Niger Delta basin. Analysis of the vertical succession of depositional fa- cies revealed four third order depositional sequences of mid-Miocene in age, bounded chronologically by 20 Ma SB, 17.7 Ma SB and 16.7 Ma SB (Type 1 Sequence Bo- undaries). The depositional sequences experienced major flood- ing episodes characterized by high faunal population and diversity. SEQ1, which is the oldest sequence, experien- ced a transgressive episode marked by 20.7 MFS (Ala- bamina 2). SEQ2 and SEQ3 experienced other transgres- sion episodes marked by faunal diversity and abundance which formed the 19.4 MFS (Ogara shale) and 17.4 MFS (Unnamed MFS). The youngest sequence, SEQ4 in the well field experienced maximum flooding event defined by 15.9 MFS (Chiloguembelina 3). In each sequence, the lowermost sections were marked by deposits arising from relatively low sea level, forming channels and slope complexes. The middle sections were deposited during a generally high relative sea lev el, while the uppermost sections were deposited during gradual drops in relative sea level lowering (Highstand). These inferred variations in relative sea level defined third order depositional systems that comprised Lowstand Systems Tract (LST) at the base of the section, Transgressive Sys- tems Tract (TST) in the middle of the section and the Highstand Systems Tract (HST) at the top of each section. In terms of hydrocarbon exploration, the sand units of the LST and HST formed the basin floor fans, channel and shoreface sands of the delta. The high resistivity log values revealed that they are potential good hydrocarbon reservoirs. The shales of the TST in which most of the MFS were delineated could form seals to the reservoir units. A combination of the reservoir sands of the LST and HST and the shale units of the TST can form good stratigraphic traps for hydrocarbon and hence should also be targeted during hydrocarbon exploration. REFERENCES [1] H. Posamentier, M. Jervey and P. Vail, “Eustatic Controls on Clastic Deposition in Conceptual Framework,” In: C. Wilgus, B. S. Hastings, C. G. Kendall, H. W. Posamentier, C. A. Ross and J. C. Van Wagoner, Eds., Sea level Changes: An Integrated Approach, Vol. 42, SEPM Spe- cial Publication, 1988, pp. 109-124. [2] B. D. Evamy, J. Haremboure, P. Kamerling, W. A. Knaap, F. A. Molloy and P. H. Rowlands, “Hydrocarbon Habitat of Tertiary Niger Delta,” American Association of Petro- leum Geologists Bulletin, Vol. 62, No. 1, 1978, pp. 1-39. [3] K. C. Short and A. J. Stauble, “Outline of Geology of Niger Delta,” American Association of Petroleum Geolo- gists Bulletin, Vol. 51, No. 5, 1967, pp. 761-779. [4] A. J. Whiteman, “Nigeria, Its Petroleum, Geology, Re- sources and Potential,” Graham and Trotman, London, 1982. [5] H. Doust and E. Omatsola, “Niger Delta,” In: J. D. Ed- wards and P. A. Santogrossi, Eds., Divergent/Passive Margin Basins, American Association of Petroleum Ge- ologists Memoir, Vol. 48, 1990, pp. 201-238. [6] H. Kulke, “Nigeria,” In: H. Kulke, Ed., Regional Petro- leum Geology of the World, Part II: Africa, America, Australia and Antarctica, Gebrüder Borntraeger, Berlin, 1995, pp. 143-172. [7] J. Hospers, “Gravity Field and Structure of the Niger Copyright © 2012 SciRes. IJG  S. O. ONYEKURU ET AL. 257 Delta, Nigeria, West Africa,” Geological Society of Ame- rican Bulletin, Vol. 76, No. 4, 1965, pp. 407-422. doi:10.1130/0016-7606(1965)76[407:GFASOT]2.0.CO;2 [8] A. Kaplan, C. U. Lusser and I. O. Norton, “Tect onic Map of the World, Panel 10, Tulsa,” American Association of Petroleum Geologists, Scale 1:10000000, 1994. [9] M. L. W. Tuttle, R. R. Charpentier and M. E. Brownfield, “The Niger Delta Petroleum System: Niger Delta Prov- ince, Nigeria, Cameroon, and Equatorial Guinea, Africa,” USGS Open-File Report 99-50-H, 1999. [10] C. G. Kendall and L. Pomar, “Systems Tract, Bounding Surfaces, Lithofacies, Geometric Hierarchies and Stack- ing Patterns: Keys to Shallow Water Carbonate Interpre- tation,” American Association of Petroleum Geologistst Bulletin, Vol. 89, 2005. [11] S. H. Williams, “Graptolites, Acritarchs and Scolecodonts at Green Point, Western Newfoundland,” International Cambrian-Ordovician Boundary Working Group, Circu- lar, 1997, pp. 6-15. [12] P. R. Vail, R. M. Mitchum and S. Thompson, “Seismic Stratigraphy and Global Changes of Sea Level, Part 3: Relative Changes of Sea Level from Coastal Onlap,” In: C. E. Payton, Ed., Seismic Stratigraphy-Applications to Hydrocarbon Exploration, AAPG Memoir, Vol. 26, 1977, pp. 63-81. [13] J. C. Van Wagoner, H. W. Posamentier, R. M. Mitchum, P. R. Vail, J. F. Sarg, T. S. Loutit and J. Hardenbol, “An Overview of the Fundamentals of Sequence Stratigraphy and Key Definitions,” In: C. Wilgus, B. S. Hastings, C. G. Kendall, H. W. Posamentier, C. A. Ross and J. C. Van Wagoner, Eds., Sea Level Changes: An Integrated Ap- proach, Vol. 42, SEPM Special Publication, 1988, pp. 39- 46. [14] B. U. Haq, J. Hardenbol and P. R. Vail, “Mesozoic and Cenozoic Chronostratigraphy and Cycles of Sea- Level Change,” In: C. Wilgus, B. S. Hastings, C. G. Kendall, H. W. Posamentier, C. A. Ross and J. C. Van Wagoner, Eds., Sea Level Changes: An Integrated Ap- proach, Vol. 42, SEPM Special Publication, 1988, pp. 72-108. [15] O. S. Adegoke, M. E. Omatsola and M. B. Salami, “Ben- thic Foraminifera Biofacies, off the Niger Delta,” Mari- time Sediments Special Publication, Vol. 1, 1976, pp. 279-292. [16] H. M. Bolli and J. B. Saunders, “Oligocene to Holocene Low Latitude Planktic Foraminifera,” In: H. M. Bolli, J. B. Saunders and K. Perch-Nielsen, Eds., Plankton Strati- graphy, Cambridge University Press, Cambridge, 1985, pp. 155-257. [17] K. Perch-Nielsen, “Cenozoic Calcareous Nannofossils,” In: H. Bolli, J. Saunders and K. Perch-Nielsen, Eds., Pl ankton Stratigraphy, Cambridge University Press, Cam- bridge, 1985, pp. 427-545. [18] F. T. Beka and M. N. Oti, “The Distal Offshore Niger Delta: Frontier Prospects of a Mature Petroleum Prov- ince,” In: M. N. Oti and G. Postma, Eds., Geology of Del- tas, A. A. Balkema, Rotterdam, 1995, pp. 237-241. [19] A. M. McCABE, G. F. Dardis and P. M. Hanvey, “Gla- cial Sedimentology in Northern and Western Ireland, In: Pre- and Post-Symposium Field Excursion Guide Book, Anglia Polytechnic, Cambridge, 1992. [20] G. P. Allen and H. W. Posamentier, “Sequence Stratigra- phy and Facies Model of an Incised Valley Fill: The Gi- ronde Estuary, France,” Journal of Sedimentary Petrology, Vol. 63, No. 3, 1993, pp. 378-391. [21] D. Emery and K. Myers, “Sequence Stratigraphy,” Black- well Science Ltd., Oxford, 1996. [22] S. Boggs, “Principles of Sedimentology and Stratigra- phy,” 2nd Edition, Prentice Hall, Englewood Cliffs, 1995. [23] R. G. Walker and A. G. Plint, “Wave- and Storm-Domi- nated Shallow Marine Systems,” In: R. G. Walker and N. P. James, Eds., Facies Models-Response to Sea-Level Ch- anges, Geological Association of Canada, Newfoundland, 1992, pp. 219-238. [24] H. Posamentier and P. R. Vail, “Eustatic Controls on Clastic Deposition II—Sequence and Systems Tract Mod- els,” In: C. Wilgus, B. S. Hastings, C. G. Kendall, H. W. Posamentier, C. A. Ross and J. C. Van Wagoner, Eds., Sea Level Changes: An Integrated Approach, Vol. 42, SEPM Special Publication, 1988, pp. 125-154. [25] M. Shaffer, “Minimum Viable Populations: Coping with Uncertainty,” In: M. E. Soule, Ed., Viable Populations for Conservation, Cambridge University Press, Cambridge, 1987, pp. 69-86. doi:10.1017/CBO9780511623400.006 [26] C. D. Winker, “Cenozoic Shelf Margins, Northwestern Gulf of Mexico,” Gulf Coast Association of Geological Societies, Vol. 32, 1982, pp. 427-448. [27] P. Stacher, “Present Understanding of the Niger Delta Hydrocarbon Habitat,” In: M. N. Oti and G. Postma, Eds., Geology of Deltas, A. A. Balkema, Rotterdam, 1995, pp. 257-267. [28] W. Galloway, “Genetic Stratigraphic Sequences in Basin Analysis I: Architecture and Genesis of Flooding Surface Bounded Depositional Units,” American Association of Petroleum Geologists Bulletin, Vol. 73, No. 2, 1989, pp. 125-142. Copyright © 2012 SciRes. IJG |