

Paper Menu >>
Journal Menu >>
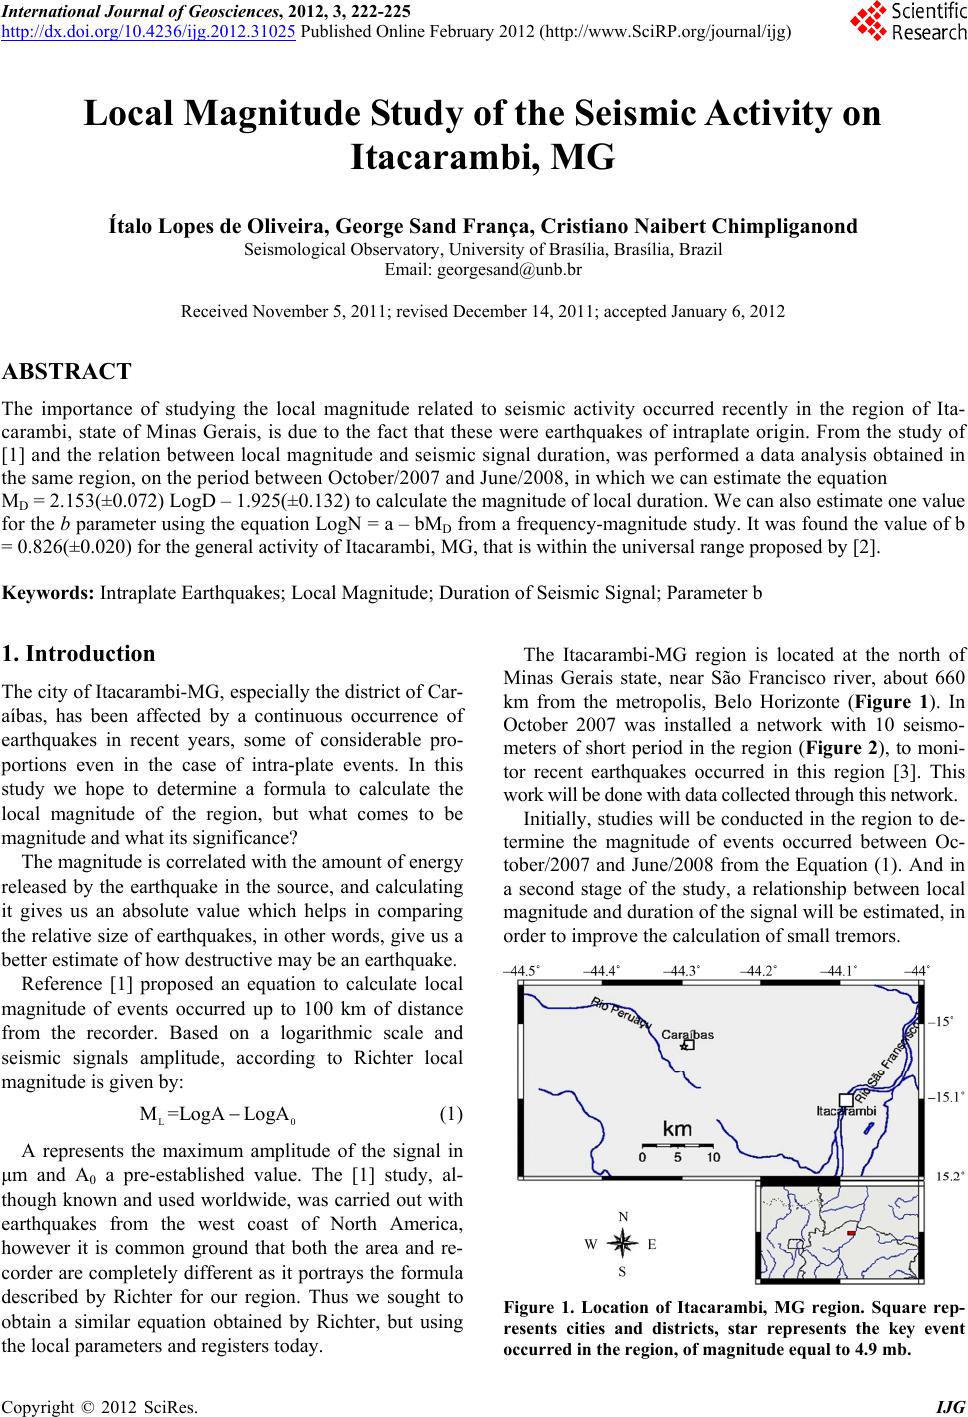 International Journal of Geosciences, 2012, 3, 222-225 http://dx.doi.org/10.4236/ijg.2012.31025 Published Online February 2012 (http://www.SciRP.org/journal/ijg) Local Magnitude Study of the Seismic Activity on Itacarambi, MG Ítalo Lopes de Oliveira, George Sand França, Cristiano Naibert Chimpliganond Seismological Observatory, University of Brasília, Brasília, Brazil Email: [email protected] Received November 5, 2011; revised December 14, 2011; accepted January 6, 2012 ABSTRACT The importance of studying the local magnitude related to seismic activity occurred recently in the region of Ita- carambi, state of Minas Gerais, is due to the fact that these were earthquakes of intraplate origin. From the study of [1] and the relation between local magnitude and seismic signal duration, was performed a data analysis obtained in the same region, on the period between October/2007 and June/2008, in which we can estimate the equation MD = 2.153(±0.072) LogD – 1.925(±0.132) to calculate the magnitude of local duration. We can also estimate one value for the b parameter using the equation LogN = a – bMD from a frequency-magnitude study. It was found the value of b = 0.826(±0.020) for the general activity of Itacarambi, MG, that is within the universal range proposed by [2]. Keywords: Intraplate Earthquakes; Local Magnitude; Duration of Seismic Signal; Parameter b 1. Introduction The city of Itacarambi-MG, especially the district of Car- aíbas, has been affected by a continuous occurrence of earthquakes in recent years, some of considerable pro- portions even in the case of intra-plate events. In this study we hope to determine a formula to calculate the local magnitude of the region, but what comes to be magnitude and what its significance? The magnitude is correlated with the amount of energy released by the earthquake in the source, and calculating it gives us an absolute value which helps in comparing the relative size of earthquakes, in other words, give us a better estimate of how destructive may be an earthquake. Reference [1] proposed an equation to calculate local magnitude of events occurred up to 100 km of distance from the recorder. Based on a logarithmic scale and seismic signals amplitude, according to Richter local magnitude is given by: L0 ogA LogAM =L (1) A represents the maximum amplitude of the signal in μm and A0 a pre-established value. The [1] study, al- though known and used worldwide, was carried out with earthquakes from the west coast of North America, however it is common ground that both the area and re- corder are completely different as it portrays the formula described by Richter for our region. Thus we sought to obtain a similar equation obtained by Richter, but using the local parameters and registers today. The Itacarambi-MG region is located at the north of Minas Gerais state, near São Francisco river, about 660 km from the metropolis, Belo Horizonte (Figure 1). In October 2007 was installed a network with 10 seismo- meters of short period in the region (Figure 2), to moni- tor recent earthquakes occurred in this region [3]. This work will be done with data collected through this network. Initially, studies will be conducted in the region to de- termine the magnitude of events occurred between Oc- tober/2007 and June/2008 from the Equation (1). And in a second stage of the study, a relationship between local magnitude and duration of the signal will be estimated, in order to improve the calculation of small tremors. Figure 1. Location of Itacarambi, MG region. Square rep- resents cities and districts, star represents the key event occurred in the region, of magnitude equal to 4.9 mb. C opyright © 2012 SciRes. IJG 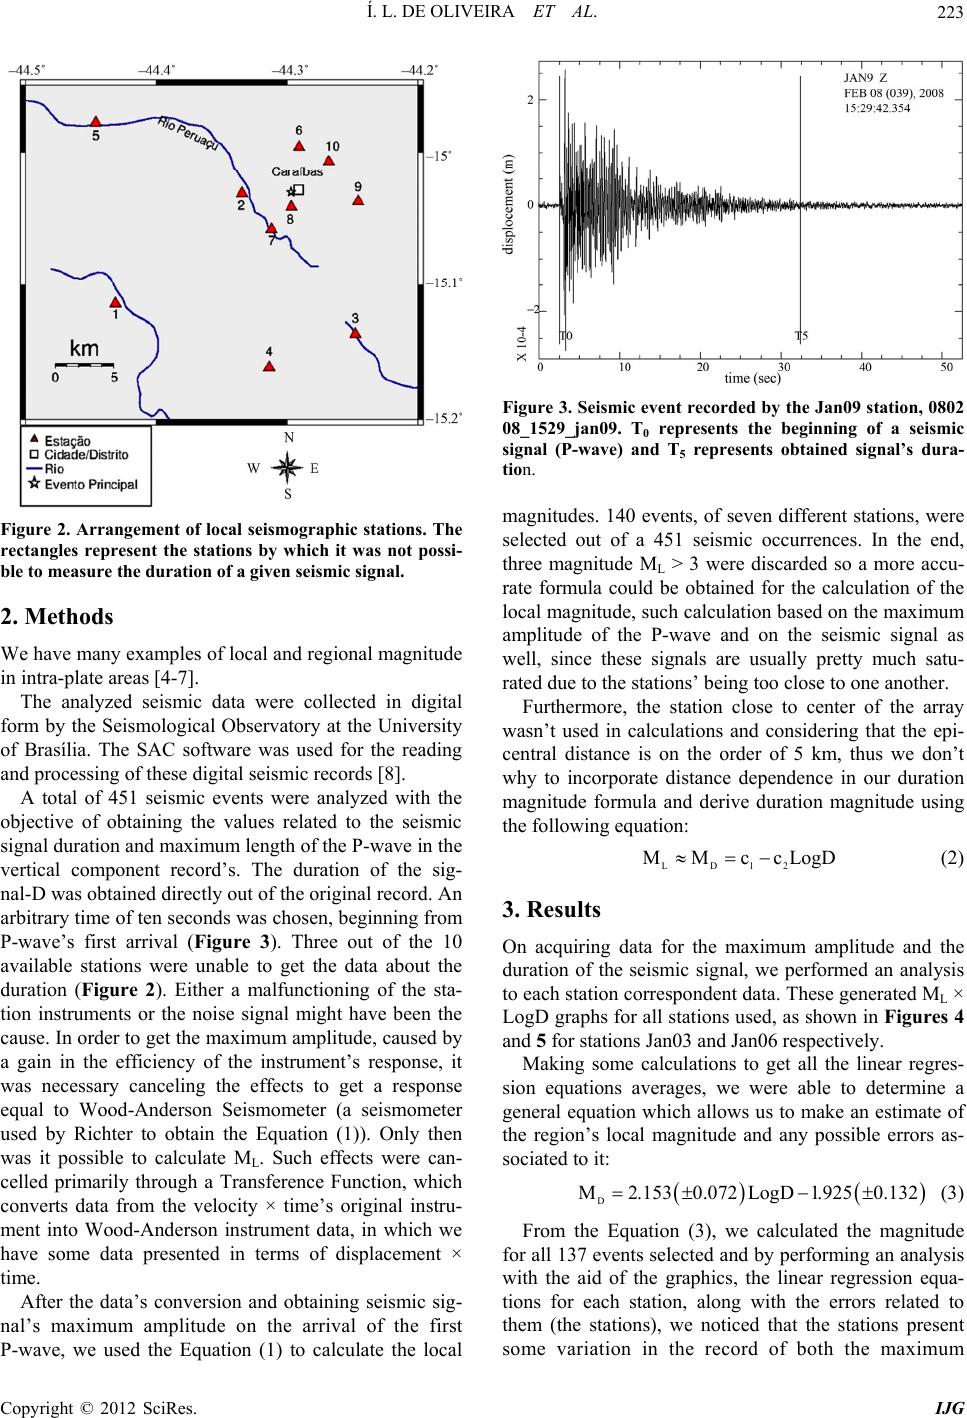 Í. L. DE OLIVEIRA ET AL. 223 Figure 2. Arrangement of local seismographic stations. The rectangles represent the stations by which it was not possi- ble to measure the duration of a given seismic signal. 2. Methods We have many examples of local and regional magnitude in intra-plate areas [4-7]. The analyzed seismic data were collected in digital form by the Seismological Observatory at the University of Brasília. The SAC software was used for the reading and processing of these digital seismic records [8]. A total of 451 seismic events were analyzed with the objective of obtaining the values related to the seismic signal duration and maximum length of the P-wave in the vertical component record’s. The duration of the sig- nal-D was obtained directly out of the original record. An arbitrary time of ten seconds was chosen, beginning from P-wave’s first arrival (Figure 3). Three out of the 10 available stations were unable to get the data about the duration (Figure 2). Either a malfunctioning of the sta- tion instruments or the noise signal might have been the cause. In order to get the maximum amplitude, caused by a gain in the efficiency of the instrument’s response, it was necessary canceling the effects to get a response equal to Wood-Anderson Seismometer (a seismometer used by Richter to obtain the Equation (1)). Only then was it possible to calculate ML. Such effects were can- celled primarily through a Transference Function, which converts data from the velocity × time’s original instru- ment into Wood-Anderson instrument data, in which we have some data presented in terms of displacement × time. After the data’s conversion and obtaining seismic sig- nal’s maximum amplitude on the arrival of the first P-wave, we used the Equation (1) to calculate the local Figure 3. Seismic event recorded by the Jan09 station, 0802 08_1529_jan09. T0 represents the beginning of a seismic signal (P-wave) and T5 represents obtained signal’s dura- tion. magnitudes. 140 events, of seven different stations, were selected out of a 451 seismic occurrences. In the end, three magnitude ML > 3 were discarded so a more accu- rate formula could be obtained for the calculation of the local magnitude, such calculation based on the maximum amplitude of the P-wave and on the seismic signal as well, since these signals are usually pretty much satu- rated due to the stations’ being too close to one another. Furthermore, the station close to center of the array wasn’t used in calculations and considering that the epi- central distance is on the order of 5 km, thus we don’t why to incorporate distance dependence in our duration magnitude formula and derive duration magnitude using the following equation: LD12 MMccLogD (2) 3. Results On acquiring data for the maximum amplitude and the duration of the seismic signal, we performed an analysis to each station correspondent data. These generated ML × LogD graphs for all stations used, as shown in Figures 4 and 5 for stations Jan03 and Jan06 respectively. Making some calculations to get all the linear regres- sion equations averages, we were able to determine a general equation which allows us to make an estimate of the region’s local magnitude and any possible errors as- sociated to it: D M2.1530.072 LogD1.9250.132 (3) From the Equation (3), we calculated the magnitude for all 137 events selected and by performing an analysis with the aid of the graphics, the linear regression equa- tions for each station, along with the errors related to them (the stations), we noticed that the stations present some variation in the record of both the maximum Copyright © 2012 SciRes. IJG 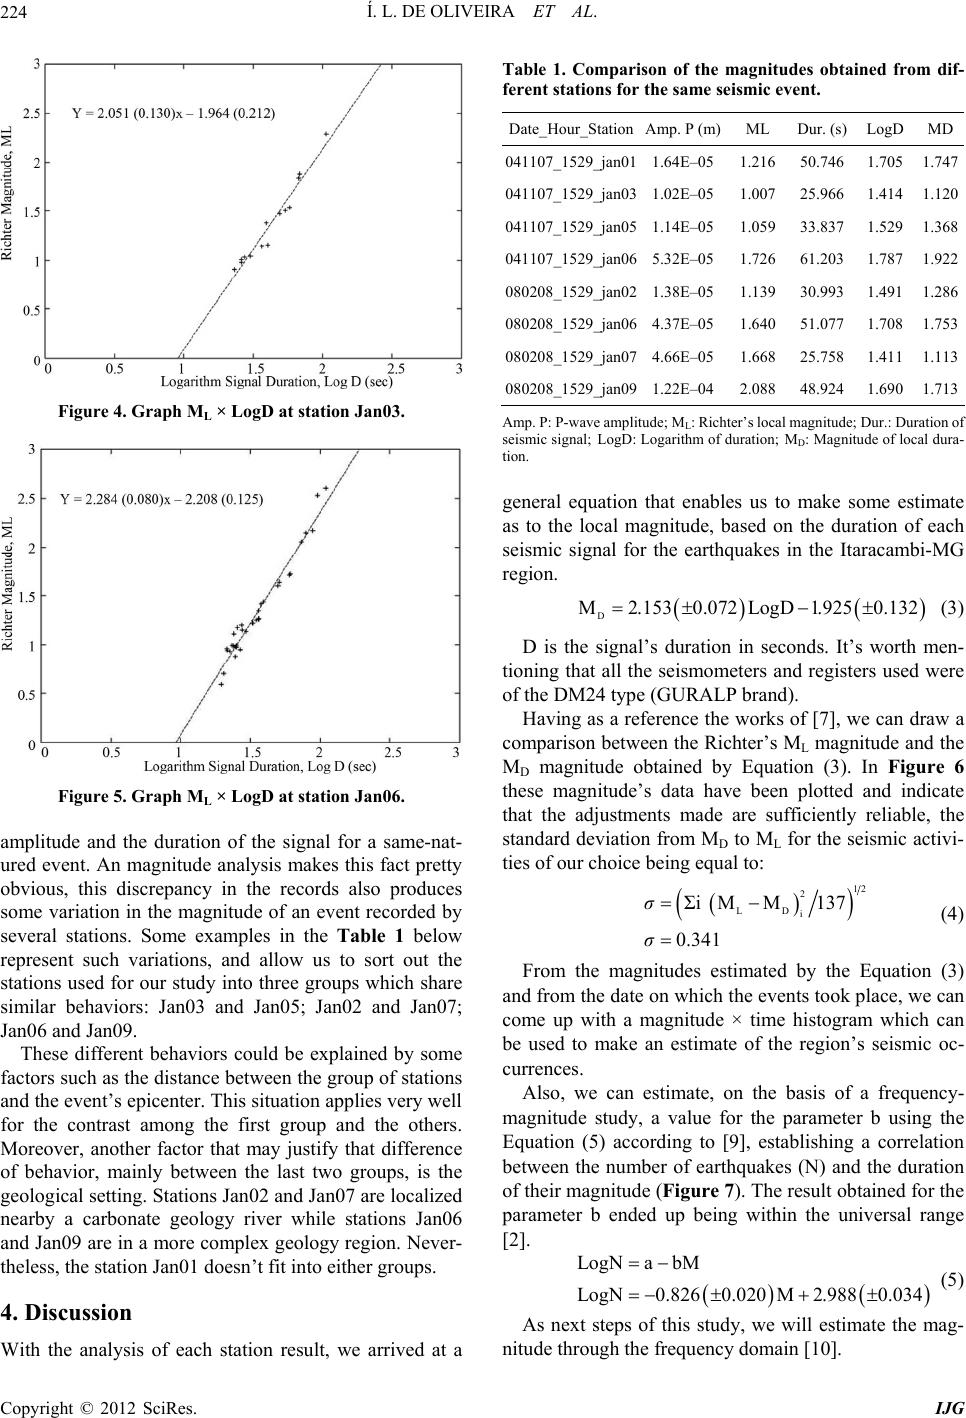 Í. L. DE OLIVEIRA ET AL. 224 Figure 4. Graph ML × LogD at station Jan03. Figure 5. Graph ML × LogD at station Jan06. amplitude and the duration of the signal for a same-nat- ured event. An magnitude analysis makes this fact pretty obvious, this discrepancy in the records also produces some variation in the magnitude of an event recorded by several stations. Some examples in the Table 1 below represent such variations, and allow us to sort out the stations used for our study into three groups which share similar behaviors: Jan03 and Jan05; Jan02 and Jan07; Jan06 and Jan09. These different behaviors could be explained by some factors such as the distance between the group of stations and the event’s epicenter. This situation applies very well for the contrast among the first group and the others. Moreover, another factor that may justify that difference of behavior, mainly between the last two groups, is the geological setting. Stations Jan02 and Jan07 are localized nearby a carbonate geology river while stations Jan06 and Jan09 are in a more complex geology region. Never- theless, the station Jan01 doesn’t fit into either groups. 4. Discussion Table 1. Comparison of the magnitudes obtained from dif- With the analysis of each station result, we arrived at a (s) LogDMD ferent stations for the same seismic event. Date_Hour_StationAmp. P (m)ML Dur. 041107_1529_jan011.64E–051.216 50.746 1.7051.747 041107_1529_jan031.02E–051.007 25.966 1.4141.120 041107_1529_jan051.14E–051.059 33.837 1.5291.368 041107_1529_jan065.32E–051.726 61.203 1.7871.922 080208_1529_jan021.38E–051.139 30.993 1.4911.286 080208_1529_jan064.37E–051.640 51.077 1.7081.753 080208_1529_jan074.66E–051.668 25.758 1.4111.113 080208_1529_jan091.22E–042.088 48.924 1.6901.713 Amp. P: P-wave amplituhte m; Dr eneral equation that enables us to make some estimate de; ML: Ricr’s localagnitudeur.: Duation of seismic signal; LogD: Logarithm of duration; MD: Magnitude of local dura- tion. g as to the local magnitude, based on the duration of each seismic signal for the earthquakes in the Itaracambi-MG region. D M2.1530.072 LogD1.9250.132 (3) D is the signal’s duration in seconds. It’s worth tio [7], we can draw a co men- ning that all the seismometers and registers used were of the DM24 type (GURALP brand). Having as a reference the works of mparison between the Richter’s ML magnitude and the MD magnitude obtained by Equation (3). In Figure 6 these magnitude’s data have been plotted and indicate that the adjustments made are sufficiently reliable, the standard deviation from MD to ML for the seismic activi- ties of our choice being equal to: 12 2 LD i137 0.341σ (4) From the magnitudes estimated by the Equation (3) an can estimate, on the basis of a frequency- m LogNa bM LogN0.8260.020 M2.9880.034 Σi MMσ d from the date on which the events took place, we can come up with a magnitude × time histogram which can be used to make an estimate of the region’s seismic oc- currences. Also, we agnitude study, a value for the parameter b using the Equation (5) according to [9], establishing a correlation between the number of earthquakes (N) and the duration of their magnitude (Figure 7). The result obtained for the parameter b ended up being within the universal range [2]. (5) As next steps of this study, we will estimate the mag- nitude through the frequency domain [10]. Copyright © 2012 SciRes. IJG 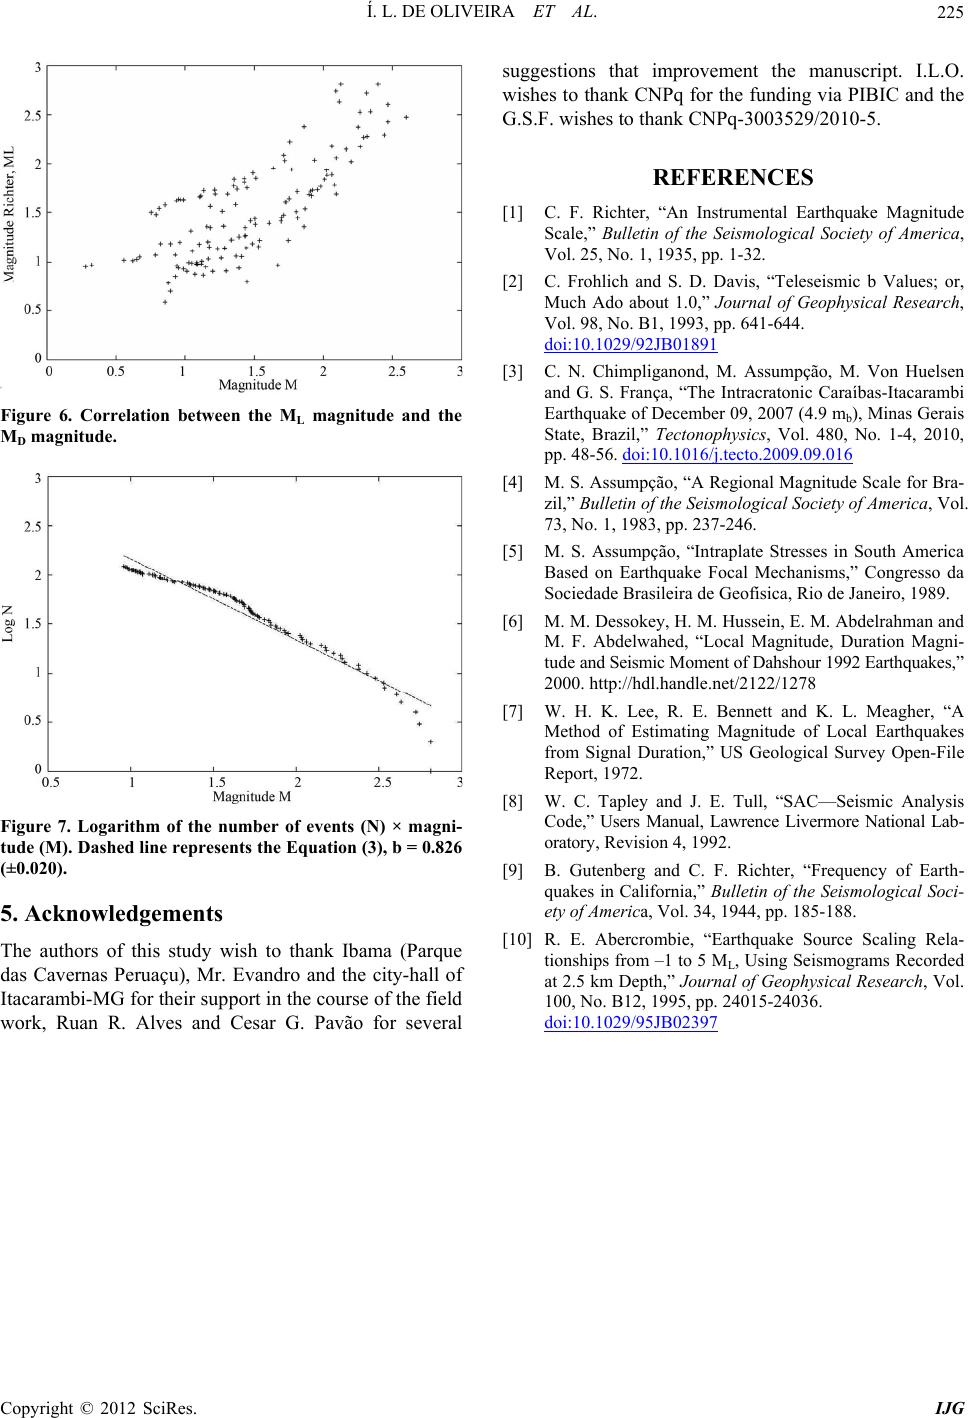 Í. L. DE OLIVEIRA ET AL. Copyright © 2012 SciRes. IJG 225 Figure 6. Correlation between the ML magnitude and the MD magnitude. Figure 7. Logarithm of the number of events (N) × magni- 5. Acknowledgements ish to thank Ibama (Parque and the G.S.F. wishes to thank CNPq-3003529/2010-5. gical Society of America, ophysical Research, . 641-644. tude (M). Dashed line re presents the Equation (3), b = 0.826 (±0.020). The authors of this study w das Cavernas Peruaçu), Mr. Evandro and the city-hall of Itacarambi-MG for their support in the course of the field work, Ruan R. Alves and Cesar G. Pavão for several suggestions that improvement the manuscript. I.L.O. wishes to thank CNPq for the funding via PIBIC REFERENCES [1] C. F. Richter, “An Instrumental Earthquake Magnitude Scale,” Bulletin of the Seismolo Vol. 25, No. 1, 1935, pp. 1-32. [2] C. Frohlich and S. D. Davis, “Teleseismic b Values; or, Much Ado about 1.0,” Journal of Ge Vol. 98, No. B1, 1993, pp doi:10.1029/92JB01891 [3] C. N. Chimpliganond, M. Assumpção, M. Von Huelsen and G. S. França, “The Intracratonic Caraíbas-Itacarambi Earthquake of December 09, 2007 (4.9 mb), Minas Gerais State, Brazil,” Tectonophysics, Vol. 480, No. 1-4, 2010, pp. 48-56. doi:10.1016/j.tecto.2009.09.016 [4] M. S. Assumpção, “A Regional Magnitude Scale for Bra- zil,” Bulletin of the Seismological Society of America, Vol. 1992 Earthquakes,” ration,” US Geological Survey Open-File rence Livermore National Lab- logical Soci- al Research, Vol. 4015-24036. doi:10.1029/95JB02397 73, No. 1, 1983, pp. 237-246. [5] M. S. Assumpção, “Intraplate Stresses in South America Based on Earthquake Focal Mechanisms,” Congresso da Sociedade Brasileira de Geofísica, Rio de Janeiro, 1989. [6] M. M. Dessokey, H. M. Hussein, E. M. Abdelrahman and M. F. Abdelwahed, “Local Magnitude, Duration Magni- tude and Seismic Moment of Dahshour 2000. http://hdl.handle.net/2122/1278 [7] W. H. K. Lee, R. E. Bennett and K. L. Meagher, “A Method of Estimating Magnitude of Local Earthquakes from Signal Du Report, 1972. [8] W. C. Tapley and J. E. Tull, “SAC—Seismic Analysis Code,” Users Manual, Law oratory, Revision 4, 1992. [9] B. Gutenberg and C. F. Richter, “Frequency of Earth- quakes in California,” Bulletin of the Seismo ety of America, Vol. 34, 1944, pp. 185-188. [10] R. E. Abercrombie, “Earthquake Source Scaling Rela- tionships from –1 to 5 ML, Using Seismograms Recorded at 2.5 km Depth,” Journal of Geophysic 100, No. B12, 1995, pp. 2 |