

Paper Menu >>
Journal Menu >>
 Psychology 2012. Vol.3, No.2, 213-216 Published Online February 2012 in SciRes (http://www.SciRP.org/journal/psych) http://dx.doi.org/10.4236/psych.2012.32030 Copyright © 2012 SciRes. 213 Waiting in Vain: Managing Time and Customer Satisfaction at Call Centers Danilo Garcia1,2, Trevor Archer2, Saleh Moradi2, Bibinaz Ghiabi3 1Institute of Neuroscience and Physiology, Psychiatry and Neurochemistry, Forensic Psychiatry, The Sahlgrenska Academy, University of Gothenburg, Gothenburg, Sweden 2Department of Psychology, University of Gothenburg, Gothenburg, Sweden 3Institute for Psychology and Educational Sciences, University of Tehran, Tehran, Iran Email: [email protected] Received December 1st, 2011; revised January 2nd, 2012; accepted January 29th, 2012 The aim was to investigate customers’ satisfaction with telephone waiting time using data collected among 3013 customers who were asked for their waiting time satisfaction, information satisfaction, and service satisfaction. The actual queue time was also measured and played a significant but small role on time satisfaction. In order to keep customers satisfied with waiting time, a successful model is an infor- mative satisfactory answer and top of the line service, even when queue times are large. Nevertheless, the model was less useful to predict non satisfied customers. This specific information needs to be integrated when organizations assess customers’ time satisfaction. Keywords: Call Center; Customer Satisfaction; Information Intelligence; Queue Time; Time Introduction Information intelligent organizations use their rapid in- creasing information assets successfully (Evgeniou & Cart- wright, 2005). Nevertheless, managers and decision makers tend to only look for information that simply confirms exist- ing beliefs and often disregard all other information (for other barriers to information management see Evgeniou & Cartwright, 2005). For instance, the aspect of time as part of customer sat- isfaction is often regarded as important in many service situa- tions (for a review see Durrande-Moreau, 1999). Most research has shown that as waiting time increases, satisfaction de- creases (Davis & Volmann, 1990), that customers tend to over- estimate waiting time (Katz, Larson, & Larson, 1991; Pruyn & Smidts, 1998), and these recalled wait durations have an equal, if not greater, effect on satisfaction than objective waiting time (Katz et al., 1991; Pruyn & Smidts, 1998). At a general level, as perceived or recalled wait duration increases the wait becomes less acceptable (e.g., Antonides, Verhoef, & van Aalst, 2002). Time management is important because of the increase of service activities in our economic society and because of the increasing value of time for customers (Durrande-Moreau, 1999). The notion of rapid service often guides managers when deciding the work strategy of the organization. Work at call centers, for instance, is often designed around technical solu- tions that imply some type of work schedule—every second that an agent is not on the phone amounts to precious queue time that must be managed. Nevertheless, these managerial decisions are based on actual time and not recalled time. Man- agers seem to believe that there is actually a “magic actual time”—crossing over it might lead to customer dissatisfaction. It is plausible to suggest that managers and decision makers might need to know which variables might influence recollect- tions of satisfaction with queue time. Retrospective measures of experience are better predictors, compared to actual experience (e.g., the exact recollection of waiting time and on-line emo- tional experience), of future behavior (Kahneman, 2000). Hence, when considering calling again or buying services from the same company customers base their decisions, at least in part, on their previous experiences. As explained by Kahneman and Kruger (2006: p. 3): “a large literature from behavioral economics and psychology finds that people often make inconsistent choices, fail to learn from ex- perience, exhibit reluctance to trade, base their own satisfaction on how their situation compares with the satisfaction of others and depart from the standard model of the rational economic agent in other ways”. In other words, global and episodic self- reports might not be based on real numbers, such as the actual queue time. For instance, Redelmeier, Katz, and Kahneman (2003) have demonstrated that extreme experiences such as a colonoscopy are more pleasant when it ends less abruptly and less painful, even when such end means a longer procedure. Related to this issue, researchers have also found that people are more willing to wait in line depending on how much they value the service provided by the company (Maister, 1985). In other words, time satisfaction might be influenced by how sat- isfying the whole service experience is apprehended by the customer. The Present Study In this line of thinking, the present article investigates which variables influence customers’ satisfaction with the waiting time. Moreover, in order to point out the need of information intelligence, the data used in the present paper is “real life data” (i.e., data that was collected for organizational purposes). Spe- cifically, the present study operationalized customer satisfac- tion using data collected by a call center in which 3013 cus- tomers where asked (automatic survey) if they were satisfied with the service they received, if they were satisfied with the 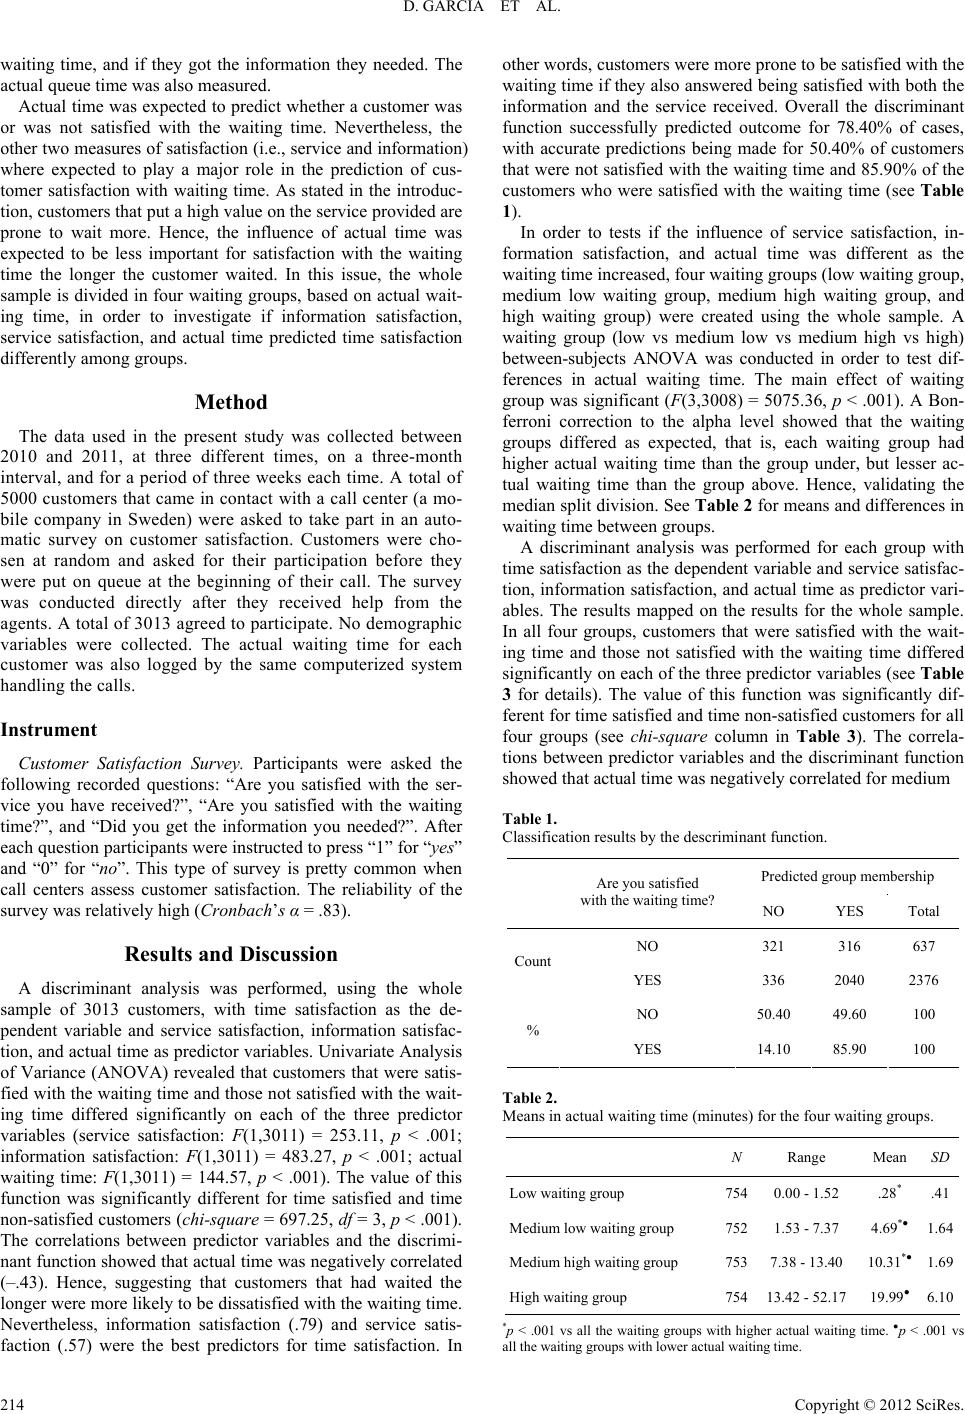 D. GARCIA ET AL. waiting time, and if they got the information they needed. The actual queue time was also measured. Actual time was expected to predict whether a customer was or was not satisfied with the waiting time. Nevertheless, the other two measures of satisfaction (i.e., service and information) where expected to play a major role in the prediction of cus- tomer satisfaction with waiting time. As stated in the introduc- tion, customers that put a high value on the service provided are prone to wait more. Hence, the influence of actual time was expected to be less important for satisfaction with the waiting time the longer the customer waited. In this issue, the whole sample is divided in four waiting groups, based on actual wait- ing time, in order to investigate if information satisfaction, service satisfaction, and actual time predicted time satisfaction differently among groups. Method The data used in the present study was collected between 2010 and 2011, at three different times, on a three-month interval, and for a period of three weeks each time. A total of 5000 customers that came in contact with a call center (a mo- bile company in Sweden) were asked to take part in an auto- matic survey on customer satisfaction. Customers were cho- sen at random and asked for their participation before they were put on queue at the beginning of their call. The survey was conducted directly after they received help from the agents. A total of 3013 agreed to participate. No demographic variables were collected. The actual waiting time for each customer was also logged by the same computerized system handling the calls. Instrument Customer Satisfaction Survey. Participants were asked the following recorded questions: “Are you satisfied with the ser- vice you have received?”, “Are you satisfied with the waiting time?”, and “Did you get the information you needed?”. After each question participants were instructed to press “1” for “yes” and “0” for “no”. This type of survey is pretty common when call centers assess customer satisfaction. The reliability of the survey was relatively high (Cronbach’s α = .83). Results and Discussion A discriminant analysis was performed, using the whole sample of 3013 customers, with time satisfaction as the de- pendent variable and service satisfaction, information satisfac- tion, and actual time as predictor variables. Univariate Analysis of Variance (ANOVA) revealed that customers that were satis- fied with the waiting time and those not satisfied with the wait- ing time differed significantly on each of the three predictor variables (service satisfaction: F(1,3011) = 253.11, p < .001; information satisfaction: F(1,3011) = 483.27, p < .001; actual waiting time: F(1,3011) = 144.57, p < .001). The value of this function was significantly different for time satisfied and time non-satisfied customers (chi-square = 697.25, df = 3, p < .001). The correlations between predictor variables and the discrimi- nant function showed that actual time was negatively correlated (–.43). Hence, suggesting that customers that had waited the longer were more likely to be dissatisfied with the waiting time. Nevertheless, information satisfaction (.79) and service satis- faction (.57) were the best predictors for time satisfaction. In other words, customers were more prone to be satisfied with the waiting time if they also answered being satisfied with both the information and the service received. Overall the discriminant function successfully predicted outcome for 78.40% of cases, with accurate predictions being made for 50.40% of customers that were not satisfied with the waiting time and 85.90% of the customers who were satisfied with the waiting time (see Table 1). In order to tests if the influence of service satisfaction, in- formation satisfaction, and actual time was different as the waiting time increased, four waiting groups (low waiting group, medium low waiting group, medium high waiting group, and high waiting group) were created using the whole sample. A waiting group (low vs medium low vs medium high vs high) between-subjects ANOVA was conducted in order to test dif- ferences in actual waiting time. The main effect of waiting group was significant (F(3,3008) = 5075.36, p < .001). A Bon- ferroni correction to the alpha level showed that the waiting groups differed as expected, that is, each waiting group had higher actual waiting time than the group under, but lesser ac- tual waiting time than the group above. Hence, validating the median split division. See Table 2 for means and differences in waiting time between groups. A discriminant analysis was performed for each group with time satisfaction as the dependent variable and service satisfac- tion, information satisfaction, and actual time as predictor vari- ables. The results mapped on the results for the whole sample. In all four groups, customers that were satisfied with the wait- ing time and those not satisfied with the waiting time differed significantly on each of the three predictor variables (see Table 3 for details). The value of this function was significantly dif- ferent for time satisfied and time non-satisfied customers for all four groups (see chi-square column in Table 3). The correla- tions between predictor variables and the discriminant function showed that actual time was negatively correlated for medium Table 1. Classification results by the descriminant function. Predicted group membership Are you satisfied with the waiting time? NO YES Total NO 321 316 637 Count YES 336 2040 2376 NO 50.40 49.60 100 % YES 14.10 85.90 100 Table 2. Means in actual waiting time (minutes) for the four waiting groups. N Range MeanSD Low waiting group 754 0.00 - 1.52 .28* .41 Medium low waiting group 752 1.53 - 7.37 4.69*●1.64 Medium high waiting group 753 7.38 - 13.40 10.31*●1.69 High waiting group 754 13.42 - 52.17 19.99●6.10 *p < .001 vs all the waiting groups with higher actual waiting time. ●p < .001 vs ll the waiting groups with lower actual waiting time. a Copyright © 2012 SciRes. 214 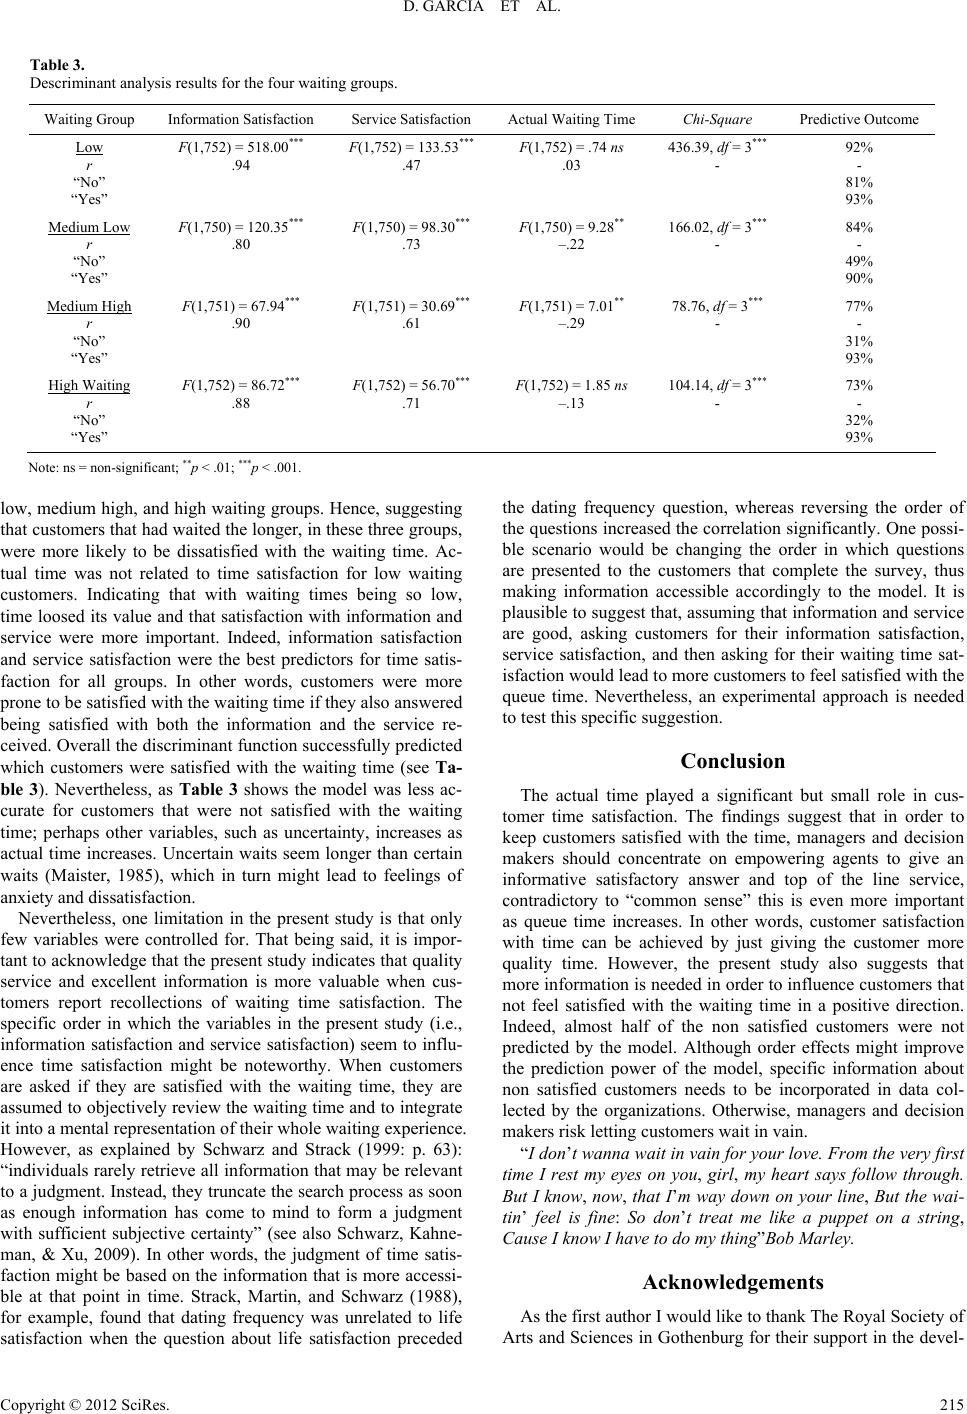 D. GARCIA ET AL. Copyright © 2012 SciRes. 215 Table 3. Descriminant analysis results for the four waiting groups. Waiting Group Information Satisfaction Service Satisfaction Actual Waiting Time Chi-Square Predictive Outcome Low r “No” “Yes” F(1,752) = 518.00*** .94 F(1,752) = 133.53*** .47 F(1,752) = .74 ns .03 436.39, df = 3*** - 92% - 81% 93% Medium Low r “No” “Yes” F(1,750) = 120.35*** .80 F(1,750) = 98.30*** .73 F(1,750) = 9.28** –.22 166.02, df = 3*** - 84% - 49% 90% Medium High r “No” “Yes” F(1,751) = 67.94*** .90 F(1,751) = 30.69*** .61 F(1,751) = 7.01** –.29 78.76, df = 3*** - 77% - 31% 93% High Waiting r “No” “Yes” F(1,752) = 86.72*** .88 F(1,752) = 56.70*** .71 F(1,752) = 1.85 ns –.13 104.14, df = 3*** - 73% - 32% 93% Note: ns = non-significant; **p < .01; ***p < .001. low, medium high, and high waiting groups. Hence, suggesting that customers that had waited the longer, in these three groups, were more likely to be dissatisfied with the waiting time. Ac- tual time was not related to time satisfaction for low waiting customers. Indicating that with waiting times being so low, time loosed its value and that satisfaction with information and service were more important. Indeed, information satisfaction and service satisfaction were the best predictors for time satis- faction for all groups. In other words, customers were more prone to be satisfied with the waiting time if they also answered being satisfied with both the information and the service re- ceived. Overall the discriminant function successfully predicted which customers were satisfied with the waiting time (see Ta- ble 3). Nevertheless, as Table 3 shows the model was less ac- curate for customers that were not satisfied with the waiting time; perhaps other variables, such as uncertainty, increases as actual time increases. Uncertain waits seem longer than certain waits (Maister, 1985), which in turn might lead to feelings of anxiety and dissatisfaction. Nevertheless, one limitation in the present study is that only few variables were controlled for. That being said, it is impor- tant to acknowledge that the present study indicates that quality service and excellent information is more valuable when cus- tomers report recollections of waiting time satisfaction. The specific order in which the variables in the present study (i.e., information satisfaction and service satisfaction) seem to influ- ence time satisfaction might be noteworthy. When customers are asked if they are satisfied with the waiting time, they are assumed to objectively review the waiting time and to integrate it into a mental representation of their whole waiting experience. However, as explained by Schwarz and Strack (1999: p. 63): “individuals rarely retrieve all information that may be relevant to a judgment. Instead, they truncate the search process as soon as enough information has come to mind to form a judgment with sufficient subjective certainty” (see also Schwarz, Kahne- man, & Xu, 2009). In other words, the judgment of time satis- faction might be based on the information that is more accessi- ble at that point in time. Strack, Martin, and Schwarz (1988), for example, found that dating frequency was unrelated to life satisfaction when the question about life satisfaction preceded the dating frequency question, whereas reversing the order of the questions increased the correlation significantly. One possi- ble scenario would be changing the order in which questions are presented to the customers that complete the survey, thus making information accessible accordingly to the model. It is plausible to suggest that, assuming that information and service are good, asking customers for their information satisfaction, service satisfaction, and then asking for their waiting time sat- isfaction would lead to more customers to feel satisfied with the queue time. Nevertheless, an experimental approach is needed to test this specific suggestion. Conclusion The actual time played a significant but small role in cus- tomer time satisfaction. The findings suggest that in order to keep customers satisfied with the time, managers and decision makers should concentrate on empowering agents to give an informative satisfactory answer and top of the line service, contradictory to “common sense” this is even more important as queue time increases. In other words, customer satisfaction with time can be achieved by just giving the customer more quality time. However, the present study also suggests that more information is needed in order to influence customers that not feel satisfied with the waiting time in a positive direction. Indeed, almost half of the non satisfied customers were not predicted by the model. Although order effects might improve the prediction power of the model, specific information about non satisfied customers needs to be incorporated in data col- lected by the organizations. Otherwise, managers and decision makers risk letting customers wait in vain. “I don’t wanna wait in vain for your love. From the very first time I rest my eyes on you, girl, my heart says follow through. But I know, now, that I’m way down on your line, But the wai- tin’ feel is fine: So don’t treat me like a puppet on a string, Cause I know I have to do my thing”Bob Marley. Acknowledgements As the first author I would like to thank The Royal Society of Arts and Sciences in Gothenburg for their support in the devel-  D. GARCIA ET AL. opment of this article. I would also like to thank Anders Biel and Anver Siddiqui at the department of psychology for their support. The authors direct their gratitude to the managers at the call center for their openness and to the reviewers who helped improve the article. REFERENCES Antonides, G., Verhoef, P. C., & van Aalst, M. (2002). Consumer per- ception and evaluation of waiting time: A field experiment. Journal of Consumer Psychology, 12, 193-202. doi:10.1207/S15327663JCP1203_02 Davis, M. M., & Volmann, T. E. (1990). A framework for relating waiting time and customer satisfaction in a service operation. Jour- nal of Services Marketing, 4, 61-69. doi:10.1108/EUM0000000002506 Durrande-Moreau, A. (1999). Waiting for service: Ten years of em- pirical research. International Journal of Service, 10, 171-189. Evgeniou, T., & Cartwright, P. (2005). Barriers to information man- agement. European Management Journal, 23, 293-299. doi:10.1016/j.emj.2005.04.007 Kahneman, D. (2000). New challenges to the rationality assumption. In D. Kahneman, & A. Tversky (Eds.), Choices, values, and frames (pp. 758-774). New York: Russell Sage Foundation. Kahneman, D., & Krueger, A. B. (2006). Developments in the meas- urement of subjective well-being. Journal of Economic Perspectives, 20, 3-24. doi:10.1257/089533006776526030 Katz, K. L., Larson, B., & Larson, R. C. (1991). Prescription for the waiting in line blues: Entertain, enlighten and engage. Sloan Man- agement Review, 32, 44-53. Maister, D. (1985). The psychology of waiting lines. In J. A. Czepiel, M. Solomon, & C. S. Surprenant (Eds.), The Service encounter. Lexington: Lexington Books. Pruyn, A., & Smidts, A. (1998). Effects of waiting on satisfaction with the service: Beyond objective time measurements. International Journal of Research in Marketing, 15, 321-334. doi:10.1016/S0167-8116(98)00008-1 Redelmeier, D. A., Katz, J., & Kahneman, D. (2003). Memories of colonoscopy: A randomized trial. Pain, 104, 187-194. doi:10.1016/S0304-3959(03)00003-4 Schwarz, N., Kahneman, D., & Xu, J. (2009). Global and episodic reports of hedonic experience. In R. Belli, D. Alwin, & F. Stafford (Eds.), Using calendar and diary methods in life events research (pp. 157-174). Newbury Park, CA: Sage Publications. Schwarz, N., & Strack, F. (1999). Reports of subjective well-being: Judgmental process and their methodological implications. In D. Kahneman, E. Diener, & N. Schwarz (Eds.), Well-being: The foun- dations of hedonic psychology (pp. 61-84). New York: Russell Sage Found. Strack, F., Martin, L. L., & Schwarz, N. (1988). Priming and commu- nication: Social determinants of information use in judgments of life satisfaction. European Journal of Social Psychology, 18, 429-442. doi:10.1002/ejsp.2420180505 Copyright © 2012 SciRes. 216 |