

Paper Menu >>
Journal Menu >>
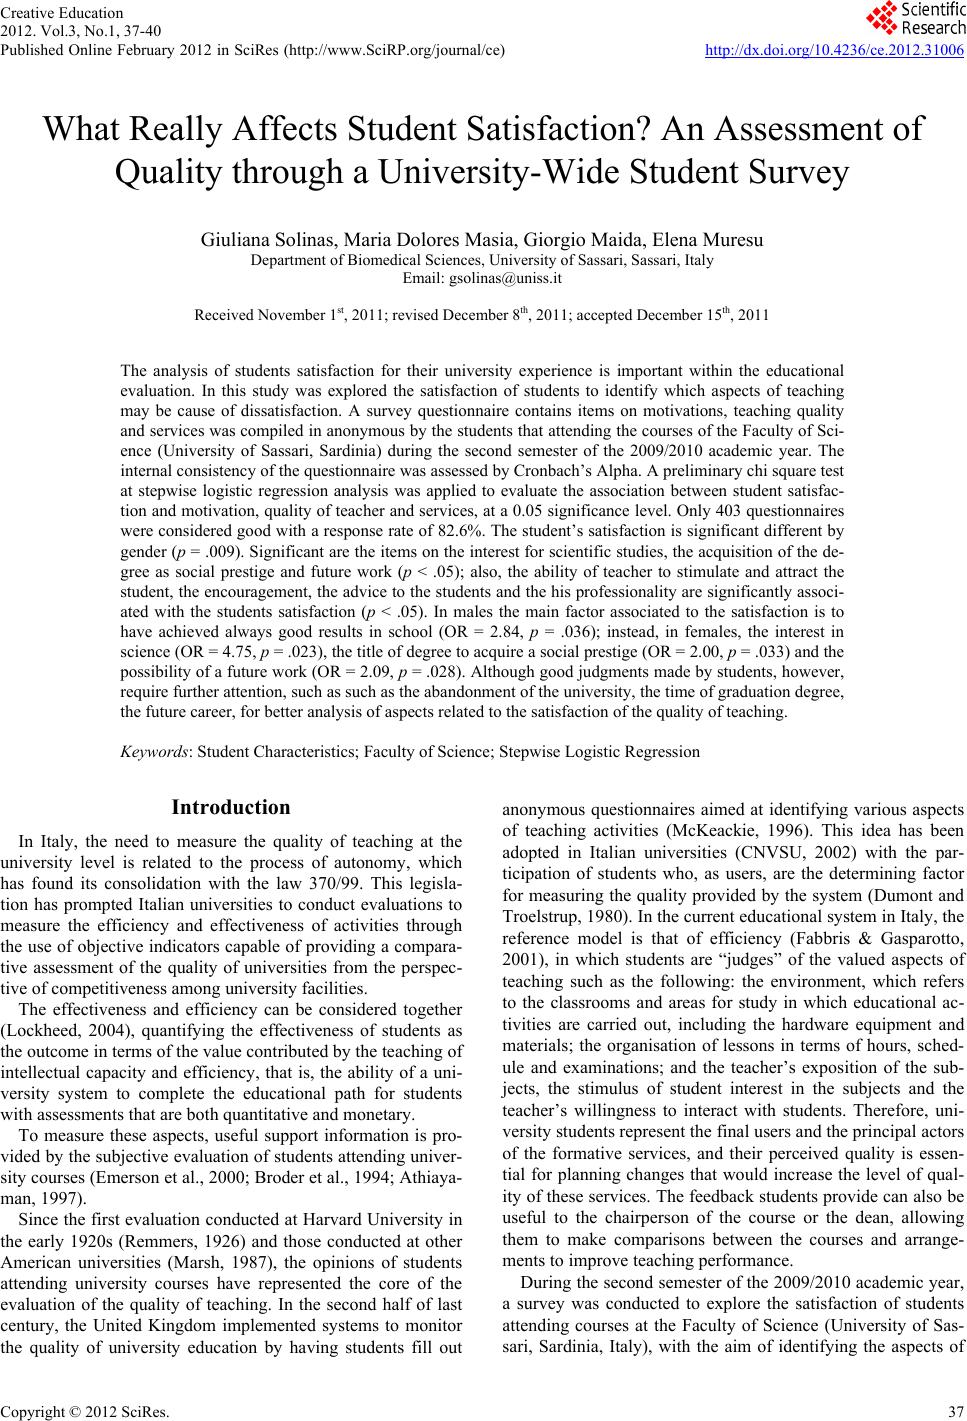 Creative Education 2012. Vol.3, No.1, 37-40 Published Online February 2012 in SciRes (http://www.SciRP.org/journal/ce) http://dx.doi.org/10.4236/ce.2012.31006 Copyright © 2012 SciRes. 37 What Really Affects Student Satisfaction? An Assessment of Quality through a University-Wide Student Survey Giuliana Solinas, Maria Dolores Masia, Giorgio Maida, Elena Muresu Department of Biomedical Sciences, University of Sassari, Sassari, Italy Email: [email protected] Received November 1st, 2011; revised December 8th, 2011; accepted December 15th, 2011 The analysis of students satisfaction for their university experience is important within the educational evaluation. In this study was explored the satisfaction of students to identify which aspects of teaching may be cause of dissatisfaction. A survey questionnaire contains items on motivations, teaching quality and services was compiled in anonymous by the students that attending the courses of the Faculty of Sci- ence (University of Sassari, Sardinia) during the second semester of the 2009/2010 academic year. The internal consistency of the questionnaire was assessed by Cronbach’s Alpha. A preliminary chi square test at stepwise logistic regression analysis was applied to evaluate the association between student satisfac- tion and motivation, quality of teacher and services, at a 0.05 significance level. Only 403 questionnaires were considered good with a response rate of 82.6%. The student’s satisfaction is significant different by gender (p = .009). Significant are the items on the interest for scientific studies, the acquisition of the de- gree as social prestige and future work (p < .05); also, the ability of teacher to stimulate and attract the student, the encouragement, the advice to the students and the his professionality are significantly associ- ated with the students satisfaction (p < .05). In males the main factor associated to the satisfaction is to have achieved always good results in school (OR = 2.84, p = .036); instead, in females, the interest in science (OR = 4.75, p = .023), the title of degree to acquire a social prestige (OR = 2.00, p = .033) and the possibility of a future work (OR = 2.09, p = .028). Although good judgments made by students, however, require further attention, such as such as the abandonment of the university, the time of graduation degree, the future career, for better analysis of aspects related to the satisfaction of the quality of teaching. Keywords: Student Characteristics; Faculty of Science; Stepwise Logistic Regression Introduction In Italy, the need to measure the quality of teaching at the university level is related to the process of autonomy, which has found its consolidation with the law 370/99. This legisla- tion has prompted Italian universities to conduct evaluations to measure the efficiency and effectiveness of activities through the use of objective indicators capable of providing a compara- tive assessment of the quality of universities from the perspec- tive of competitiveness among university facilities. The effectiveness and efficiency can be considered together (Lockheed, 2004), quantifying the effectiveness of students as the outcome in terms of the value contributed by the teaching of intellectual capacity and efficiency, that is, the ability of a uni- versity system to complete the educational path for students with assessments that are both quantitative and monetary. To measure these aspects, useful support information is pro- vided by the subjective evaluation of students attending univer- sity courses (Emerson et al., 2000; Broder et al., 1994; Athiaya- man, 1997). Since the first evaluation conducted at Harvard University in the early 1920s (Remmers, 1926) and those conducted at other American universities (Marsh, 1987), the opinions of students attending university courses have represented the core of the evaluation of the quality of teaching. In the second half of last century, the United Kingdom implemented systems to monitor the quality of university education by having students fill out anonymous questionnaires aimed at identifying various aspects of teaching activities (McKeackie, 1996). This idea has been adopted in Italian universities (CNVSU, 2002) with the par- ticipation of students who, as users, are the determining factor for measuring the quality provided by the system (Dumont and Troelstrup, 1980). In the current educational system in Italy, the reference model is that of efficiency (Fabbris & Gasparotto, 2001), in which students are “judges” of the valued aspects of teaching such as the following: the environment, which refers to the classrooms and areas for study in which educational ac- tivities are carried out, including the hardware equipment and materials; the organisation of lessons in terms of hours, sched- ule and examinations; and the teacher’s exposition of the sub- jects, the stimulus of student interest in the subjects and the teacher’s willingness to interact with students. Therefore, uni- versity students represent the final users and the principal actors of the formative services, and their perceived quality is essen- tial for planning changes that would increase the level of qual- ity of these services. The feedback students provide can also be useful to the chairperson of the course or the dean, allowing them to make comparisons between the courses and arrange- ments to improve teaching performance. During the second semester of the 2009/2010 academic year, a survey was conducted to explore the satisfaction of students attending courses at the Faculty of Science (University of Sas- sari, Sardinia, Italy), with the aim of identifying the aspects of 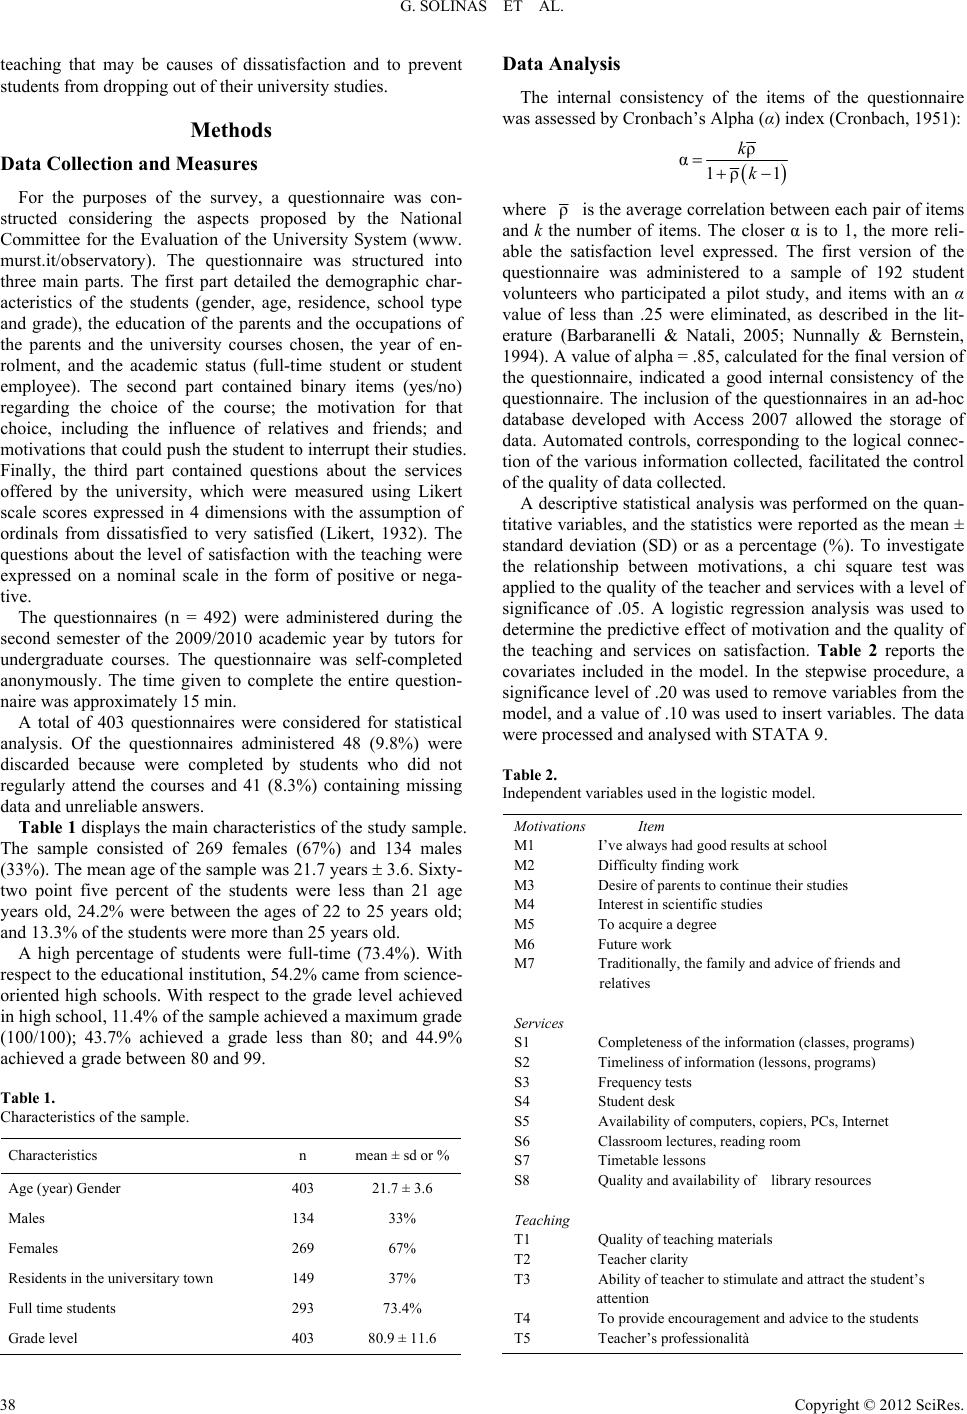 G. SOLINAS ET AL. teaching that may be causes of dissatisfaction and to prevent students from dropping out of their university studies. Methods Data Collection and Measures For the purposes of the survey, a questionnaire was con- structed considering the aspects proposed by the National Committee for the Evaluation of the University System (www. murst.it/observatory). The questionnaire was structured into three main parts. The first part detailed the demographic char- acteristics of the students (gender, age, residence, school type and grade), the education of the parents and the occupations of the parents and the university courses chosen, the year of en- rolment, and the academic status (full-time student or student employee). The second part contained binary items (yes/no) regarding the choice of the course; the motivation for that choice, including the influence of relatives and friends; and motivations that could push the student to interrupt their studies. Finally, the third part contained questions about the services offered by the university, which were measured using Likert scale scores expressed in 4 dimensions with the assumption of ordinals from dissatisfied to very satisfied (Likert, 1932). The questions about the level of satisfaction with the teaching were expressed on a nominal scale in the form of positive or nega- tive. The questionnaires (n = 492) were administered during the second semester of the 2009/2010 academic year by tutors for undergraduate courses. The questionnaire was self-completed anonymously. The time given to complete the entire question- naire was approximately 15 min. A total of 403 questionnaires were considered for statistical analysis. Of the questionnaires administered 48 (9.8%) were discarded because were completed by students who did not regularly attend the courses and 41 (8.3%) containing missing data and unreliable answers. Table 1 displays the main characteristics of the study sample. The sample consisted of 269 females (67%) and 134 males (33%). The mean age of the sample was 21.7 years 3.6. Sixty- two point five percent of the students were less than 21 age years old, 24.2% were between the ages of 22 to 25 years old; and 13.3% of the students were more than 25 years old. A high percentage of students were full-time (73.4%). With respect to the educational institution, 54.2% came from science- oriented high schools. With respect to the grade level achieved in high school, 11.4% of the sample achieved a maximum grade (100/100); 43.7% achieved a grade less than 80; and 44.9% achieved a grade between 80 and 99. Table 1. Characteristics of the sample. Characteristics n mean ± sd or % Age (year) Gender 403 21.7 ± 3.6 Males 134 33% Females 269 67% Residents in the universitary town 149 37% Full time students 293 73.4% Grade level 403 80.9 ± 11.6 Data Analysis The internal consistency of the items of the questionnaire was assessed by Cronbach’s Alpha (α) index (Cronbach, 1951): ρ α1ρ1 k k where ρ is the average correlation between each pair of items and k the number of items. The closer α is to 1, the more reli- able the satisfaction level expressed. The first version of the questionnaire was administered to a sample of 192 student volunteers who participated a pilot study, and items with an α value of less than .25 were eliminated, as described in the lit- erature (Barbaranelli & Natali, 2005; Nunnally & Bernstein, 1994). A value of alpha = .85, calculated for the final version of the questionnaire, indicated a good internal consistency of the questionnaire. The inclusion of the questionnaires in an ad-hoc database developed with Access 2007 allowed the storage of data. Automated controls, corresponding to the logical connec- tion of the various information collected, facilitated the control of the quality of data collected. A descriptive statistical analysis was performed on the quan- titative variables, and the statistics were reported as the mean ± standard deviation (SD) or as a percentage (%). To investigate the relationship between motivations, a chi square test was applied to the quality of the teacher and services with a level of significance of .05. A logistic regression analysis was used to determine the predictive effect of motivation and the quality of the teaching and services on satisfaction. Table 2 reports the covariates included in the model. In the stepwise procedure, a significance level of .20 was used to remove variables from the model, and a value of .10 was used to insert variables. The data were processed and analysed with STATA 9. Table 2. Independent variables used in the logistic model. Motivations Item M1 I’ve always had good results at school M2 Difficulty finding work M3 Desire of parents to continue their studies M4 Interest in scientific studies M5 To acquire a degree M6 Future work M7 Traditionally, the family and advice of friends and relatives Services S1 Completeness of the information (classes, programs) S2 Timeliness of information (lessons, programs) S3 Frequency tests S4 Student desk S5 Availability of computers, copiers, PCs, Internet S6 Classroom lectures, reading room S7 Timetable lessons S8 Quality and availability of library resources Teaching T1 Quality of teaching materials T2 Teacher clarity T3 Ability of teacher to stimulate and attract the student’s attention T4 To provide encouragement and advice to the students T5 Teacher’s professionalità Copyright © 2012 SciRes. 38 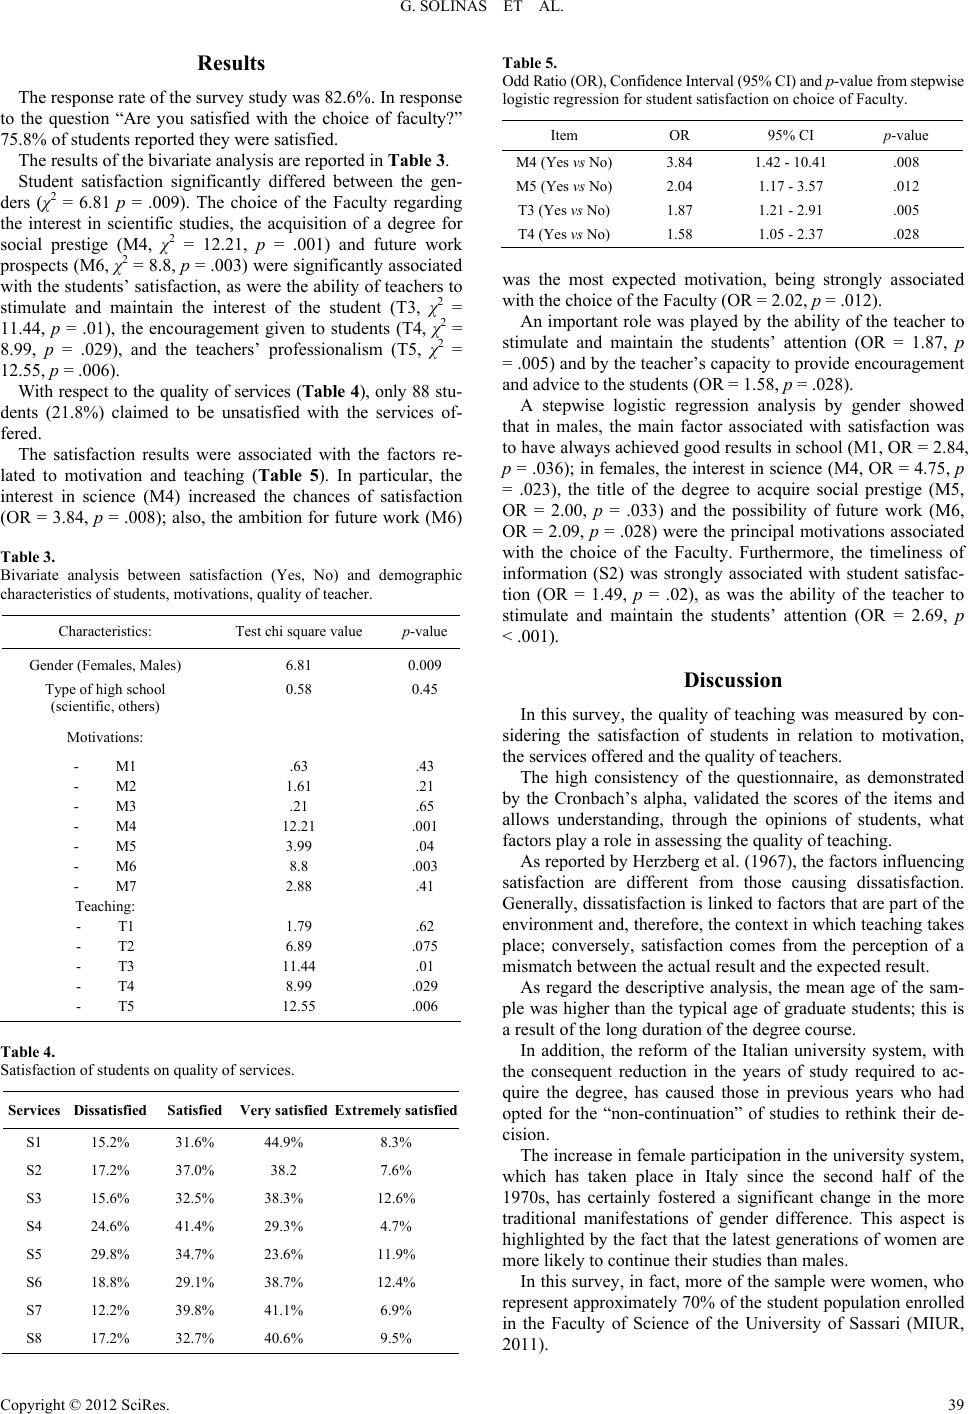 G. SOLINAS ET AL. Results The response rate of the survey study was 82.6%. In response to the question “Are you satisfied with the choice of faculty?” 75.8% of students reported they were satisfied. The results of the bivariate analysis are reported in Table 3. Student satisfaction significantly differed between the gen- ders (χ2 = 6.81 p = .009). The choice of the Faculty regarding the interest in scientific studies, the acquisition of a degree for social prestige (M4, χ2 = 12.21, p = .001) and future work prospects (M6, χ2 = 8.8, p = .003) were significantly associated with the students’ satisfaction, as were the ability of teachers to stimulate and maintain the interest of the student (T3, χ2 = 11.44, p = .01), the encouragement given to students (T4, χ2 = 8.99, p = .029), and the teachers’ professionalism (T5, χ2 = 12.55, p = .006). With respect to the quality of services (Table 4), only 88 stu- dents (21.8%) claimed to be unsatisfied with the services of- fered. The satisfaction results were associated with the factors re- lated to motivation and teaching (Table 5). In particular, the interest in science (M4) increased the chances of satisfaction (OR = 3.84, p = .008); also, the ambition for future work (M6) Table 3. Bivariate analysis between satisfaction (Yes, No) and demographic characteristics of students, motivations, quality of teacher. Characteristics: Test chi square value p-value Gender (Females, Males) Type of high school (scientific, others) 6.81 0.58 0.009 0.45 Motivations: - M1 - M2 - M3 - M4 - M5 - M6 - M7 Teaching: - T1 - T2 - T3 - T4 - T5 .63 1.61 .21 12.21 3.99 8.8 2.88 1.79 6.89 11.44 8.99 12.55 .43 .21 .65 .001 .04 .003 .41 .62 .075 .01 .029 .006 Table 4. Satisfaction of students on quality of services. Services Dissatisfied Satisfied Very satisfied Extremely satisfied S1 15.2% 31.6% 44.9% 8.3% S2 17.2% 37.0% 38.2 7.6% S3 15.6% 32.5% 38.3% 12.6% S4 24.6% 41.4% 29.3% 4.7% S5 29.8% 34.7% 23.6% 11.9% S6 18.8% 29.1% 38.7% 12.4% S7 12.2% 39.8% 41.1% 6.9% S8 17.2% 32.7% 40.6% 9.5% Table 5. Odd Ratio (OR), Confidence Interval (95% CI) and p-value from stepwise logistic regression for student satisfaction on choice of Faculty. Item OR 95% CI p-value M4 (Yes vs No)3.84 1.42 - 10.41 .008 M5 (Yes vs No)2.04 1.17 - 3.57 .012 T3 (Yes vs No) 1.87 1.21 - 2.91 .005 T4 (Yes vs No) 1.58 1.05 - 2.37 .028 was the most expected motivation, being strongly associated with the choice of the Faculty (OR = 2.02, p = .012). An important role was played by the ability of the teacher to stimulate and maintain the students’ attention (OR = 1.87, p = .005) and by the teacher’s capacity to provide encouragement and advice to the students (OR = 1.58, p = .028). A stepwise logistic regression analysis by gender showed that in males, the main factor associated with satisfaction was to have always achieved good results in school (M1, OR = 2.84, p = .036); in females, the interest in science (M4, OR = 4.75, p = .023), the title of the degree to acquire social prestige (M5, OR = 2.00, p = .033) and the possibility of future work (M6, OR = 2.09, p = .028) were the principal motivations associated with the choice of the Faculty. Furthermore, the timeliness of information (S2) was strongly associated with student satisfac- tion (OR = 1.49, p = .02), as was the ability of the teacher to stimulate and maintain the students’ attention (OR = 2.69, p < .001). Discussion In this survey, the quality of teaching was measured by con- sidering the satisfaction of students in relation to motivation, the services offered and the quality of teachers. The high consistency of the questionnaire, as demonstrated by the Cronbach’s alpha, validated the scores of the items and allows understanding, through the opinions of students, what factors play a role in assessing the quality of teaching. As reported by Herzberg et al. (1967), the factors influencing satisfaction are different from those causing dissatisfaction. Generally, dissatisfaction is linked to factors that are part of the environment and, therefore, the context in which teaching takes place; conversely, satisfaction comes from the perception of a mismatch between the actual result and the expected result. As regard the descriptive analysis, the mean age of the sam- ple was higher than the typical age of graduate students; this is a result of the long duration of the degree course. In addition, the reform of the Italian university system, with the consequent reduction in the years of study required to ac- quire the degree, has caused those in previous years who had opted for the “non-continuation” of studies to rethink their de- cision. The increase in female participation in the university system, which has taken place in Italy since the second half of the 1970s, has certainly fostered a significant change in the more traditional manifestations of gender difference. This aspect is highlighted by the fact that the latest generations of women are more likely to continue their studies than males. In this survey, in fact, more of the sample were women, who represent approximately 70% of the student population enrolled in the Faculty of Science of the University of Sassari (MIUR, 2011). Copyright © 2012 SciRes. 39 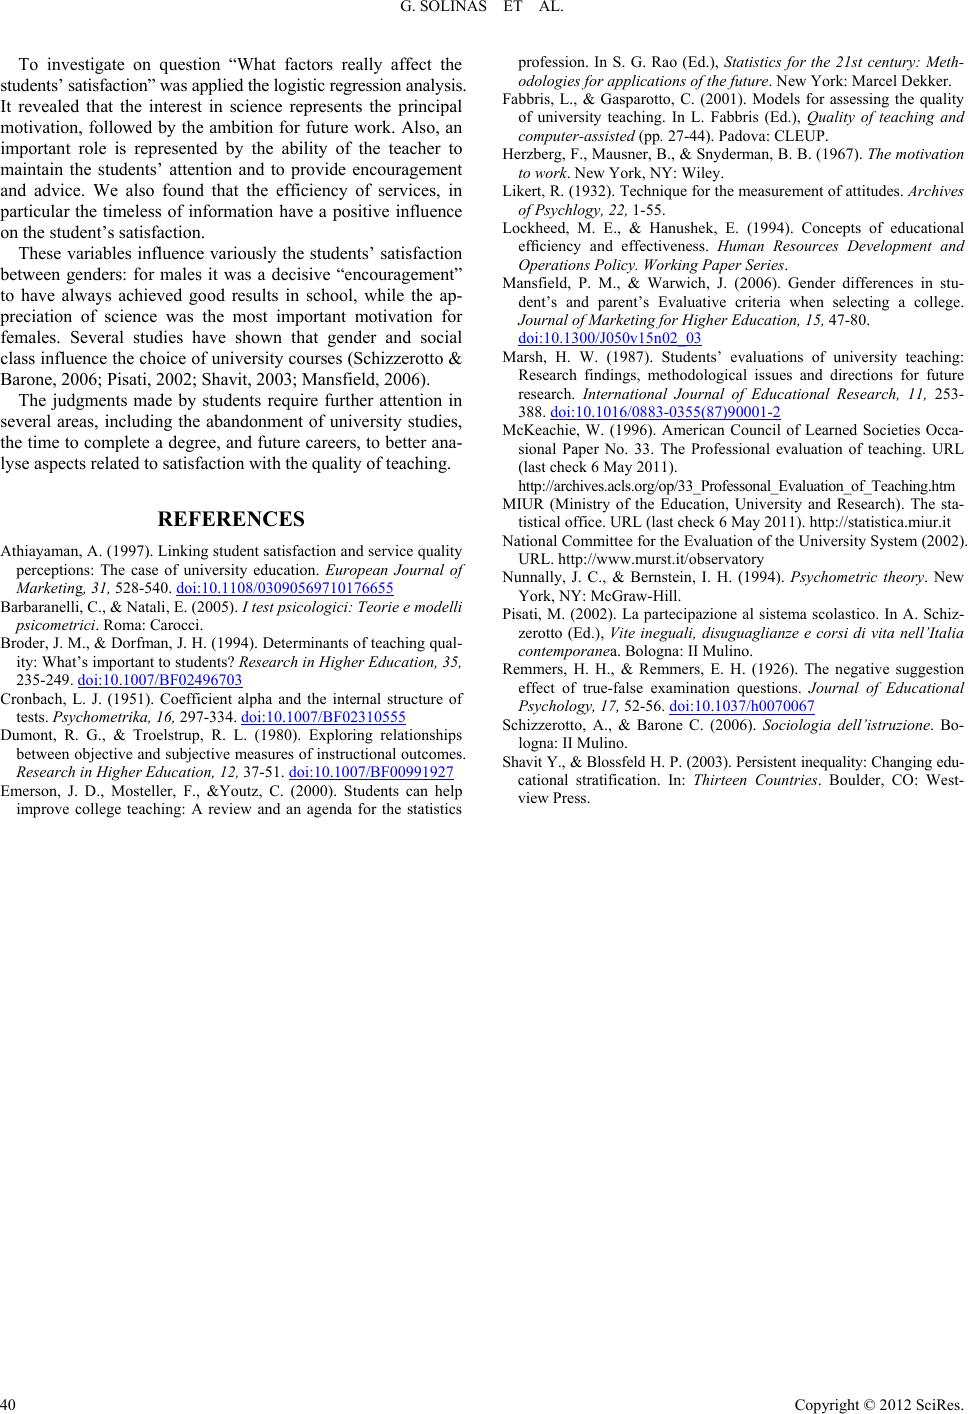 G. SOLINAS ET AL. Copyright © 2012 SciRes. 40 To investigate on question “What factors really affect the students’ satisfaction” was applied the logistic regression analysis. It revealed that the interest in science represents the principal motivation, followed by the ambition for future work. Also, an important role is represented by the ability of the teacher to maintain the students’ attention and to provide encouragement and advice. We also found that the efficiency of services, in particular the timeless of information have a positive influence on the student’s satisfaction. These variables influence variously the students’ satisfaction between genders: for males it was a decisive “encouragement” to have always achieved good results in school, while the ap- preciation of science was the most important motivation for females. Several studies have shown that gender and social class influence the choice of university courses (Schizzerotto & Barone, 2006; Pisati, 2002; Shavit, 2003; Mansfield, 2006). The judgments made by students require further attention in several areas, including the abandonment of university studies, the time to complete a degree, and future careers, to better ana- lyse aspects related to satisfaction with the quality of teaching. REFERENCES Athiayaman, A. (1997). Linking student satisfaction and service quality perceptions: The case of university education. European Journal of Marketing, 31, 528-540. doi:10.1108/03090569710176655 Barbaranelli, C., & Natali, E. (2005). I test psicologici: Teorie e modelli psicometrici. Roma: Carocci. Broder, J. M., & Dorfman, J. H. (1994). Determinants of teaching qual- ity: What’s important to students? Research in Higher Education, 35, 235-249. doi:10.1007/BF02496703 Cronbach, L. J. (1951). Coefficient alpha and the internal structure of tests. Psychometrika, 16, 297-334. doi:10.1007/BF02310555 Dumont, R. G., & Troelstrup, R. L. (1980). Exploring relationships between objective and subjective measures of instructional outcomes. Research in Higher Education, 12, 37-51. doi:10.1007/BF00991927 Emerson, J. D., Mosteller, F., &Youtz, C. (2000). Students can help improve college teaching: A review and an agenda for the statistics profession. In S. G. Rao (Ed.), Statistics for the 21st century: Meth- odologies for applications of the future. New York: Marcel Dekker. Fabbris, L., & Gasparotto, C. (2001). Models for assessing the quality of university teaching. In L. Fabbris (Ed.), Quality of teaching and computer-assisted (pp. 27-44). Padova: CLEUP. Herzberg, F., Mausner, B., & Snyderman, B. B. (1967). The motivation to work. New York, NY: Wiley. Likert, R. (1932). Technique for the measurement of attitudes. Archives of Psychlogy, 22, 1-55. Lockheed, M. E., & Hanushek, E. (1994). Concepts of educational efficiency and effectiveness. Human Resources Development and Operations Policy. Working Paper Series. Mansfield, P. M., & Warwich, J. (2006). Gender differences in stu- dent’s and parent’s Evaluative criteria when selecting a college. Journal of Marketing for Higher Education, 15, 47-80. doi:10.1300/J050v15n02_03 Marsh, H. W. (1987). Students’ evaluations of university teaching: Research findings, methodological issues and directions for future research. International Journal of Educational Research, 11, 253- 388. doi:10.1016/0883-0355(87)90001-2 McKeachie, W. (1996). American Council of Learned Societies Occa- sional Paper No. 33. The Professional evaluation of teaching. URL (last check 6 May 2011). http://archives.acls.org/op/33_Professonal_Evaluation_of_Teaching.htm MIUR (Ministry of the Education, University and Research). The sta- tistical office. URL (last check 6 May 2011). http://statistica.miur.it National Committee for the Evaluation of the University System (2002). URL. http://www.murst.it/observatory Nunnally, J. C., & Bernstein, I. H. (1994). Psychometric theory. New York, NY: McGraw-Hill. Pisati, M. (2002). La partecipazione al sistema scolastico. In A. Schiz- zerotto (Ed.), Vite ineguali, disuguaglianze e corsi di vita nell’Italia contemporanea. Bologna: II Mulino. Remmers, H. H., & Remmers, E. H. (1926). The negative suggestion effect of true-false examination questions. Journal of Educational Psychology, 17, 52-56. doi:10.1037/h0070067 Schizzerotto, A., & Barone C. (2006). Sociologia dell’istruzione. Bo- logna: II Mulino. Shavit Y., & Blossfeld H. P. (2003). Persistent inequality: Changing edu- cational stratification. In: Thirteen Countries. Boulder, CO: West- view Press. |