

Paper Menu >>
Journal Menu >>
 Vol.3, No.1, 72-80 (2012) Journ al of Biophysical Chemistry http://dx.doi.org/10.4236/jbpc.2012.31009 “Doubling” of local photon emissions when two simultaneous, spatially-separated, chemiluminescent reactions share the same magnetic field configurations Blake T. Dotta, Michael A. Persinger* Biomolecular Sciences Program, Laurentian University, Sudbury, Canada; *Corresponding Author: [email protected] Received 5 September 2011; revised 30 October 2011; accepted 12 November 2011 ABSTRACT The aim of the present experiments was to dis- cern if the “entanglement”-like photon emis- sions from p airs of cell cultures or hu man brains separated by significant distances but sharing the same circling magnetic field could be dem- onstrated with a classic chemiluminescent re- action produced by hydrogen peroxide and hy- pochlorite. Simultaneous injection of the same amount of peroxide into a local dish (above a photomultiplier tube) and a dish 10 m away in a closed chamber produced a “doubling” of the durations of the photon spikes only when the two reactions were placed in the center of sepa- rate spaces around each of which magnetic fields were generated as accelerating group ve- locities containing decreasing phase modula- tions followed by decelerating group velocities embedded with increasing phase modulations. The duration of this “entanglement” was about 8 min. These results suggest that separate dis- tances behave as if they were “the same space” if they are exposed to the same precise temporal configuration of magnetic fields with specific angular velocities. Keywords: Photon Emission; Entanglement; Angularly Accelerating Magnetic Fields; Hydrogen Peroxide/Hypochlorite Reaction 1. INTRODUCTION The concept of locality (local causes) requires each physical event or change in event to have a physical cause which occupies the immediate space-time of the effect [1-3]. We have been developing a procedure to study experimentally the characteristics of nonlocality [4, 5]. When particular temporal configurations of changing angular velocities of weak magnetic fields are generated at the same time within two separate rings of solenoids separated by 10 m simultaneous phenomena that are congruent with the theoretical expectations for “excess correlations” or “entanglements” are observed [6]. Meas- urements in two separate loci that should have been ran- domly associated were excessively correlated if they shared the same unique magnetic space. We interpreted the effect as a transposition of space-time coordinates for the two distant loci such that they behave as the “same space” without involvement of classically propagating electromagnetic fields. We found that the most robust “excess correlations” that implied nonlocality required accelerating or deceler- ating rates of change in angular velocity as determined by the duration of the magnetic field at each solenoid within a circular array as they were serially activated. For example, when two human subjects separated by 10 m shared the same circumcerebrally rotating magnetic fields the changes in power within specific electroen- cephalographic frequencies of the person sitting in the dark reflected the light flash frequency presented to the other person who was sitting in a closed acoustic cham- ber in another room [7]. To pursue this phenomenon with more precision, and fewer organismic complexities subsequent experiments measured photon emission by a photomultiplier tube (PMT) from cells in one space within the ring of sole- noids while light flashes were delivered to cells within another ring of solenoids. Dotta et al. [5] found reliable and statistically significant increases (~2×) in photon emissions (background levels of ~5 × 10–11 W/m2) from plates of approximately one million melanoma cells housed in darkness if the other plate of melanoma cells in the closed chamber was stimulated with light. The cells housed in the dark and in the other room shared the same configurations of magnetic fields rotating around Copyright © 2012 SciRes. OPEN ACCESS 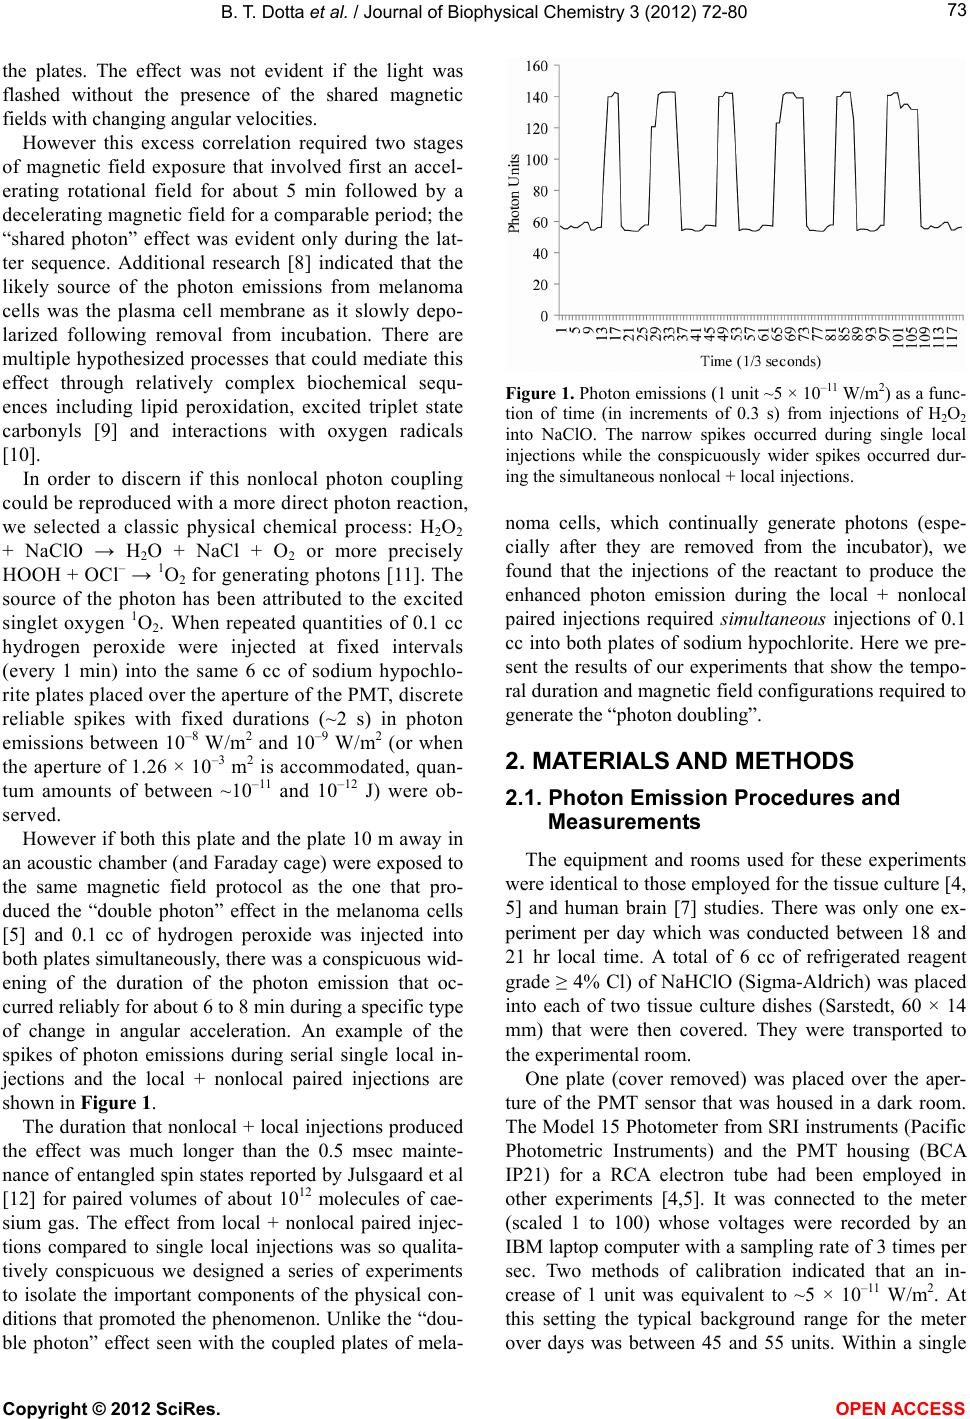 B. T. Dotta et al. / Journal of Biophysical Chemistry 3 (2012) 72-80 73 the plates. The effect was not evident if the light was flashed without the presence of the shared magnetic fields with changing angular velocities. However this excess correlation required two stages of magnetic field exposure that involved first an accel- erating rotational field for about 5 min followed by a decelerating magnetic field for a comparable period; the “shared photon” effect was evident only during the lat- ter sequence. Additional research [8] indicated that the likely source of the photon emissions from melanoma cells was the plasma cell membrane as it slowly depo- larized following removal from incubation. There are multiple hypothesized processes that could mediate this effect through relatively complex biochemical sequ- ences including lipid peroxidation, excited triplet state carbonyls [9] and interactions with oxygen radicals [10]. In order to discern if this nonlocal photon coupling could be reproduced with a more direct photon reaction, we selected a classic physical chemical process: H2O2 + NaClO → H 2O + NaCl + O2 or more precisely HOOH + OCl– → 1O2 for generating photons [11]. The source of the photon has been attributed to the excited singlet oxygen 1O2. When repeated quantities of 0.1 cc hydrogen peroxide were injected at fixed intervals (every 1 min) into the same 6 cc of sodium hypochlo- rite plates placed over the aperture of the PMT, discrete reliable spikes with fixed durations (~2 s) in photon emissions between 10–8 W/m2 and 10–9 W/m2 (or when the aperture of 1.26 × 10⁻³ m2 is accommodated, quan- tum amounts of between ~10–11 and 10–12 J) were ob- served. However if both this plate and the plate 10 m away in an acoustic chamber (and Faraday cage) were exposed to the same magnetic field protocol as the one that pro- duced the “double photon” effect in the melanoma cells [5] and 0.1 cc of hydrogen peroxide was injected into both plates simultaneously, there was a conspicuous wid- ening of the duration of the photon emission that oc- curred reliably for about 6 to 8 min during a specific type of change in angular acceleration. An example of the spikes of photon emissions during serial single local in- jections and the local + nonlocal paired injections are shown in Figure 1. The duration that nonlocal + local injections produced the effect was much longer than the 0.5 msec mainte- nance of entangled spin states reported by Julsgaard et al [12] for paired volumes of about 1012 molecules of cae- sium gas. The effect from local + nonlocal paired injec- tions compared to single local injections was so qualita- tively conspicuous we designed a series of experiments to isolate the important components of the physical con- ditions that promoted the phenomenon. Unlike the “dou- ble photon” effect seen with the coupled plates of mela- Figure 1. Photon emissions (1 unit ~5 × 10–11 W/m2) as a func- tion of time (in increments of 0.3 s) from injections of H2O2 into NaClO. The narrow spikes occurred during single local injections while the conspicuously wider spikes occurred dur- ing the simultaneous nonlocal + local injections. noma cells, which continually generate photons (espe- cially after they are removed from the incubator), we found that the injections of the reactant to produce the enhanced photon emission during the local + nonlocal paired injections required simultaneous injections of 0.1 cc into both plates of sodium hypochlorite. Here we pre- sent the results of our experiments that show the tempo- ral duration and magnetic field configurations required to generate the “photon doubling”. 2. MATERIALS AND METHODS 2.1. Photon Emission Procedures and Measurements The equipment and rooms used for these experiments were identical to those employed for the tissue culture [4, 5] and human brain [7] studies. There was only one ex- periment per day which was conducted between 18 and 21 hr local time. A total of 6 cc of refrigerated reagent grade ≥ 4% Cl) of NaHClO (Sigma-Aldrich) was placed into each of two tissue culture dishes (Sarstedt, 60 × 14 mm) that were then covered. They were transported to the experimental room. One plate (cover removed) was placed over the aper- ture of the PMT sensor that was housed in a dark room. The Model 15 Photometer from SRI instruments (Pacific Photometric Instruments) and the PMT housing (BCA IP21) for a RCA electron tube had been employed in other experiments [4,5]. It was connected to the meter (scaled 1 to 100) whose voltages were recorded by an IBM laptop computer with a sampling rate of 3 times per sec. Two methods of calibration indicated that an in- crease of 1 unit was equivalent to ~5 × 10–11 W/m2. At this setting the typical background range for the meter over days was between 45 and 55 units. Within a single Copyright © 2012 SciRes. OPEN ACCESS 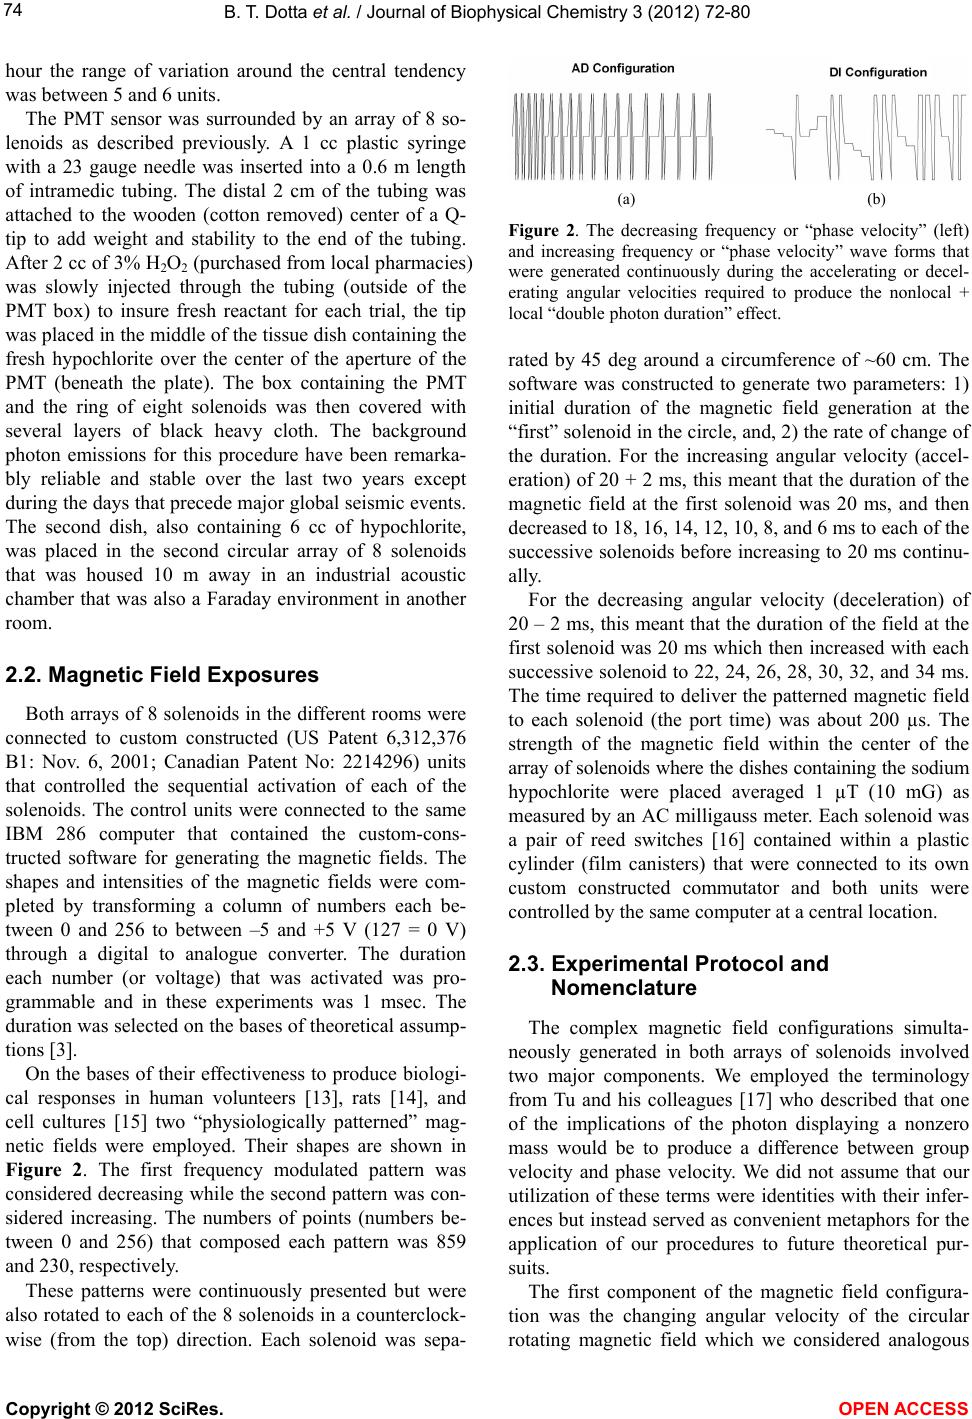 B. T. Dotta et al. / Journal of Biophysical Chemistry 3 (2012) 72-80 74 hour the range of variation around the central tendency was between 5 and 6 units. The PMT sensor was surrounded by an array of 8 so- lenoids as described previously. A 1 cc plastic syringe with a 23 gauge needle was inserted into a 0.6 m length of intramedic tubing. The distal 2 cm of the tubing was attached to the wooden (cotton removed) center of a Q- tip to add weight and stability to the end of the tubing. After 2 cc of 3% H2O2 (purchased from local pharmacies) was slowly injected through the tubing (outside of the PMT box) to insure fresh reactant for each trial, the tip was placed in the middle of the tissue dish containing the fresh hypochlorite over the center of the aperture of the PMT (beneath the plate). The box containing the PMT and the ring of eight solenoids was then covered with several layers of black heavy cloth. The background photon emissions for this procedure have been remarka- bly reliable and stable over the last two years except during the days that precede major global seismic events. The second dish, also containing 6 cc of hypochlorite, was placed in the second circular array of 8 solenoids that was housed 10 m away in an industrial acoustic chamber that was also a Faraday environment in another room. 2.2. Magnetic Field Exposures Both arrays of 8 solenoids in the different rooms were connected to custom constructed (US Patent 6,312,376 B1: Nov. 6, 2001; Canadian Patent No: 2214296) units that controlled the sequential activation of each of the solenoids. The control units were connected to the same IBM 286 computer that contained the custom-cons- tructed software for generating the magnetic fields. The shapes and intensities of the magnetic fields were com- pleted by transforming a column of numbers each be- tween 0 and 256 to between –5 and +5 V (127 = 0 V) through a digital to analogue converter. The duration each number (or voltage) that was activated was pro- grammable and in these experiments was 1 msec. The duration was selected on the bases of theoretical assump- tions [3]. On the bases of their effectiveness to produce biologi- cal responses in human volunteers [13], rats [14], and cell cultures [15] two “physiologically patterned” mag- netic fields were employed. Their shapes are shown in Figure 2. The first frequency modulated pattern was considered decreasing while the second pattern was con- sidered increasing. The numbers of points (numbers be- tween 0 and 256) that composed each pattern was 859 and 230, respectively. These patterns were continuously presented but were also rotated to each of the 8 solenoids in a counterclock- wise (from the top) direction. Each solenoid was sepa- (a) (b) Figure 2. The decreasing frequency or “phase velocity” (left) and increasing frequency or “phase velocity” wave forms that were generated continuously during the accelerating or decel- erating angular velocities required to produce the nonlocal + local “double photon duration” effect. rated by 45 deg around a circumference of ~60 cm. The software was constructed to generate two parameters: 1) initial duration of the magnetic field generation at the “first” solenoid in the circle, and, 2) the rate of change of the duration. For the increasing angular velocity (accel- eration) of 20 + 2 ms, this meant that the duration of the magnetic field at the first solenoid was 20 ms, and then decreased to 18, 16, 14, 12, 10, 8, and 6 ms to each of the successive solenoids before increasing to 20 ms continu- ally. For the decreasing angular velocity (deceleration) of 20 – 2 ms, this meant that the duration of the field at the first solenoid was 20 ms which then increased with each successive solenoid to 22, 24, 26, 28, 30, 32, and 34 ms. The time required to deliver the patterned magnetic field to each solenoid (the port time) was about 200 µs. The strength of the magnetic field within the center of the array of solenoids where the dishes containing the sodium hypochlorite were placed averaged 1 µT (10 mG) as measured by an AC milligauss meter. Each solenoid was a pair of reed switches [16] contained within a plastic cylinder (film canisters) that were connected to its own custom constructed commutator and both units were controlled by the same computer at a central location. 2.3. Experimental Protocol and Nomenclature The complex magnetic field configurations simulta- neously generated in both arrays of solenoids involved two major components. We employed the terminology from Tu and his colleagues [17] who described that one of the implications of the photon displaying a nonzero mass would be to produce a difference between group velocity and phase velocity. We did not assume that our utilization of these terms were identities with their infer- ences but instead served as convenient metaphors for the application of our procedures to future theoretical pur- suits. The first component of the magnetic field configura- tion was the changing angular velocity of the circular rotating magnetic field which we considered analogous Copyright © 2012 SciRes. OPEN ACCESS 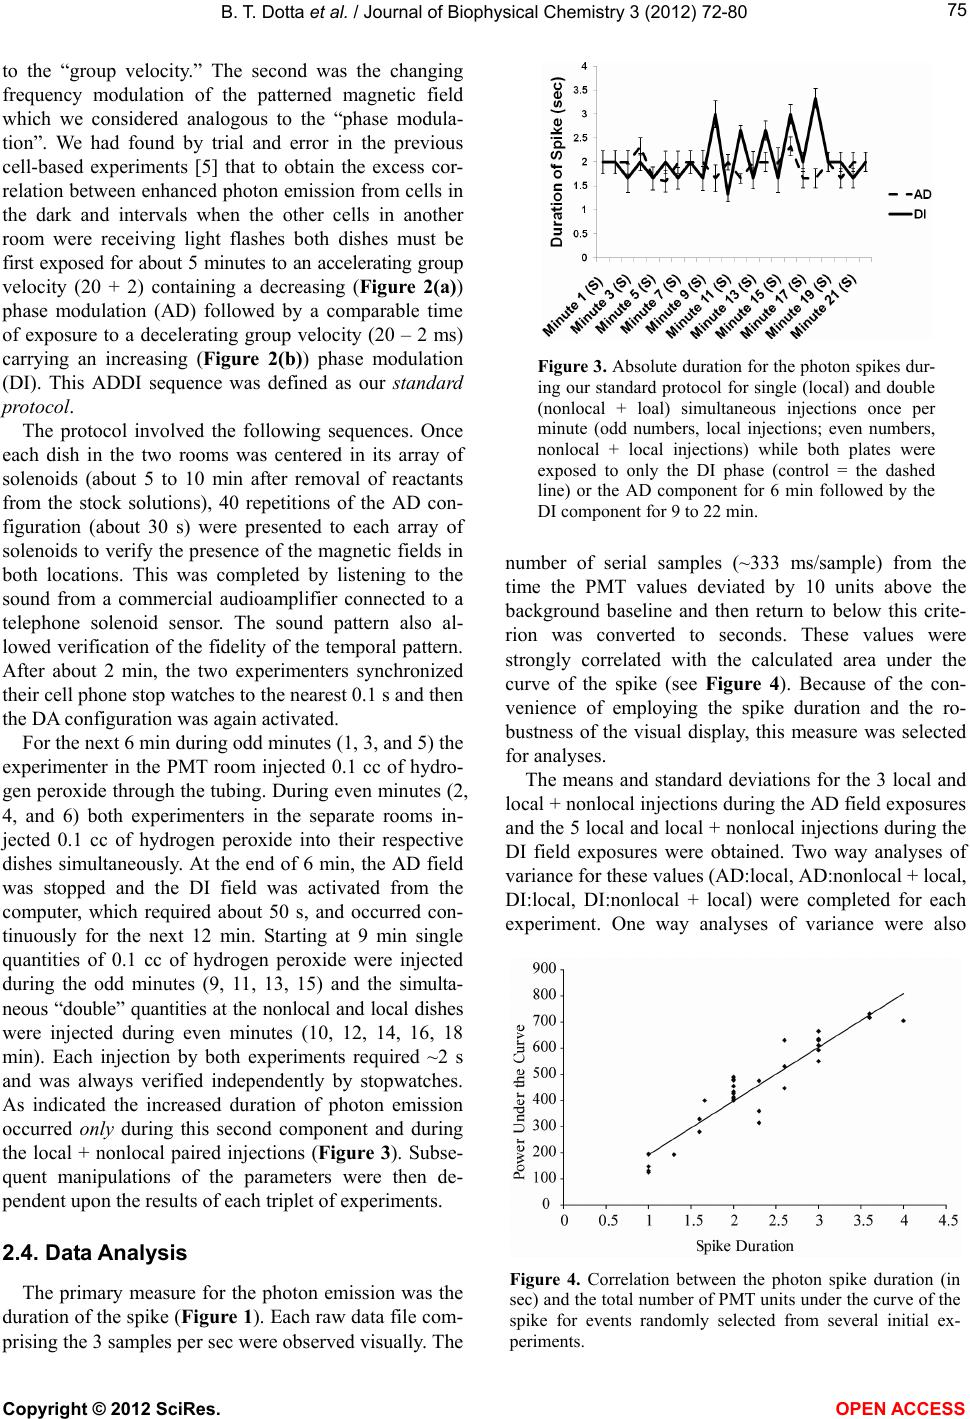 B. T. Dotta et al. / Journal of Biophysical Chemistry 3 (2012) 72-80 75 to the “group velocity.” The second was the changing frequency modulation of the patterned magnetic field which we considered analogous to the “phase modula- tion”. We had found by trial and error in the previous cell-based experiments [5] that to obtain the excess cor- relation between enhanced photon emission from cells in the dark and intervals when the other cells in another room were receiving light flashes both dishes must be first exposed for about 5 minutes to an accelerating group velocity (20 + 2) containing a decreasing (Figure 2(a)) phase modulation (AD) followed by a comparable time of exposure to a decelerating group velocity (20 – 2 ms) carrying an increasing (Figure 2(b)) phase modulation (DI). This ADDI sequence was defined as our standard protocol. The protocol involved the following sequences. Once each dish in the two rooms was centered in its array of solenoids (about 5 to 10 min after removal of reactants from the stock solutions), 40 repetitions of the AD con- figuration (about 30 s) were presented to each array of solenoids to verify the presence of the magnetic fields in both locations. This was completed by listening to the sound from a commercial audioamplifier connected to a telephone solenoid sensor. The sound pattern also al- lowed verification of the fidelity of the temporal pattern. After about 2 min, the two experimenters synchronized their cell phone stop watches to the nearest 0.1 s and then the DA configuration was again activated. For the next 6 min during odd minutes (1, 3, and 5) the experimenter in the PMT room injected 0.1 cc of hydro- gen peroxide through the tubing. During even minutes (2, 4, and 6) both experimenters in the separate rooms in- jected 0.1 cc of hydrogen peroxide into their respective dishes simultaneously. At the end of 6 min, the AD field was stopped and the DI field was activated from the computer, which required about 50 s, and occurred con- tinuously for the next 12 min. Starting at 9 min single quantities of 0.1 cc of hydrogen peroxide were injected during the odd minutes (9, 11, 13, 15) and the simulta- neous “double” quantities at the nonlocal and local dishes were injected during even minutes (10, 12, 14, 16, 18 min). Each injection by both experiments required ~2 s and was always verified independently by stopwatches. As indicated the increased duration of photon emission occurred only during this second component and during the local + nonlocal paired injections (Figure 3). Subse- quent manipulations of the parameters were then de- pendent upon the results of each triplet of experiments. 2.4. Data Analysis The primary measure for the photon emission was the duration of the spike (Figure 1). Each raw data file com- prising the 3 samples per sec were observed visually. The Figure 3. Absolute duration for the photon spikes dur- ing our standard protocol for single (local) and double (nonlocal + loal) simultaneous injections once per minute (odd numbers, local injections; even numbers, nonlocal + local injections) while both plates were exposed to only the DI phase (control = the dashed line) or the AD component for 6 min followed by the DI component for 9 to 22 min. number of serial samples (~333 ms/sample) from the time the PMT values deviated by 10 units above the background baseline and then return to below this crite- rion was converted to seconds. These values were strongly correlated with the calculated area under the curve of the spike (see Figure 4). Because of the con- venience of employing the spike duration and the ro- bustness of the visual display, this measure was selected for analyses. The means and standard deviations for the 3 local and local + nonlocal injections during the AD field exposures and the 5 local and local + nonlocal injections during the DI field exposures were obtained. Two way analyses of variance for these values (AD:local, AD:nonlocal + local, DI:local, DI:nonlocal + local) were completed for each experiment. One way analyses of variance were also Figure 4. Correlation between the photon spike duration (in sec) and the total number of PMT units under the curve of the spike for events randomly selected from several initial ex- periments. Copyright © 2012 SciRes. OPEN ACCESS  B. T. Dotta et al. / Journal of Biophysical Chemistry 3 (2012) 72-80 76 conducted when appropriate. Effect sizes, the amount of variance explained, were calculated in order to estimate the magnitude of the effect. Spectral analyses employed classic methods. All data were analyzed by PC SPSS 16. 3. RESULTS AND SYSTEMATIC MANIPULATIONS OF PARAMETERS 3.1. Reliability and Validity of Effect The means and standard deviations for the durations of the photon emission for the local (single) injections and nonlocal + local paired injections for the AD and DI components for a total of 15 experiments on different days distributed over a three month period are shown in Figure 5. Analysis of variance demonstrated a statisti- cally significant difference [F(1, 71) = 59.81, p < 0.001] that explained (Ω2 estimates) about 50% of the variance of the dependent variable. The effects were so large and qualitatively conspicuous that statistical analyses were note required to discern them but were included as a formality. Because the duration of the photon emission when both experimenters each injected 0.1 cc of hydrogen peroxide simultaneously (nonlocal + local paired injec- tions) were only about 0.65 to 0.69 wider than a single local injection, twice (0.2 cc) the usual amounts of hy- drogen peroxide were serially injected once per min into the dish above the PMT. As can be seen in Figure 6, the photon duration of the 0.2 cc single local injection did not differ significantly from the nonlocal + local paired injection trials when the two experimenters each injected 0.1 cc simultaneously into the dish over the PMT and Figure 5. Means and standard deviations for the net increase in duration of the photon spike during the si- multaneous nonlocal + local injections of 0.1 cc of hy- drogen peroxide compared to the previous single 0.1 cc (local) injection during the presentation of the AD (accelerating angular velocity, decreasing phase veloc- ity) and DI (decelerating angular velocity, increasing phase phase velocity) periods for 15 experiments. Figure 6. Mean and standard deviations for the net in- crease of the width of photon spike when 0.2 cc (dou- ble the standard amount) was injected locally (into the plate over the PMT) during the AD and DI durations. into the dish in another room that shared the same mag- netic field configuration. We inferred that equivalent quanta of photon emission from the single 0.2 cc injec- tion in the dish over the PMT and the two 0.1 cc injec- tions in separate dishes indicated that the latter was equivalent to 0.2 cc injected locally. 3.2. Verifying Optimal Magnetic Field Temporal Sequence and Configuration We then investigated if the continuous application for 20 min of only either the AD field or the DI field would produce “double” photon duration that we obtained dur- ing the nonlocal + local paired injections. There was no significant widening of the photon spike between the nonlocal + local and local injections during the 9 to 18 min period, the interval where the effect was reliably produced using the standard protocol. Presentations of the DI field first for 6 min and then the AD field after- wards (reversed sequence) for 9 to 18 min also did not evoke the effect. Because these results suggested that a DI configuration must follow an AD configuration, we first applied the typical AD field for 6 min and then ap- plied the DI field as usual except that the same patterned (“phase-modulated”) field was the reversed temporal order of the 859 points of the decreasing frequency or “phase” modulation field. In other words, the frequency or “phase” was now increasing (the reversed direction for the pattern in Figure 2(a)). As can be seen in Figure 7 the significant increases in the durations of photon spikes, the nonlocal + local paired injection effect, were again displayed. These results suggested that the re- quirement for the AD-DI sequence as an operational process rather than dependent upon a specific wave form. 3.3. Manipulating the Acceleration and Phase Modulation Components To discern if the AD-DI configuration was essential, Copyright © 2012 SciRes. OPEN ACCESS  B. T. Dotta et al. / Journal of Biophysical Chemistry 3 (2012) 72-80 77 Figure 7. Means and standard deviations for the net increase in the durations of the photon spike when the decreasing frequency or “phase velocity” pattern gen- erated during the accelerating angular velocity condi- tion was reversed (DI2) so it was displaying an in- creased frequency or “phase velocity” during the de- celerating angular velocity condition. the accelerating group velocity was presented with the increasing phase modulation (AI) and the decelerating group velocity was presented with the decreasing phase modulation (DD). This was the opposite of our standard protocol where the accelerating packet was associated with a decelerating phase (AD) and the decelerating packet was associated with an increasing phase (DI). There was no statistically significant evidence of the local + nonlocal effect regardless of the presentation or- der AI-DD or DD-AI. To test the importance of the “phase-modulation” within the group velocity the same accelerating field (20 + 2 ms) contained a synchronous, sine-wave 7 Hz pattern (no frequency or phase modulation) and the decelerating field (20 – 2 ms) also contained the synchronous (sine wave) 7 Hz pattern. The pattern was generated by con- verting the appropriate row of numbers that produced the 7 Hz sequence to voltages by the same software and hardware as the “phase modulated” patterns. Again, there was no evidence of significant widening of the photon emission duration during the nonlocal + local double injection. In all of the above experiments the average durations of photon spikes during the single (local) injec- tions in the dish over the PMT did not differ from any of the other single (local) injections. The mean and SD of 40 randomly selected values from our records for single injections was 1.92 sec and 0.29 sec (coefficient of varia- tion = 15%), respectively, which reiterates the precision of the duration of the photon emission and rate of injec- tion of reactant. To verify that the change in velocity of the rotating magnetic field was important for the 20 + 2 ms (AD) and 20 – 2 ms (DI) group acceleration, the standard protocol was applied using 20 + 0 ms for both the AD and DI components. This meant that, with the exception of the “acceleration” of moving in a circle, the “velocity” of the changing magnetic field (duration of activation of each successive solenoid) was constant. There was no signifi- cant widening of the duration of the spike during the local + nonlocal paired injections. To insure that the acceleration component was impor- tant but was not unique to the 20 + 2 ms and 20 – 2 ms parameters, the standard protocol was applied using 100 + 10 ms during the DA component and 100 – 10 ms dur- ing the DI component, or, 30 + 3 ms during the DA component and 30 – 3 ms during the DI component. The phase directions remained the same. For the first pa- rameter, for the 100 ms base duration, this meant that the duration of the field at each successive solenoid along the 8 circularly arranged solenoids changed from 100 ms to 30 ms during one rotation and from 100 ms to 170 ms during one rotation, respectively. The widening effect during the local + nonlocal paired injections was clearly observed for both the 30 ± 3 ms and 100 ± 10 ms con- figurations; the latter is shown in Figure 8. These result reaffirmed the observation that the sequence of an accel- erating field embedded with a decreasing phase modula- tion followed by a decelerating field embedded with an increasing phase modulation was essential for the phe- nomenon. 3.4. Determining the Temporal Window of the Effect In our standard protocol in which we first observed the local + nonlocal paired injection effect the AD compo- nent was presented for 6 min while the DI component was presented for 18 min. To isolate the temporal dura- Figure 8. Means and standard deviations for the net increase in the duration of the photon spike when the same decreasing and increasing frequency or “phase velocity” fields were employed and the accelerating and decelerating angular velocity durations where 100 + 10 ms and 100 – 10 ms instead of the standard 20 + 2 ms and 20 – 2 ms. Copyright © 2012 SciRes. OPEN ACCESS  B. T. Dotta et al. / Journal of Biophysical Chemistry 3 (2012) 72-80 78 tion of this “window” for the “doubling” of photon emis- sion, the duration of the first standard component, AD, was varied in a randomized order over several days to be: 0.5, 1, 2, 3, 4, 6, 8, 9, 10, 12 and 16 min before the stan- dard AI field was initiated. The sequence of single and double injections followed the same procedure as usual: single injections 1, 3, 5, 9, 11, 13, 15, and 17 min after the beginning of the experiment and nonlocal + local paired injections 2, 4, 6, 10, 12, 14, 16, and 18 min after the beginning of the experiment. The emergence of the local + nonlocal paired injection effect was measured by averaging the duration of those photon spikes and sub- tracting the values from the previous spike durations of the local injections. The results are shown in Figure 9. A statistically significant increase (divide the SD by the numbers of trials, i.e., 12) in the spike duration during the DI field when the nonlocal + local injections oc- curred was evident if only 1 min of the AD field was first presented. The optimal duration of the AD pre-exposure before the AI field was presented was between 3 and 6 min. However if the AD field was presented for more than 8 min, the effect did not emerge even if the DI field was applied for an additional 16 min. 4. DISCUSSION The macroscopic demonstration of “excess correla- tion” between spatial loci from which photons are emit- ted would have potentially paradigm-shifting implica- tions for our interpretations of interactions between che- mical reactions within and without the living cell. The results suggest that under special conditions two loci separated by significant distances would become “the same space”. Living cells and organisms emit photons in the order of 106 photons/m2·s [18]. Hippocampal slices emit photons with power densities of about 10–12 W/m2 Figure 9. Means and standard deviations of the net increase in duration of the photon spike during the usual DI phase during nonlocal + local injections as a function of the initial duration of the first AD phase (the duration “0” means the DI phase was presented from the beginning). that are phase-locked to theta activity [19]. Theta activity (4 to 7 Hz), upon which 40 Hz ripples are carried, is the intrinsic dominant frequency band for this neuroanatomi- cal structure that is central to memory consolidation for the mammalian brain, that is, the representation of spatial experience. Human beings instructed to engage in imagery while sitting in the dark also display reliable increases of com- parable densities in photon emissions that are strongly correlated with the quantitative electroencephalographic activity. The imagery-coupled increases in photon emis- sion from the right side of the head are about a factor of 2 (doubling) within the order of 10–11 W/m2 or the equivalent energy associated with about 107 cortical neu- rons if each generated 10 action potentials per second with ~2 × 10–20 J per action potential. During the last ten years several experiments [20] in our laboratory have shown that the conditions that contribute to entanglement between two brains, a history of shared spatial proximity, is associated with coherent experiences and cognitive processes if both participants shared the same circularly rotating magnetic fields with the changing angular ve- locities employed in the present experiment. However the complexity of these biological systems has made pursuit of the mechanism difficult. In the present study a discrete chemical reaction that produces a reliable, measured amount of photon emis- sions displayed an even more robust effect that did not require complex statistical analyses to be discerned. When two spatially separate volumes of liquid hypochlo- rite shared the same configuration of angularly acceler- ating magnetic fields simultaneous injection of 0.1 cc of hydrogen peroxide into each volume by two experiment- ers (nonlocal + local) produced a widening of the photon duration in the volume over the PMT that was equivalent to injecting twice the amount (0.2 cc) only into this volume in that location. 4.1. The Precision of Temporal Configurations The results of approximately 45 different experiments over several months demonstrated this “entanglement”: two separate loci behaved as a single space for the dura- tion of about eight (8) minutes under optimal conditions. This first required the application of an accelerating group velocity within which the phase modulation was decreasing followed by a second application of a decel- erating group velocity within which the phase modula- tion was increasing. The “double photon” effect from nonlocal + local injections was evident with only 1 min of exposure to the first application but was maximal be- tween 3 and 6 min of exposure before the second appli- cation was presented. Copyright © 2012 SciRes. OPEN ACCESS  B. T. Dotta et al. / Journal of Biophysical Chemistry 3 (2012) 72-80 79 The data clearly indicated that a change in angular ve- locity (acceleration) was required; constant velocity magnetic fields did not produced the effect. In addition, the phase modulation of the group velocity must be changing (in the opposite direction to the group velocity) as well; a fixed frequency “phase” did not produce the effect. That this combination of temporal processes was essential rather than the precise 20 msec base rate of the magnetic field for the first solenoid was shown by the production of the effect if the base rate was shifted to 100 ms but the vectorial configuration of the group and phase velocities remained the same. We selected the nomenclature of Tu et al. [17] so that potentially convenient applications might be applied to potential mechanisms. One of the implications of a pho- ton mass being non-zero is the resulting frequency de- pendence of the velocity of electromagnetic waves pro- pagating in free space. Although the magnetic fields in our study were not propagating but were time-coupled, spatially rotating, time-varying fields, the application may be relevant for conditions of non-locality and entan- glement. The superposition principle of entanglement can be satisfied if classical phases of interfering electro- magnetic waves, such as optical holograms, occur [21]. 4.2. Potential Origins for the “Temporal Dilatation” The challenge is to discern the mechanism that would accommodate the approximately 8 min duration of en- tanglement (or the effective transposition of two loci), as inferred by the “doubling” of the photon spike duration during simultaneous nonlocal + local stimulation. In ad- dition to the obvious similarity between the time required for light to travel between the earth and the sun in com- parison with the presumed instantaneous effect of gravi- tational waves [22], there are avenues of investigation for which experiments can be designed to systematically manipulate critical variables. For example, with a non- zero photon mass, the dispersion elicits a frequency de- pendence whereby the group velocity and the phase ve- locity differ as we simulated in our experiments. A dis- persion of velocity of a photon with a nonzero mass al- lows a potential condition for space-time dilation or con- traction. The direct experimental measurements of the disper- sion of light within the 108 Hz to 1015 Hz range, the in- crement associated with visible light, showed a relative difference in velocity of ∆c/c < 10–7 [17]. Using the clas- sic Lorentz contraction of 22 11tv c the above difference would be equivalent to about 500 s or 8 min- utes. This “window” is within the range of the doubling of the photon effect measured repeatedly in this study. If we assume there is some scale invariance operating within the phenomenon then the duration of our infer- ence of entanglement, about 8 minutes, should be pro- portional to the maintenance of the 0.5 msec (5 × 10⁻⁴ s) spin state observed [12] for two volumes of caesium gas each containing 1012 molecules. The number of mole- cules in the quantum of H2O2 we injected would be 0.1 cc (10–4 L) × 3 × 10⁻² (3%) in water (55 M/L) times 6.023 × 10²³ molecules/M or ~1020 molecules. When the quantum efficiency and the results of photon scatter are accom- modated, the numbers of molecules could be ~1018. The proportional entanglement would be in the order of 500 s which is within the range of our observations. From a third perspective with direct connections to causal quantum gravity [23], the phenomenon observed may be explored as events within quantum gravity Hil- bert space and a possible extended particle analogous to a soliton. El Naschie [24] mathematically reproduced the result of this assumption and deduced that the mass of the fundamental exotic transfinite particle would be ~1.8 MeV or ~3 × 10–13 J in a standardized setting. This may be important because the quantum of photon energy as- sociated with the 0.1 cc injections was within this order of magnitude (10–12 to 10–11 J). Although often consid- ered exotic, gravitational instantons are related to tun- neling events where there is a sudden appearance of a microscopic window in space-time. 5. CONCLUSION The results presented in this manuscript are the most reliable and internally consistent demonstrations of a possible macroscopic example of nonlocality and entan- glement that we have encountered in the laboratory. Unlike the cell studies where concurrence of photon emissions between two loci could not be controlled easily, the photon emissions from H2O2 and NaClO between two sites could be synchronized. The experimental ex- amination of the maximum distance between the two plates sharing the appropriate magnetic configurations that exhibit the phenomenon is the next logical step. 6. ACKNOWLEDGEMENTS Thanks to Dr. W. E Bosarge, Jr, Chairman, Quantlab LLC for finan- cial support and Viger M. Persinger for technical comments. REFERENCES [1] Stapp, H. (2009) Nonlocality. In: Greenberger, D., Hent- schel, K. and Weinert, F., Eds., Compendium of Quantum Physics, Springer, Berlin, 404-410. [2] Persinger, M.A. and Lavallee, C.F. (2010) Theoretical and experimental evidence of macroscopic entanglement be- tween human brain activity and photon emissions: Impli- Copyright © 2012 SciRes. OPEN ACCESS  B. T. Dotta et al. / Journal of Biophysical Chemistry 3 (2012) 72-80 Copyright © 2012 SciRes. OPEN ACCESS 80 cations for quantum consciousness and future applica- tions. Journal of Consciousness and Research, 1, 785- 807. [3] Persinger, M.A. and Koren, S.A. (2007) A theory of neu- rophysics and quantum neuroscience: Implications for brain function and the limits of consciousness. Interna- tional Journal of Neuroscience, 117, 157-175. doi:10.1080/00207450500535784 [4] Dotta, B.T., Mulligan, B.P., Hunter, M.D. and Persinger, M.A. (2009) Evidence of macroscopic quantum entan- glement during double quantitative electroencephalo- graphic (QEEG) measurements of friends vs strangers. NeuroQuantology, 7, 548-551. [5] Dotta, B.T., Buckner, C.A., Lafrenie, R.M. and Persinger, M.A. (2011) Photon emissions from human brain and cell culture exposed to distally rotating magnetic fields shared by separate light-stimulated brains and cells. Brain Re- search, 388, 77-88. doi:10.1016/j.brainres.2011.03.001 [6] Arnesen, M.C., Bose, S. and Vedral, V. (2001) Natural thermal and magnetic entanglement in the 1D Heisenberg model. Physical Re view Letters, 87, 017901-1/017901-4. [7] Persinger, M.A., Saroka, K.S., Lavallee, C.F., Booth, J.M., Hunter, M.D., Mulligan, B.P., Koren, S.A., Wu, H.P. and Gang, N. (2010) Correlated cerebral events between physically and sensor isolated pairs of subjects exposed to yoked circumcerebral magnetic fields. Neuroscience Letters, 486, 231-234. doi:10.1016/j.neulet.2010.09.060 [8] Dotta, B.T., Buckner, C.A, Cameron, D., Lafrenie, R.F. and Persinger, M.A. (2011) Biophoton emission from cell cultures: biochemical evidence of the plasma membrane as the primary source. General Physiology and Biophys- ics, in press. [9] Tillbury, R.N. and Quickenden, T.I. (1988) Spectral and time dependence studies of the ultraweak biolumines- cence emitted by bacterium Escherichia Coli. Photoch- emistry and Photobiology B, 47, 145-150. doi:10.1111/j.1751-1097.1988.tb02704.x [10] Vogel, R. and Suessmuth, R. (1988) Interaction of bacte- rial cells with weak light emission from culture media. Bioelectrochemistry and Bioenergetics, 45, 93-101. doi:10.1016/S0302-4598(98)00067-1 [11] Kahn, A.U. and Kasha, M. (1994) Singlet molecular oxygen evolution upon simple acidification of aqueous hypochlorite: Application to studies on the deleterious health effects of chlorinated drinking water. Proceedings of the National Academy of Sciences, 91, 12362-12364. doi:10.1073/pnas.91.26.12362 [12] Julsgaard, B., Kozhekin, A. and Polzik, E.S. (2001) Ex- perimental long-lived entanglement of two macroscopic objects. Nature, 413, 400-403. doi:10.1038/35096524 [13] Persinger, M.A. (2003) Neurobehavioral effects of brief exposures to weak intensity, complex magnetic fields within experimental and clinical settings. In: McLean, M.J., Engstrom, S. and Holocomb, R.R., Eds., Magneto- therapy: Potential Therapeutic Benefits and Adverse Ef- fects, TFG Press, New York, 89-118. [14] Martin, L.J., Koren, S.A. and Persinger, M.A. (2004) Thermal analgesic effects from weak, complex magnetic fields and pharmacological interactions. Pharmacology, Biochemistry and Behavior, 78, 217-227. doi:10.1016/j.pbb.2004.03.016 [15] Buckner, C.A. (2011) Effects of electromagnetic fields on biological processes are spatial and temporal-dependent. Ph.D. Thesis, Laurentian University. [16] Richards, P.M., Persinger, M.A. and Koren, S.A. (1996) Modification of semantic memory in normal subjects by application across the temporal lobes of a weak (1 mi- croTesla) magnetic field structure that promotes long- term potentiation in hippocampal slices. Electro and Magnetobiology, 15, 141-148. [17] Tu, L.-C., Luo, J. and Gillies, G.T. (2005) The mass of the photon. Reports on Progress in Physics, 68, 77-130. doi:10.1088/0034-4885/68/1/R02 [18] Popp, F.-A., Li, K.H., Mei, W.P., Galle, M. and Neurorh, R. (1988) Physical aspects of biophotons. Experientia, 44, 576-585. doi:10.1007/BF01953305 [19] Isojima, Y., Isohima, T., Nagai, K, Kikuchi, K. and Na- kagawa, H. (1995) Ultraweak biochemiluminesence de- tected from rat hippocampal slices. NeuroReports, 6, 658- 660. doi:10.1097/00001756-199503000-00018 [20] Persinger, M.A., Tsang, E.W., Booth, J.N. and Koren, S.A. (2008) Enhanced power within a predicted narrow band of theta activity during stimulation of another by cirum- cerebral weak magnetic fields after weekly spatial prox- imity: Evidence of macroscopic quantum entanglement? NeuroQuantology, 6, 7-21. [21] Ahn, J., Weinacht, T.C. and Bucksbaum, P.N. (2000) In- formation storage and retrieval through quantum phase. Science, 287, 463-465. doi:10.1126/science.287.5452.463 [22] Klocchek, N.V., Palamarchuk, L.E. and Nikonova, M.V. (1995) Preliminary results of investigations into the effect of cosmophysical radiation of a non-electromagnetic na- ture on physical and biological systems. Biophysics, 40, 883-891. [23] Ambjorn, J., Jurkiewicz, J. and Loll, R. (2004) Emer- gence of a 4D world from causal quantum gravity. Phys- ics Review Letters, 93, 13101-13104. [24] El Naschie, M.S. (2004) Gravitational instanton in Hil- bert space and the mass of high energy elementary parti- cles. Chaos, Solitons & Fractals, 20, 917-923. doi:10.1016/j.chaos.2003.11.001 |