

Paper Menu >>
Journal Menu >>
 Vol.3, No.1, 35-38 (2012) Journ al of Biophysical Chemistry http://dx.doi.org/10.4236/jbpc.2012.31004 An interactive 3D viewer of molecules compatible with the suite of ANTHEPROT programs Gilbert Deléage Unité Bases Moléculaires et Structurales des Systèmes Infectieux, UMR 5086 CNRS, Université Claude Bernard Lyon 1, Lyon, France; [email protected] Received 11 October 2011; revised 3 December 2011; accepted 17 December 2011 ABSTRACT In this p aper, I will describe a completely ne w 3D module which can be called from within the well known ANTHEPROT program devoted to protein sequences analysis. This module allows fully interactive handling of high-quality 3D struc- tures with various modes of representation (CA sticks, wireframe, ball and sticks, spacefill mod- els as well as surface, ribbons, Ramachandran plots). Alternatively, ANTHEPROT 3D can be used as an external program fully independant from the global package. It is available from the download page of the web site (http://antheprot-pbil.ibcp.fr/). More than 2800 downloads last year were recorded since the program was delivered. Keywords: Protein; Sequence Analysis; Structural Bioinformatics; Software; 3D Structures 1. INTRODUCTION Many programs [1-7] or Web servers [8-10] exist for the visualisation of th e 3D structure of protein s. Howeve r, few of them have some possibilities for sequence analy- sis [7,11]. In the 90’s, we have proposed one of the very first package for the analysis of protein sequence [12]. For over 20 years, this software has been continuoulsy updated for various plateforms including Apple II, Mac- Intosh, DOS [13] and AIX (IBM unix) operating system in the 1990’s [14-16]. In the latest published version, which is designed for the Windows OS, several im- provements were made such as the addition of a client- server mode [17] for distant submissions that takes ad- vantage of remote servers hosting databases regularly updated [18]. However, at that time, no effective 3D module was associated with the program. In this article, I describe a completely new version of the program ANTHEPROT 3D that allows interactive manipulation of 3D structures of proteins. The program is mainly devoted to th e comprehensive understand ing of biological molecules by viewing their 3D structures. It includes all the standard functions found in other 3D viewers. The main originality is that it can be launched directly from the main window of the widely used AN- THEPROT program designed for the analysis of protein sequence. A gallery showing the possibilities of this module is available at http://antheprot-pbil.ibcp.fr/3D. 2. SYSTEM AND IMPLEMENTATION ANTHEPROT 3D program is a completely new pro- gram for Windows interface, which uses the OpenGL 3D library. So, the program performs best on computers that have OpenGL graphic cards but also works on any card (in a quite performant emulation mode). The program is available, as a complete ready-to-run archive file. An help file (ANTHE.HLP file) is also present in the pack- age. The program can also be considered as an interface for several well known external programs, such as the MSMS molecular surface for surface calculation [19], the ribbon molscript program [20], the DSSP program for secondary structure calculation [21], the DELPHI algo- rithm for electrostatic potential calculations [22] and “REDUCE” program for hydrogen additi on/rem oval [23] . 3. MAIN FEATURES ANTHEPROT 3D consists of 4 different panels (Fig- ure 1). The first one (Figure 1(a)) is the OpenGL win- dow for the graphical display. The manipulation of the molecule can be achieved by a trackball emulation mode that can be activated or deactivated in real time. This feature allows a very precise manipulation of the mole- cule or, alternatively, the discovery of the molecule with a flying mode. Once a PDB file is loaded, the secondary structures are calculated on the fly using the DSSP algo- rithm [21], the CA trace is shown in this window as sticks colored by chain (default). Two other related win- dows are displayed: one (Figure 1(b)) is used to provide a list of amino acids from which the selection of the esidues can be made in a multiple selection mode. The r Copyright © 2012 SciRes. OPEN ACCESS 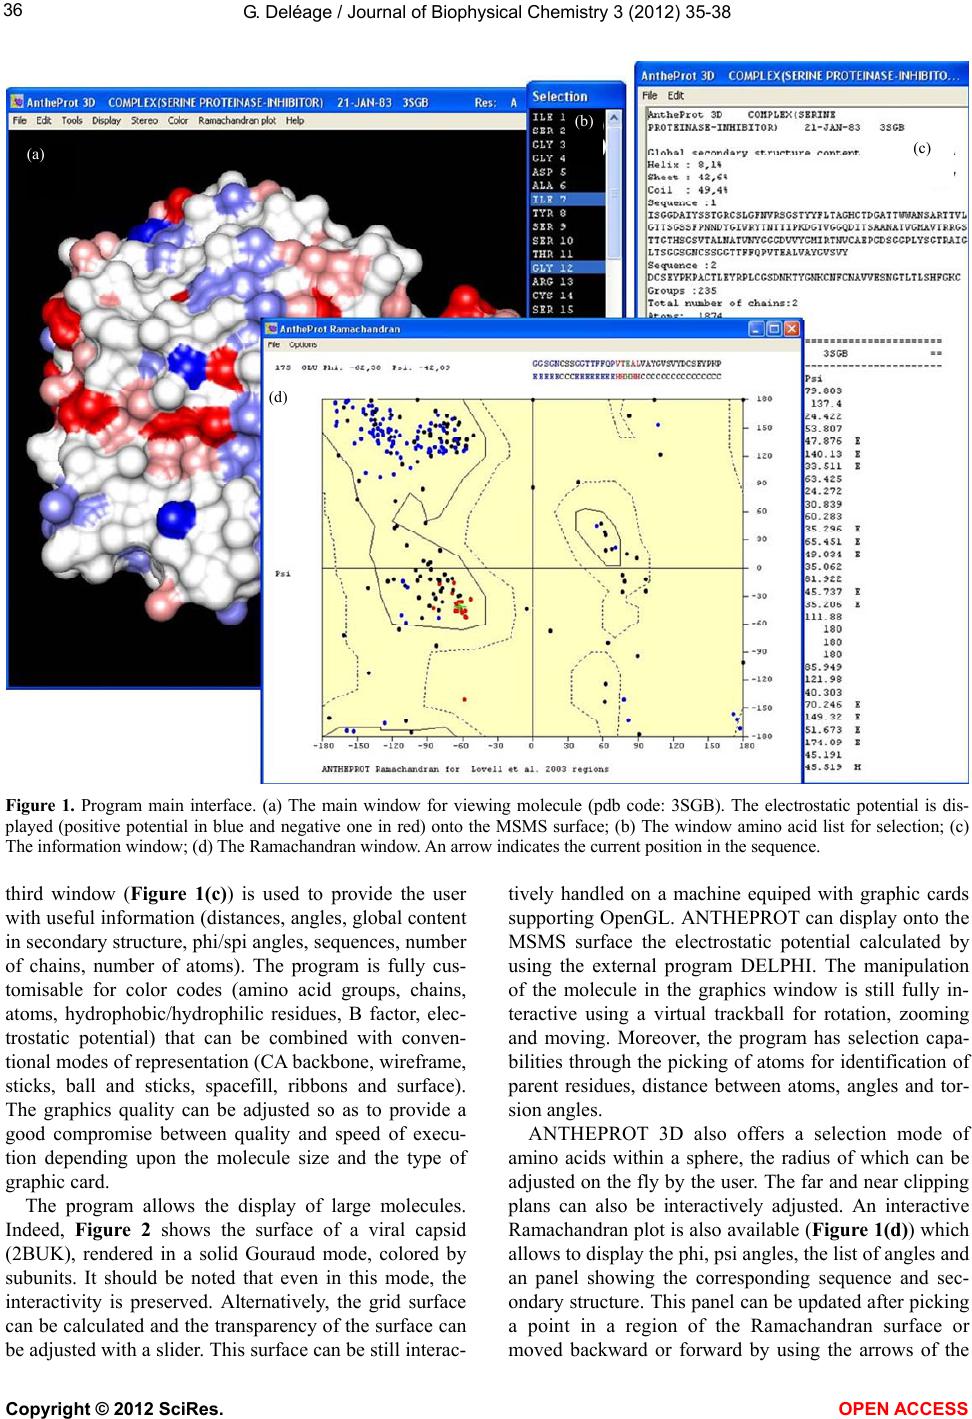 G. Deléage / Journal of Biophysical Chemistry 3 (2 012) 35-38 36 (c) (d) (a) (b) Figure 1. Program main interface. (a) The main window for viewing molecule (pdb code: 3SGB). The electrostatic potential is dis- played (positive potential in blue and negative one in red) onto the MSMS surface; (b) The window amino acid list for selection; (c) The information window; (d) The Ramachandran window. An arrow indicates the current position in the sequence. third window (Figure 1(c)) is used to provide the user with useful information (distances, angles, global content in secondary structure, phi/spi angles, sequences, number of chains, number of atoms). The program is fully cus- tomisable for color codes (amino acid groups, chains, atoms, hydrophobic/hydrophilic residues, B factor, elec- trostatic potential) that can be combined with conven- tional modes of representation (CA backbone, wireframe, sticks, ball and sticks, spacefill, ribbons and surface). The graphics quality can be adjusted so as to provide a good compromise between quality and speed of execu- tion depending upon the molecule size and the type of graphic card. The program allows the display of large molecules. Indeed, Figure 2 shows the surface of a viral capsid (2BUK), rendered in a solid Gouraud mode, colored by subunits. It should be noted that even in this mode, the interactivity is preserved. Alternatively, the grid surface can be calculated and the transparency of the surface can be adjusted with a slider. This surface can be still interac- tively handled on a machine equiped with graphic cards supporting OpenGL. ANTHEPROT can display onto the MSMS surface the electrostatic potential calculated by using the external program DELPHI. The manipulation of the molecule in the graphics window is still fully in- teractive using a virtual trackball for rotation, zooming and moving. Moreover, the program has selection capa- bilities through the picking of atoms for identification of parent residues, distance between atoms, angles and tor- sion angles. ANTHEPROT 3D also offers a selection mode of amino acids within a sphere, the radius of which can be adjus ted on the fly by the user. The f ar and near clipping plans can also be interactively adjusted. An interactive Ramachandran plot is also available (Figure 1(d)) which allows to display the phi, psi angles, the list of angles and an panel showing the corresponding sequence and sec- ondary structure. This panel can be updated after picking a point in a region of the Ramachandran surface or moved backward or forward by using the arrows of the Copyright © 2012 SciRes. OPEN ACCESS 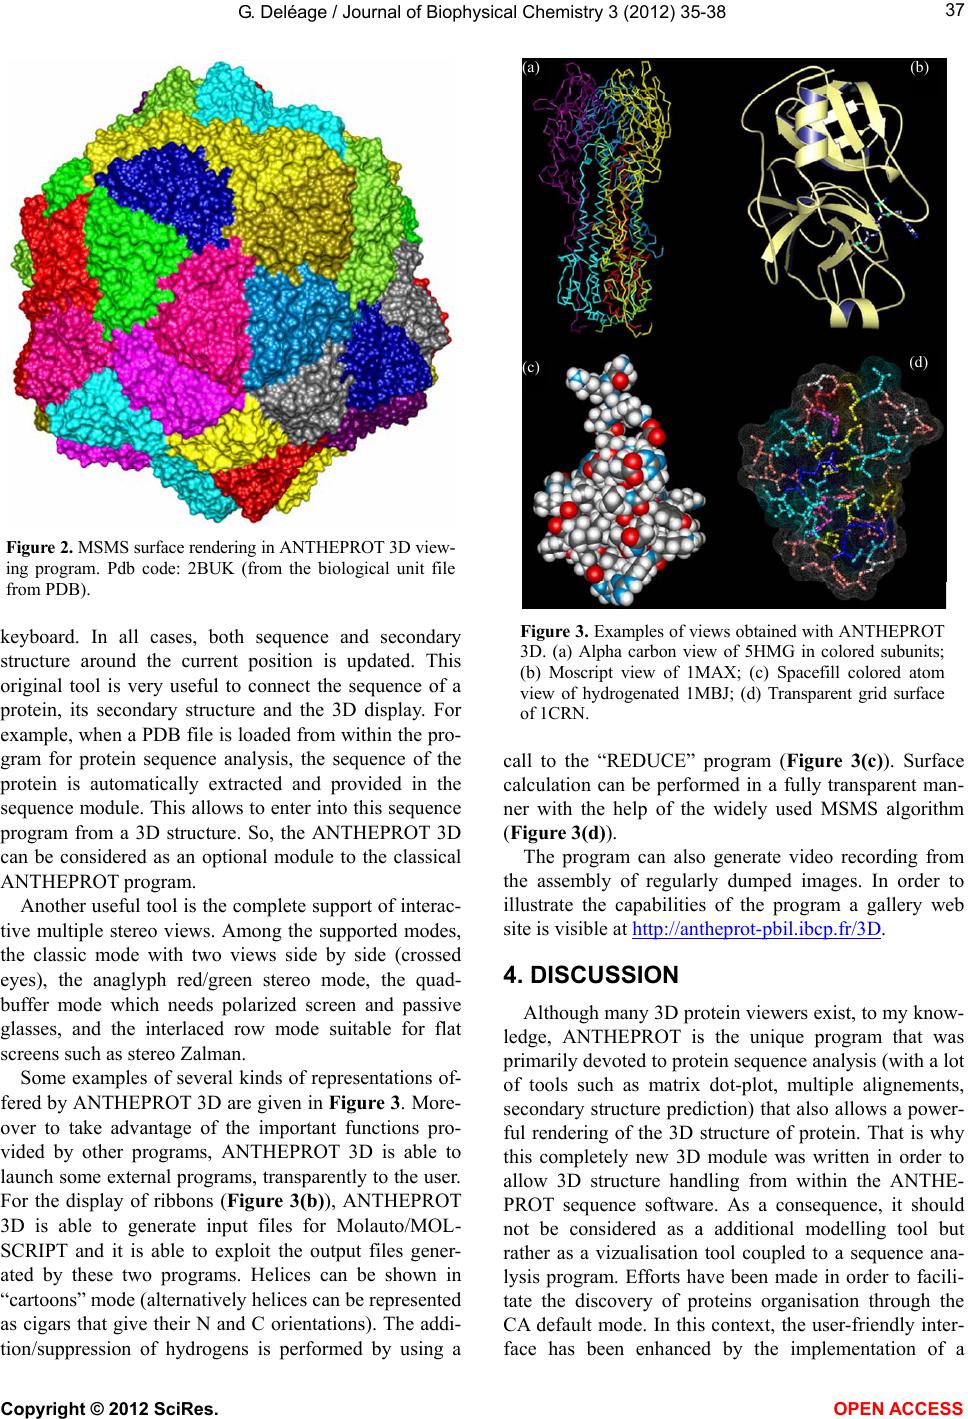 G. Deléage / Journal of Biophysical Chemistry 3 (2 012) 35-38 37 Figure 2. MSMS surface rendering in ANTHEPROT 3D view- ing program. Pdb code: 2BUK (from the biological unit file from PDB). keyboard. In all cases, both sequence and secondary structure around the current position is updated. This original tool is very useful to connect the sequence of a protein, its secondary structure and the 3D display. For example, when a PDB file is loaded from within the pro- gram for protein sequence analysis, the sequence of the protein is automatically extracted and provided in the sequence module. This allows to enter into this sequence program from a 3D structure. So, the ANTHEPROT 3D can be considered as an optional module to the classical ANTHEPROT program. Another useful tool is the complete support of interac- tive multiple stereo views. Among the supported modes, the classic mode with two views side by side (crossed eyes), the anaglyph red/green stereo mode, the quad- buffer mode which needs polarized screen and passive glasses, and the interlaced row mode suitable for flat screens such as stereo Zalman. Some examples of several kinds of representations of- fered by ANTHEPROT 3D are given in Figure 3. More- over to take advantage of the important functions pro- vided by other programs, ANTHEPROT 3D is able to launch some external programs, transparen tly to the user. For the display of ribbons (Figure 3(b)), ANTHEPROT 3D is able to generate input files for Molauto/MOL- SCRIPT and it is able to exploit the output files gener- ated by these two programs. Helices can be shown in “cartoons” mode (alternatively helices can be represented as cigars that give their N and C orientations). The addi- tion/suppression of hydrogens is performed by using a (a) (c) (b) (d) Figure 3. Examples of views obtained with ANTHEPROT 3D. (a) Alpha carbon view of 5HMG in colored subunits; (b) Moscript view of 1MAX; (c) Spacefill colored atom view of hydrogenated 1MBJ; (d) Transparent grid surface of 1CRN. call to the “REDUCE” program (Figure 3(c)). Surface calculation can be performed in a fully transparent man- ner with the help of the widely used MSMS algorithm (Figure 3(d)). The program can also generate video recording from the assembly of regularly dumped images. In order to illustrate the capabilities of the program a gallery web site is visible at http://antheprot-pbil.ibcp.fr/3D. 4. DISCUSSION Although many 3D protein viewers exist, to my know- ledge, ANTHEPROT is the unique program that was primarily devoted to protein sequence analysis (with a lot of tools such as matrix dot-plot, multiple alignements, secondary structure prediction) that also allows a power- ful rendering of the 3D structure of protein. That is why this completely new 3D module was written in order to allow 3D structure handling from within the ANTHE- PROT sequence software. As a consequence, it should not be considered as a additional modelling tool but rather as a vizualisation tool coupled to a sequence ana- lysis program. Efforts have been made in order to facili- tate the discovery of proteins organisation through the CA default mode. In this context, the user-friendly inter- face has been enhanced by the implementation of a Copyright © 2012 SciRes. OPEN ACCESS  G. Deléage / Journal of Biophysical Chemistry 3 (2 012) 35-38 Copyright © 2012 SciRes. 38 [11] Li, W.Z. and Godzik, A. (2006) VISSA: A program to visualize structural features from structure sequence ali- gnment. Bioinformatics, 22, 887-888. doi:10.1093/bioinformatics/btl019 trackball mode which allows an efficient “flying mode” to watch the 3D structure. Efforts were also made to simplify the first use of the program. It is simple and intuitive enough for use by any user without the n eed for experience in the program or in-depth knowledge of the 3D structure of proteins. The ANTHEPROT 3D program is freely available and, during the last 12 months 2888 downloads of the software have been registered. Possible developments include a specialisation of the module to- wards protein interaction interface visualisation and ana- lysis. [12] Deleage, G., Clerc, F.F., Roux, B. and Gautheron, D.C. (1988) Antheprot: A package for protein-sequence analy- sis using a microcomputer. Computer Applications in the Biosciences, 4, 351-356. [13] Deleage, G., Clerc, F.F. and Roux, B. (1989) Antheprot: IBM PC and Apple macintosh versions. Computer Appli- cations in the Bioscie nces, 5, 159-160. [14] Geourjon, C., Deleage, G. and Roux, B. (1991) Antheprot: An Interactive graphics software for analyzing protein structures from sequences. Journal of Molecular Graph- ics, 9, 188-190. doi:10.1016/0263-7855(91)80008-N 5. ACKNOWLEDGEMENTS Thanks are due to Dr. Ramon Yáñez López (University of Barcelona) for providing me some pieces of code for centering molecule and to CNRS and Lyon University for supporting this work. [15] Geourjon, C. and Deleage, G. (1995) Antheprot: A soft- ware to display and analyze 3d nmr structures. Journal of Trace and Microprobe Techniques, 13, 337-338. [16] Geourjon, C. and Deleage, G. (1995) Antheprot-2.0: A 3-dimensional module fully coupled with protein-seq- uence analysis-methods. Journal of Molecular Graphics, 13, 209-212. doi:10.1016/0263-7855(95)00035-5 REFERENCES [1] Pettersen, E.F., Goddard, T.D., Huang, C.C., et al., (2004) UCSF chimera—A visualization system for exploratory research and analysis. Journal of Computational Chemis- try, 25, 1605-1612. doi:10.1002/jcc.20084 [17] Deleage, G., Combet, C., Blanchet, C. and Geourjon, C. (2001) ANTHEPROT: An integrated protein sequence analysis software with client/server capabilities. Com- puters in Biology and Medicine, 31, 259-267. doi:10.1016/S0010-4825(01)00008-7 [2] Sayle, R.A. and Milnerwhite, E.J. (1995) Rasmol—Bio- molecular graphics for all. Trends in Biochemical Sci- ences, 20, 374-376. doi:10.1016/S0968-0004(00)89080-5 [18] Combet, C., Blanchet, C., Geourjon, C. and Deleage, G. (2000) NPS@: Network protein sequence analysis. Trends in Biochemical Sciences, 25, 147-150. doi:10.1016/S0968-0004(99)01540-6 [3] Guex, N. and Peitsch, M.C. (1997) SWISS-MODEL and the Swiss-PdbViewer: An environment for comparative protein modeling. Electrophoresis, 18, 2714-2723. doi:10.1002/elps.1150181505 [19] Sanner, M.F., Olson, A.J. and Spehner, J.C. (1996) Re- duced surface: An efficient way to compute molecular surfaces. Biopolymers, 38, 305-320. doi:10.1002/(SICI)1097-0282(199603)38:3<305::AID-BI P4>3.0.CO;2-Y [4] Hanson, R.M. (2008). Jmol: An open-source Java viewer for chemical structures in 3D. http://www.jmol.org/ [5] Humphrey, W., Dalke, A. and Schulten, K. (1996) VMD: Visual molecular dynamics. Journal of Molecular Graph- ics, 14, 33-38. doi:10.1016/0263-7855(96)00018-5 [20] Kraulis, P.J. (1991) Molscript: A program to produce both detailed and schematic plots of protein structures. Journal of Applied Crystallography, 24, 946-950. doi:10.1107/S0021889891004399 [6] Chavent, M., Levy, B. and Maigret, B. (2008) MetaMol: High-quality visualization of molecular skin surface. Journal of Molecular Graphics & Modelling, 27, 209- 216. doi:10.1016/j.jmgm.2008.04.007 [21] Kabsch, W. and Sander, C. (1983) Dictionary of protein secondary structure—Pattern-recognition of hydrogen- bonded and geometrical features. Biopolymers, 22, 2577- 2637. doi:10.1002/bip.360221211 [7] Catherinot, V. and Labesse, G. (2004) ViTO: Tool for refinement of protein sequence-structure alignments. Bio- informatics, 20, 3694-3696. doi:10.1093/bioinformatics/bth429 [22] Rocchia, W., Alexov, E. and Honig, B. (2001) Extending the applicability of the nonlinear Poisson-Boltzmann equation: Multiple dielectric constants and multivalent ions. Journal of Physical Chemistry B, 105, 6507-6514. doi:10.1021/jp010454y [8] Fournier, D. and Andrade-Navarro, M.A. (2011) PDB- paint, a visualization webservice to tag protein structures with sequence annotations. Bioinformatics, 27, 2605- 2606. [23] Word, J.M., Lovell, S.C., Richardson, J.S. and Richard- son, D.C. (1999) Asparagine and glutamine: Using hy- drogen atom contacts in the choice of side-chain amide orientation. Journal of Molecular Biology, 285, 1735- 1747. doi:10.1006/jmbi.1998.2401 [9] Cipriano, G., Wesenberg, G., et al., (2011) GRAPE: Gra- phical abstracted protein explorer. Nucleic Acids Re- search, 38, W595-W601. doi:10.1093/nar/gkq398 [10] Sasin, J.M. and Bujnicki, J.M. (2004) COLORADO3D, a web server for the visual analysis of protein structures. Nucleic Acids Research, 32, W586-W589. doi:10.1093/nar/gkh440 OPEN A CCESS OPEN A CCESS |