

Paper Menu >>
Journal Menu >>
 Journal of Transportation Technologies, 2012, 2, 67-74 http://dx.doi.org/10.4236/jtts.2012.21008 Published Online January 2012 (http://www.SciRP.org/journal/jtts) Plug-In Vehicle Acceptance and Probable Utilization Behaviour Patrícia Baptista, Catarina Rolim, Carla Silva* Department of Mechanical Engineering, IDMEC/IST-Instituto Superior Técnico, Lisbon, Portugal Email: *[email protected] Received November 12, 2011; revised December 10, 2011; accepted December 20, 2011 ABSTRACT This paper presents a study undertaken to understand the plug-in vehicle acceptance and probable utilization behaviour in terms of charging habits and utility factor (probability of driving in electrical mode). A survey was designed to be answered via World Wide Web, throughout 3 months and only accessible to Portuguese inhabitants. The survey was composed by biographical and car ownership info, mobility patterns, awareness toward plug-in vehicle technologies, price premium and, finally, potential buyer’s attitudes regarding charging vehicles with electricity from the grid. An explanation of how each vehicle technology works in the case of a regular hybrid (HEV), a plug-in hybrid (PHEV) and a pure electric vehicle (EV) was provided. A total sample of 809 volunteers answered the survey, aged above 18 years old, 50% male and 50% female. The results allowed the estimation o f the typical daily driving distance, the Utility Fac- tor curve for plug-in hybrid future users, the charging preferences for future users of pure electric or plug-in hybrid ve- hicles and the necessary feebates to promote the market penetration of such technologies. Other correlations were also analyzed between driving patterns, type of owned car, price premium and the willingness to buy pure electric and plug-in hybrid vehicles. The main policy implications are that an increase of awareness campaigns is necessary if the government intends to support the plug-in electric vehicle technology widespread and a minimum of 5000 € investment per ton of avoided CO2 will be necessary in a year. Keywords: Pure Electric Vehicles; Plug-In Hybrid Vehicles; Utility Factor; Frequency; Period of Recharging 1. Introduction The urge for energy security of supp ly, air quality impro- vement in urban areas and carbon dioxide (CO2) emis- sions reduction are pressing decision makers and vehicle manufacturers to act on the road transportation sector, by introducing more efficient vehicles in the market and spanning the energy sources available. In this sense, it is expected that, in the near future, the tra nspor tation sector will face considerable changes. The market share of hy- brid vehicles (HEV) will probably raise and, in the me- dium-long term future, the market share of alternative vehicle technologies such as plug-in hybrid (PHEV), electric (EV) or fuel cell vehicles will eventually start increasing. The European Commission regards electric vehicles as a “very important” part of its green strategy and the Euro- pean Parliament has even launched a resolution sup- porting the development and innovation regarding this issue [1]. The Portuguese government has also been committed to enforcing the introduction of electric vehi- cles in Portugal by launching the Electric Mobility Plan/ “Plano de Mobilidade Eléctrica” (PME) considering that “electric vehicles will be the next logical step from hy- brids due to their high potential for CO2 reduction” [2,3]. The expected evolution for EV and PHEV vehicles in Portugal, whose current light-duty fleet comprises rou- ghly 6 million internal combustion vehicles (ca. 50% die- sel, 50% gasoline), ranges from 8000 existing vehicles in 2012 to 150 to 200 thousand in 2020, representing 10% of vehicle sales in 2020 according to PME. However, in terms of actual circulating fleet percentage, these 10% are expected in the following 10 - 15 years ahead [4]. The main assumptions crucial for this scenario are: further increasing oil prices; taxation and vehicle incentives legis- lation in Europe continues as announced; availability of high variety of EVs and HEVs; availability of charging infrastructure; and improvement in battery technology/ costs as expected (up to 65% reductions in battery costs in 2020) [3 ]. Th e ann ounced incentives of the Portuguese Government to introduce the use of EVs include the ex- istence of 320 charging po ints by year 2010 and 1300 by 2011, no payment of vehicle acquisition and circulation *Corresponding author. C opyright © 2012 SciRes. JTTs 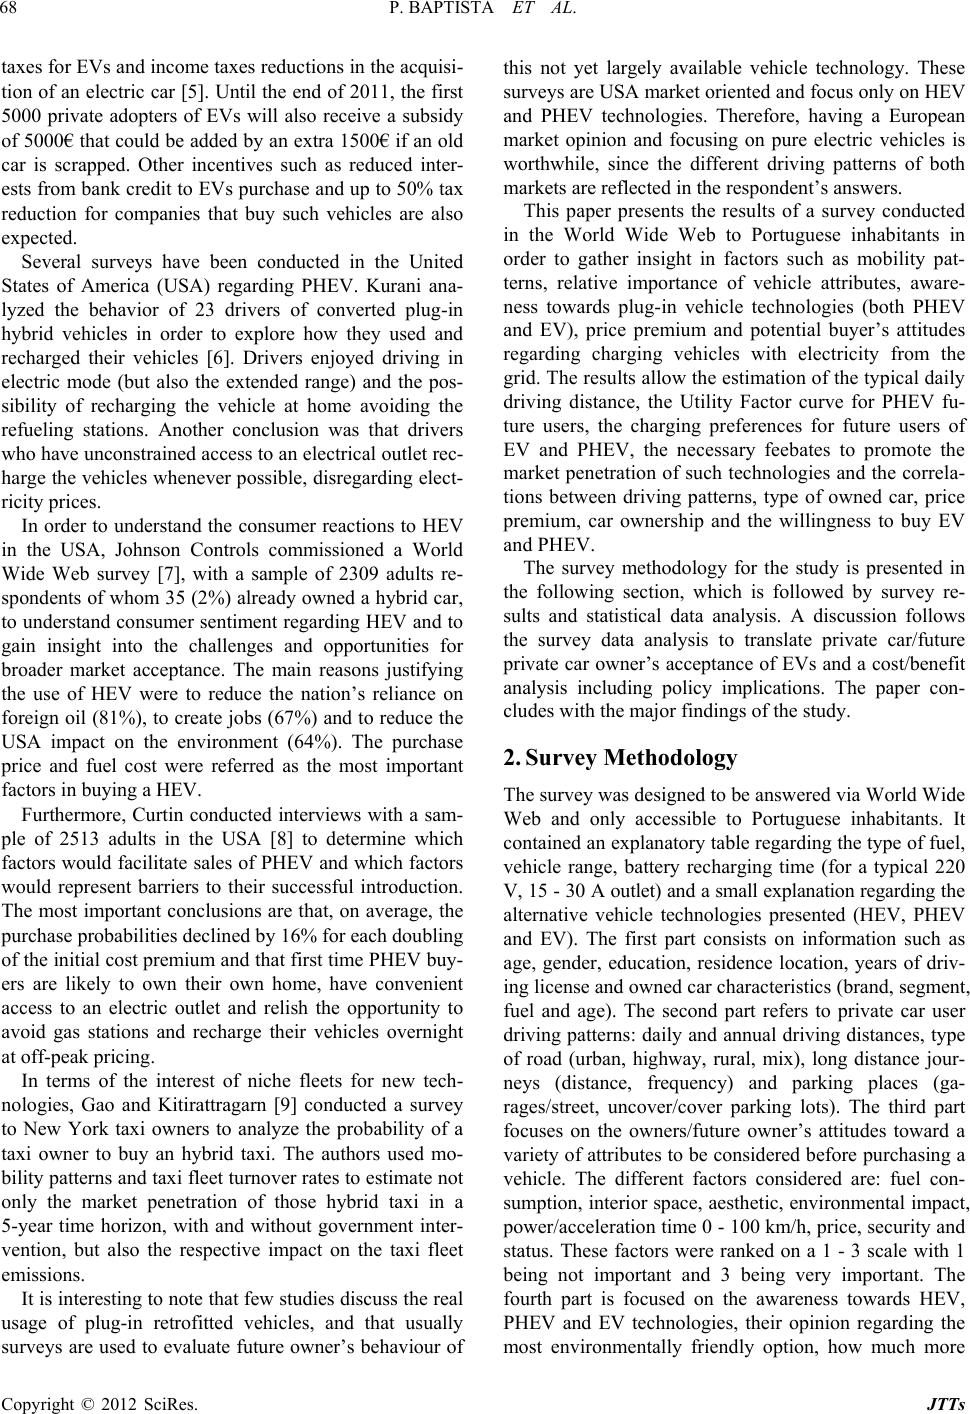 P. BAPTISTA ET AL. 68 taxes for EVs and income taxes reductions in the acquisi- tion of an electric car [5]. Until the end of 2011, the first 5000 private adopters of EVs will also receive a subsidy of 5000€ that could be added by an extra 1500€ if an old car is scrapped. Other incentives such as reduced inter- ests from bank credit to EVs purchase and up to 50% tax reduction for companies that buy such vehicles are also expected. Several surveys have been conducted in the United States of America (USA) regarding PHEV. Kurani ana- lyzed the behavior of 23 drivers of converted plug-in hybrid vehicles in order to explore how they used and recharged their vehicles [6]. Drivers enjoyed driving in electric mode (but also the extended range) and the pos- sibility of recharging the vehicle at home avoiding the refueling stations. Another conclusion was that drivers who have unconstrained access to an electrical outlet rec- harge the vehicles whenever possible, disregarding elect- ricity prices. In order to understand the consumer reactions to HEV in the USA, Johnson Controls commissioned a World Wide Web survey [7], with a sample of 2309 adults re- spondents of whom 35 (2%) already owned a hybrid car, to understand consumer sen timent regarding HEV an d to gain insight into the challenges and opportunities for broader market acceptance. The main reasons justifying the use of HEV were to reduce the nation’s reliance on foreign oil (81%), to create jobs (67%) and to reduce the USA impact on the environment (64%). The purchase price and fuel cost were referred as the most important factors in buying a HEV. Furthermore, Curtin conducted interviews with a sam- ple of 2513 adults in the USA [8] to determine which factors would facilitate sales of PHEV and which factors would represent barriers to their successful introduction. The most important conclusions are that, on average, the purchase probabilities declined by 16% for each doubling of the initial cost premium and that first time PHEV buy- ers are likely to own their own home, have convenient access to an electric outlet and relish the opportunity to avoid gas stations and recharge their vehicles overnight at off-peak pricing. In terms of the interest of niche fleets for new tech- nologies, Gao and Kitirattragarn [9] conducted a survey to New York taxi owners to analyze the probability of a taxi owner to buy an hybrid taxi. The authors used mo- bility patterns and taxi fleet tu rnover rates to estimate not only the market penetration of those hybrid taxi in a 5-year time horizon, with and without government inter- vention, but also the respective impact on the taxi fleet emissions. It is interesting to note that few studies discuss the real usage of plug-in retrofitted vehicles, and that usually surveys are used to evaluate future owner’s behaviour of this not yet largely available vehicle technology. These surveys are USA market oriented and focus only on HEV and PHEV technologies. Therefore, having a European market opinion and focusing on pure electric vehicles is worthwhile, since the different driving patterns of both markets are reflected in the respondent’s answers. This paper presents the results of a survey conducted in the World Wide Web to Portuguese inhabitants in order to gather insight in factors such as mobility pat- terns, relative importance of vehicle attributes, aware- ness towards plug-in vehicle technologies (both PHEV and EV), price premium and potential buyer’s attitudes regarding charging vehicles with electricity from the grid. The results allow the estimation of the typical daily driving distance, the Utility Factor curve for PHEV fu- ture users, the charging preferences for future users of EV and PHEV, the necessary feebates to promote the market penetration of such technologies and the correla- tions between driving patterns, type of owned car, price premium, car ownership and the willingness to buy EV and PHEV. The survey methodology for the study is presented in the following section, which is followed by survey re- sults and statistical data analysis. A discussion follows the survey data analysis to translate private car/future private car owner’s acceptance of EVs and a cost/benefit analysis including policy implications. The paper con- cludes with th e major findings of the study. 2. Survey Methodology The su rv ey w as d es ign ed to be ans w er ed v ia W o r ld Wi d e Web and only accessible to Portuguese inhabitants. It contained an explanatory table regarding the type of fuel, vehicle range, battery recharging time (for a typical 220 V, 15 - 30 A outlet) and a small explanation regarding the alternative vehicle technologies presented (HEV, PHEV and EV). The first part consists on information such as age, gender, education, residence location, years of driv- ing license and owned car characteristics (brand, segment, fuel and age). The second part refers to private car user driving patterns: daily and annual driving distances, type of road (urban, highway, rural, mix), long distance jour- neys (distance, frequency) and parking places (ga- rages/street, uncover/cover parking lots). The third part focuses on the owners/future owner’s attitudes toward a variety of attributes to be considered before purchasing a vehicle. The different factors considered are: fuel con- sumption, interior space, aesthetic, environmental impact, power/acceleration time 0 - 100 km/h, price, security and status. These factors were ranked on a 1 - 3 scale with 1 being not important and 3 being very important. The fourth part is focused on the awareness towards HEV, PHEV and EV technologies, their opinion regarding the most environmentally friendly option, how much more Copyright © 2012 SciRes. JTTs 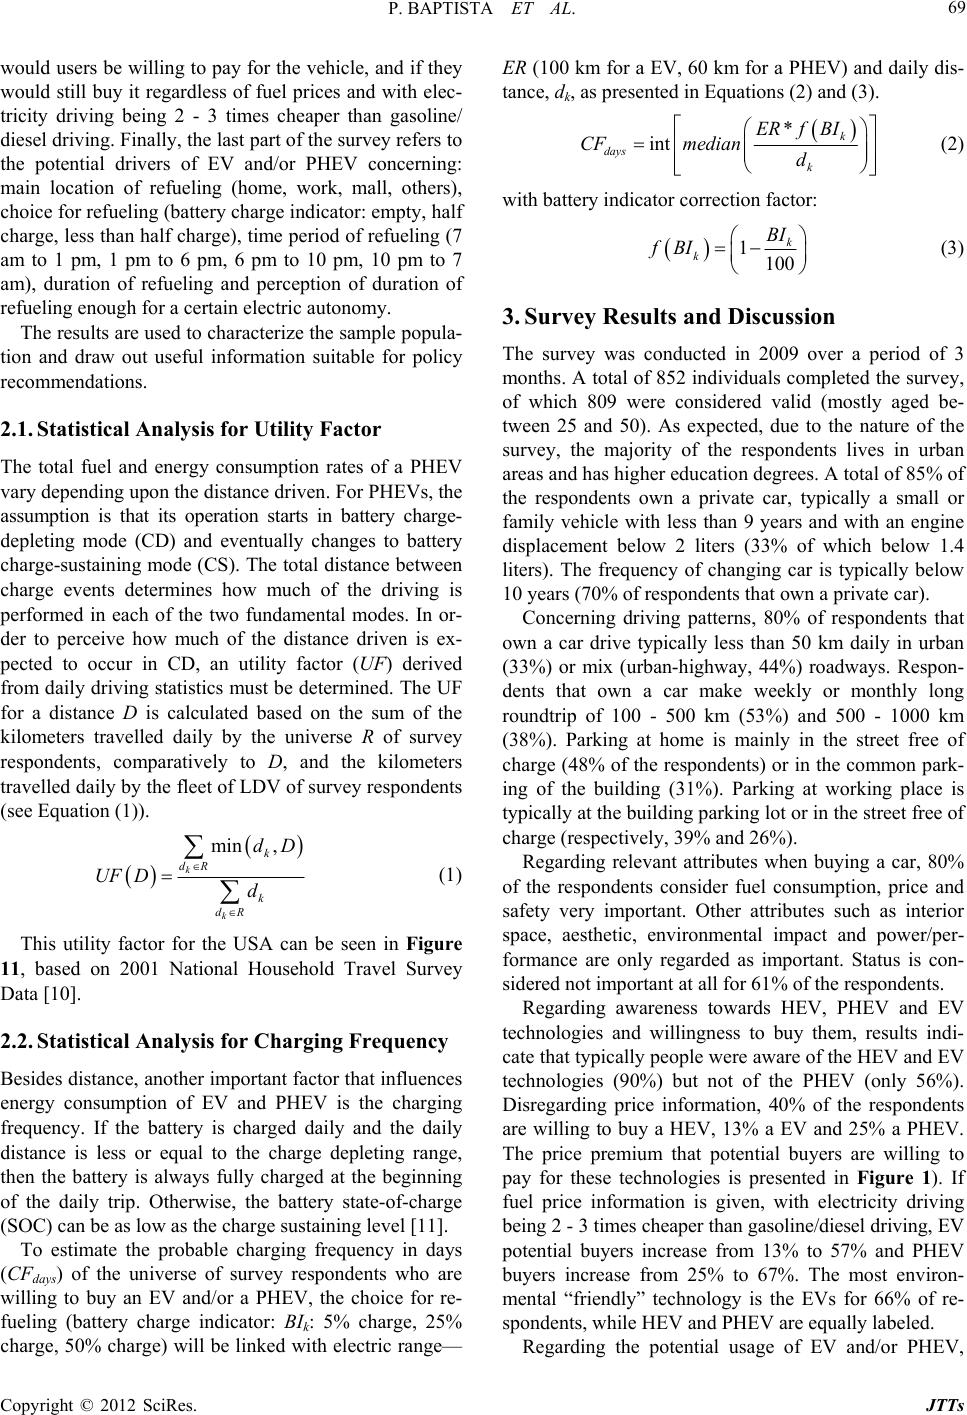 P. BAPTISTA ET AL. 69 would users be willing to pay for the vehicle, and if they would still buy it regardless of fuel prices and with elec- tricity driving being 2 - 3 times cheaper than gasoline/ diesel driving. Finally, the last part of the survey refers to the potential drivers of EV and/or PHEV concerning: main location of refueling (home, work, mall, others), choice for refueling (battery charge indicator: empty, half charge, less than half charge), time period of refueling (7 am to 1 pm, 1 pm to 6 pm, 6 pm to 10 pm, 10 pm to 7 am), duration of refueling and perception of duration of refueling enough fo r a certain electric autonomy. The results are used to characterize the sample popula- tion and draw out useful information suitable for policy recommendations. 2.1. Statistical Analysis for Utility Factor The total fuel and energy consumption rates of a PHEV vary depending upon the distance driven. For PHEVs, the assumption is that its operation starts in battery charge- depleting mode (CD) and eventually changes to battery charge-sustaining mode (CS). The total distance between charge events determines how much of the driving is performed in each of the two fundamental modes. In or- der to perceive how much of the distance driven is ex- pected to occur in CD, an utility factor (UF) derived from daily driving statistics must be d etermined. The UF for a distance D is calculated based on the sum of the kilometers travelled daily by the universe R of survey respondents, comparatively to D, and the kilometers travelled daily by the fleet of LDV of survey respondents (see Equation (1)). min , k k k dR k dR dD UF Dd (1) This utility factor for the USA can be seen in Figure 11, based on 2001 National Household Travel Survey Data [10]. 2.2. Statistical Analysis for Charging Frequency Besides distance, another important factor that influences energy consumption of EV and PHEV is the charging frequency. If the battery is charged daily and the daily distance is less or equal to the charge depleting range, then the battery is always fully charged at the beginning of the daily trip. Otherwise, the battery state-of-charge (SOC) can be as low as the charge sustaining level [11]. To estimate the probable charging frequency in days (CFdays) of the universe of survey respondents who are willing to buy an EV and/or a PHEV, the choice for re- fueling (battery charge indicator: BIk: 5% charge, 25% charge, 50% ch arge) will be linked with electric range— ER (100 km for a EV, 60 km for a PHEV) and daily dis- tance, dk, as presented in Equations (2) and (3). * int k days k ERf BI CFmedian d (2) with battery indicator correction factor: 1100 k k BI fBI (3) 3. Survey Results and Discussion The survey was conducted in 2009 over a period of 3 months. A total of 852 individuals co mpleted the survey, of which 809 were considered valid (mostly aged be- tween 25 and 50). As expected, due to the nature of the survey, the majority of the respondents lives in urban areas and has higher education degrees. A total of 85% of the respondents own a private car, typically a small or family vehicle with less than 9 years and with an engine displacement below 2 liters (33% of which below 1.4 liters). The frequency of changing car is typically below 10 years (70% of respondents that own a private car). Concerning driving patterns, 80% of respondents that own a car drive typically less than 50 km daily in urban (33%) or mix (urban-highway, 44%) roadways. Respon- dents that own a car make weekly or monthly long roundtrip of 100 - 500 km (53%) and 500 - 1000 km (38%). Parking at home is mainly in the street free of charge (48% of the respondents) or in the common park- ing of the building (31%). Parking at working place is typically at the build ing park in g lot or in the street free of charge (respectively, 39% and 26%). Regarding relevant attributes when buying a car, 80% of the respondents consider fuel consumption, price and safety very important. Other attributes such as interior space, aesthetic, environmental impact and power/per- formance are only regarded as important. Status is con- sidered not important at all for 61% of the respondents. Regarding awareness towards HEV, PHEV and EV technologies and willingness to buy them, results indi- cate that typically people were aware of the HEV and EV technologies (90%) but not of the PHEV (only 56%). Disregarding price information, 40% of the respondents are willing to buy a HEV, 13% a EV and 25% a PHEV. The price premium that potential buyers are willing to pay for these technologies is presented in Figure 1). If fuel price information is given, with electricity driving being 2 - 3 times cheaper than gasoline/diesel driving, EV potential buyers increase from 13% to 57% and PHEV buyers increase from 25% to 67%. The most environ- mental “friendly” technology is the EVs for 66% of re- spondents, while HEV and PHEV are equally labeled. Regarding the potential usage of EV and/or PHEV, Copyright © 2012 SciRes. JTTs 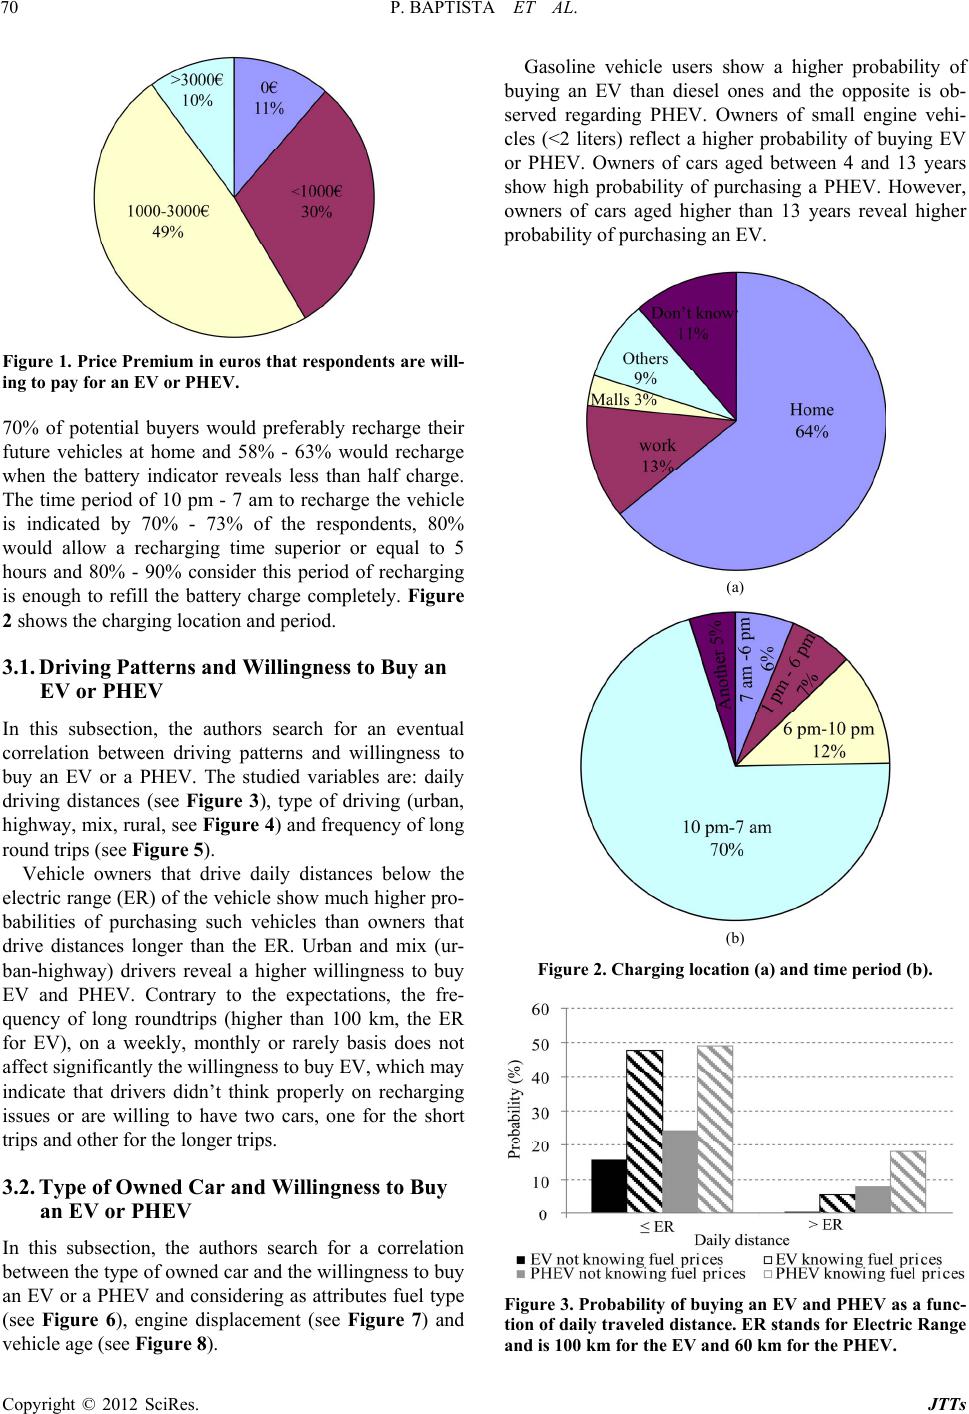 P. BAPTISTA ET AL. 70 Figure 1. Price Premium in euros that respondents are will- ing to pay for an EV or PHEV. 70% of potential buyers would preferably recharge their future vehicles at home and 58% - 63% would recharge when the battery indicator reveals less than half charge. The time period of 10 pm - 7 am to recharge the vehicle is indicated by 70% - 73% of the respondents, 80% would allow a recharging time superior or equal to 5 hours and 80% - 90% consider this period of recharging is enough to refill the battery charge completely. Figure 2 shows the charging location and period. 3.1. Driving Patterns and Willingness to Buy an EV or PHEV In this subsection, the authors search for an eventual correlation between driving patterns and willingness to buy an EV or a PHEV. The studied variables are: daily driving distances (see Figure 3), type of driving (urban, highway, mix, r ural, see Figure 4) and frequen cy of long round trips (see Figure 5). Vehicle owners that drive daily distances below the electric range (ER) of the vehicle show much higher pro- babilities of purchasing such vehicles than owners that drive distances longer than the ER. Urban and mix (ur- ban-highway) drivers reveal a higher willingness to buy EV and PHEV. Contrary to the expectations, the fre- quency of long roundtrips (higher than 100 km, the ER for EV), on a weekly, monthly or rarely basis does not affect significantly the willingn ess to buy EV, which may indicate that drivers didn’t think properly on recharging issues or are willing to have two cars, one for the short trips and other for the longer trips. 3.2. Type of Owned Car and Willingness to Buy an EV or PHEV In this subsection, the authors search for a correlation between the type of owned car and the willingness to buy an EV or a PHEV and considering as attributes fuel type (see Figure 6), engine displacement (see Figure 7) and vehicle age (see Figure 8). Gasoline vehicle users show a higher probability of buying an EV than diesel ones and the opposite is ob- served regarding PHEV. Owners of small engine vehi- cles (<2 liters) reflect a higher probability of buying EV or PHEV. Owners of cars aged between 4 and 13 years show high probability of purchasing a PHEV. However, owners of cars aged higher than 13 years reveal higher probability of purchasing an EV. (a) (b) Figure 2. Charging location (a) and time period (b). Figure 3. Probability of buying an EV and PHEV as a func- tion of daily traveled distance. ER stands for Electric Range and is 100 km for the EV and 60 km for the PHEV. Copyright © 2012 SciRes. JTTs 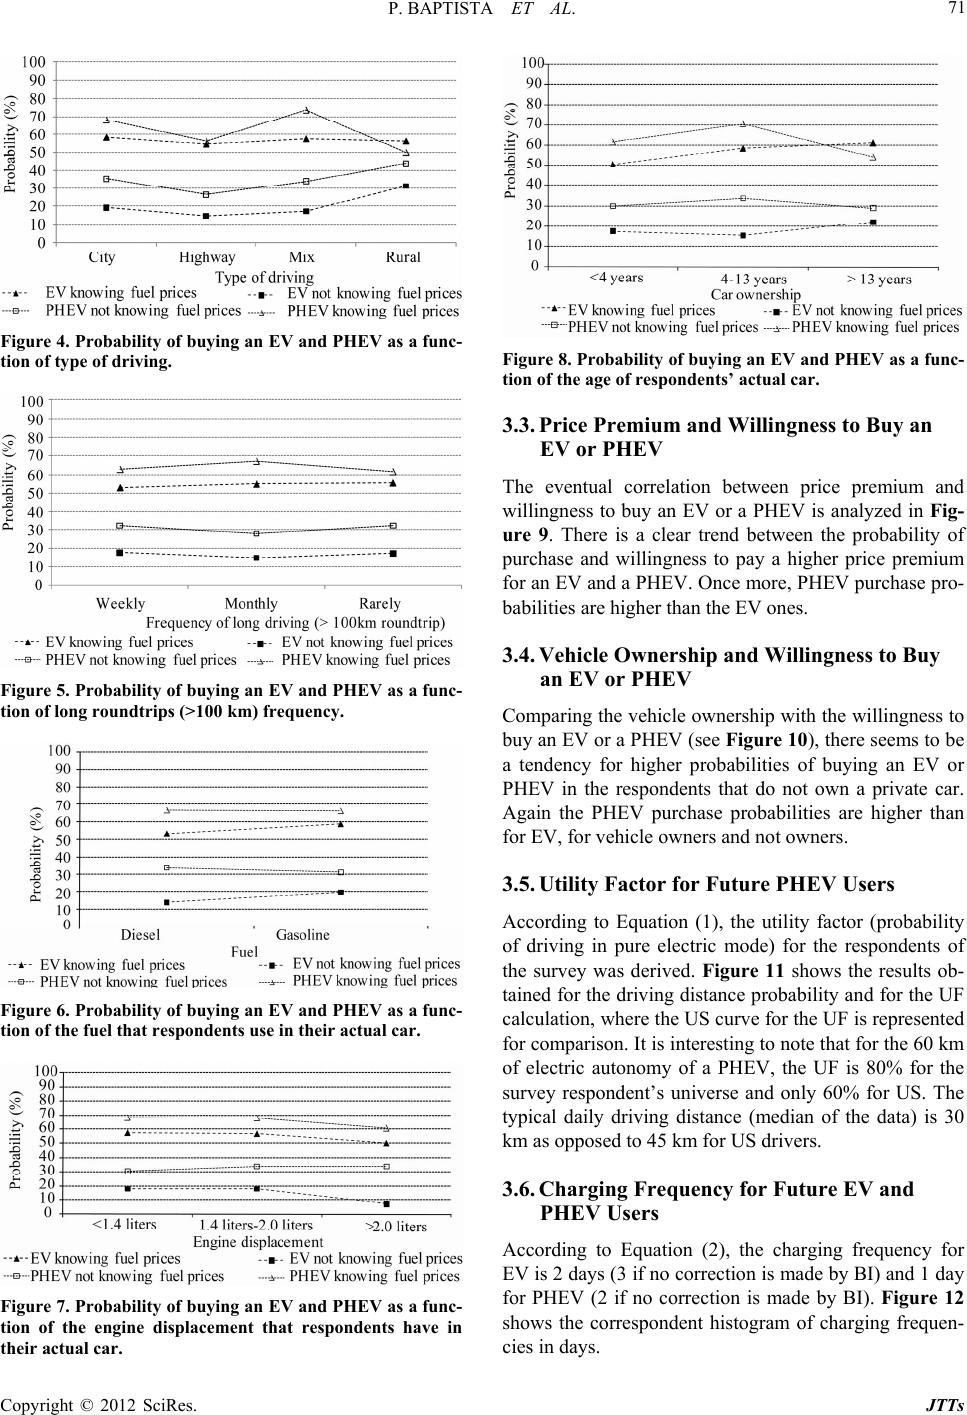 P. BAPTISTA ET AL. 71 Figure 4. Probability of buying an EV and PHEV as a func- tion of type of driving. Figure 5. Probability of buying an EV and PHEV as a func- tion of long roundtrips (>100 km) frequency. Figure 6. Probability of buying an EV and PHEV as a func- tion of the fuel that respondents use in their actual car. Figure 7. Probability of buying an EV and PHEV as a func- tion of the engine displacement that respondents have in their actual car. Figure 8. Probability of buying an EV and PHEV as a func- tion of the age of respondents’ actual car. 3.3. Price Premium and Willingness to Buy an EV or PHEV The eventual correlation between price premium and willingness to buy an EV or a PHEV is analyzed in Fig- ure 9. There is a clear trend between the probability of purchase and willingness to pay a higher price premium for an EV and a PHEV. Once more, PHEV purchase pro- babilities are higher than the EV ones. 3.4. Vehicle Ownership and Willingness to Buy an EV or PHEV Comparing the vehicle ownership with the willingness to buy an EV or a PHEV (see Figure 10), ther e seems to be a tendency for higher probabilities of buying an EV or PHEV in the respondents that do not own a private car. Again the PHEV purchase probabilities are higher than for EV, for vehicle owners and not owners. 3.5. Utility Factor for Future PHEV Users According to Equation (1), the utility factor (probability of driving in pure electric mode) for the respondents of the survey was derived. Figure 11 shows the results ob- tained for the driving distan ce probability and for the UF calculation, where the US curve for the UF is represented for comparison. It is interesting to note that for the 60 km of electric autonomy of a PHEV, the UF is 80% for the survey respondent’s universe and only 60% for US. The typical daily driving distance (median of the data) is 30 km as opposed to 45 km for US drivers. 3.6. Charging Frequency for Future EV and PHEV Users According to Equation (2), the charging frequency for EV is 2 days (3 if no correction is made by BI) and 1 day for PHEV (2 if no correction is made by BI). Figure 12 shows the correspondent histogram of charging frequen- cies in days. Copyright © 2012 SciRes. JTTs 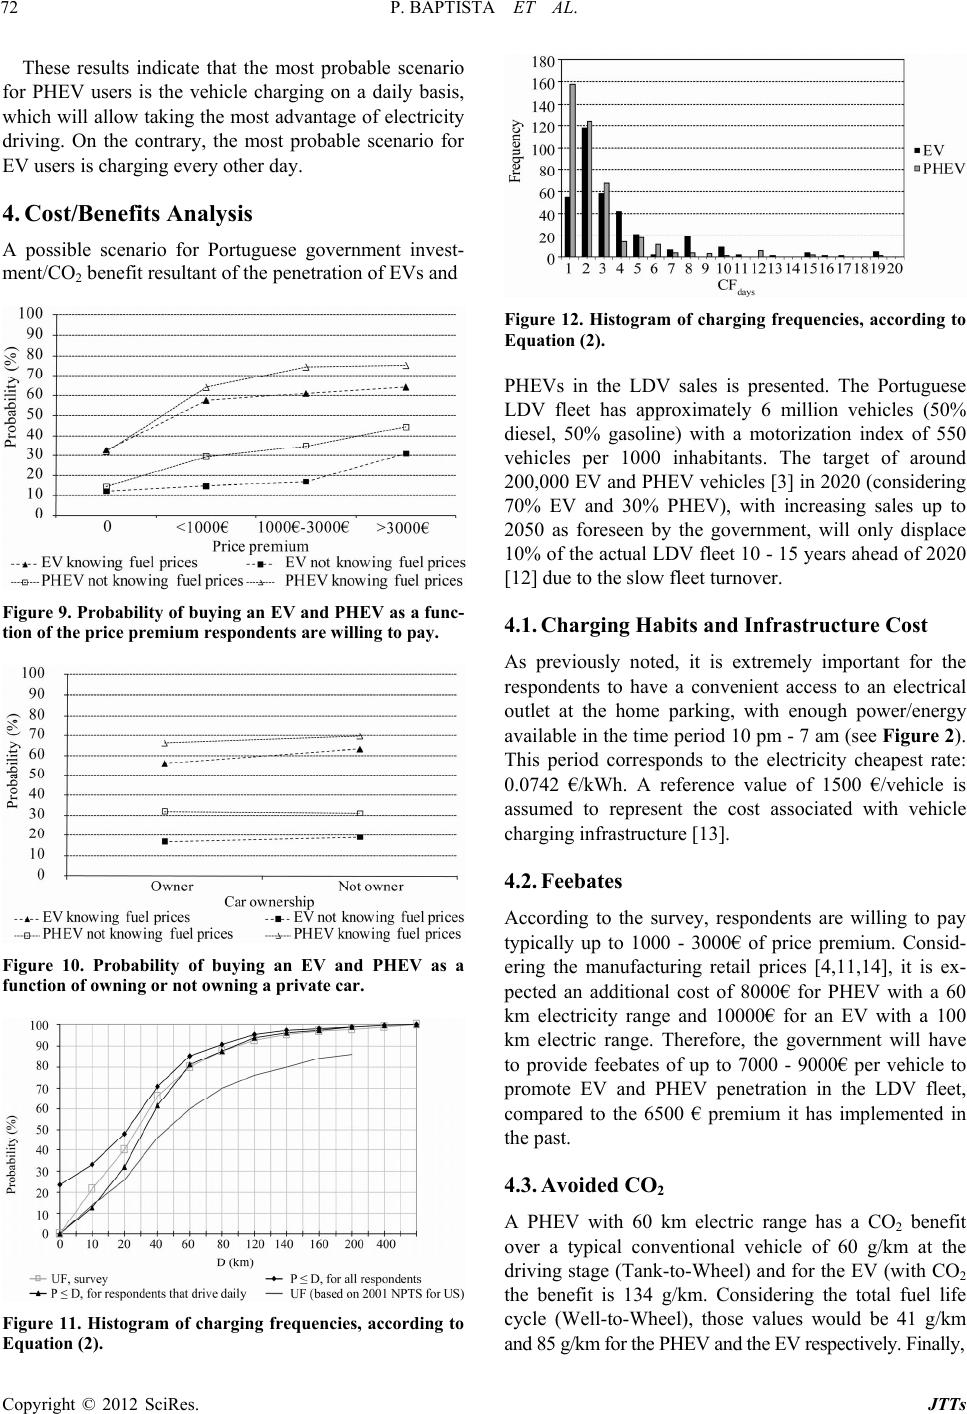 P. BAPTISTA ET AL. 72 These results indicate that the most probable scenario for PHEV users is the vehicle charging on a daily basis, which will allow taking the most advantage of electricity driving. On the contrary, the most probable scenario for EV users is charging every other day. 4. Cost/Benefits Analysis A possible scenario for Portuguese government invest- ment/CO2 benefit resultan t of the penetration of EVs and Figure 9. Probability of buying an EV and PHEV as a func- tion of the price premium respondents are willing to pay. Figure 10. Probability of buying an EV and PHEV as a function of owning or not owning a pr ivate car. Figure 11. Histogram of charging frequencies, according to Equation (2). Figure 12. Histogram of charging frequencies, according to Equation (2). PHEVs in the LDV sales is presented. The Portuguese LDV fleet has approximately 6 million vehicles (50% diesel, 50% gasoline) with a motorization index of 550 vehicles per 1000 inhabitants. The target of around 200,000 EV and PHEV vehicles [3] in 2020 (considering 70% EV and 30% PHEV), with increasing sales up to 2050 as foreseen by the government, will only displace 10% of the actual LDV fleet 10 - 15 years ahead of 2020 [12] due to the slow fleet turnover. 4.1. Charging Habits and Infrastructure Cost As previously noted, it is extremely important for the respondents to have a convenient access to an electrical outlet at the home parking, with enough power/energy available in the time period 10 pm - 7 am (see Figure 2). This period corresponds to the electricity cheapest rate: 0.0742 €/kWh. A reference value of 1500 €/vehicle is assumed to represent the cost associated with vehicle charging infrastructure [13]. 4.2. Feebates According to the survey, respondents are willing to pay typically up to 1000 - 3000€ of price premium. Consid- ering the manufacturing retail prices [4,11,14], it is ex- pected an additional cost of 8000€ for PHEV with a 60 km electricity range and 10000€ for an EV with a 100 km electric range. Therefore, the government will have to provide feebates of up to 7000 - 9000€ per vehicle to promote EV and PHEV penetration in the LDV fleet, compared to the 6500 € premium it has implemented in the past. 4.3. Avoided CO2 A PHEV with 60 km electric range has a CO2 benefit over a typical conventional vehicle of 60 g/km at the driving stage (Tank-to-Wheel) and for the EV (with CO2 the benefit is 134 g/km. Considering the total fuel life cycle (Well-to-Wheel), those values would be 41 g/km and 85 g/km for the PHEV and the EV respectively. Finally, Copyright © 2012 SciRes. JTTs 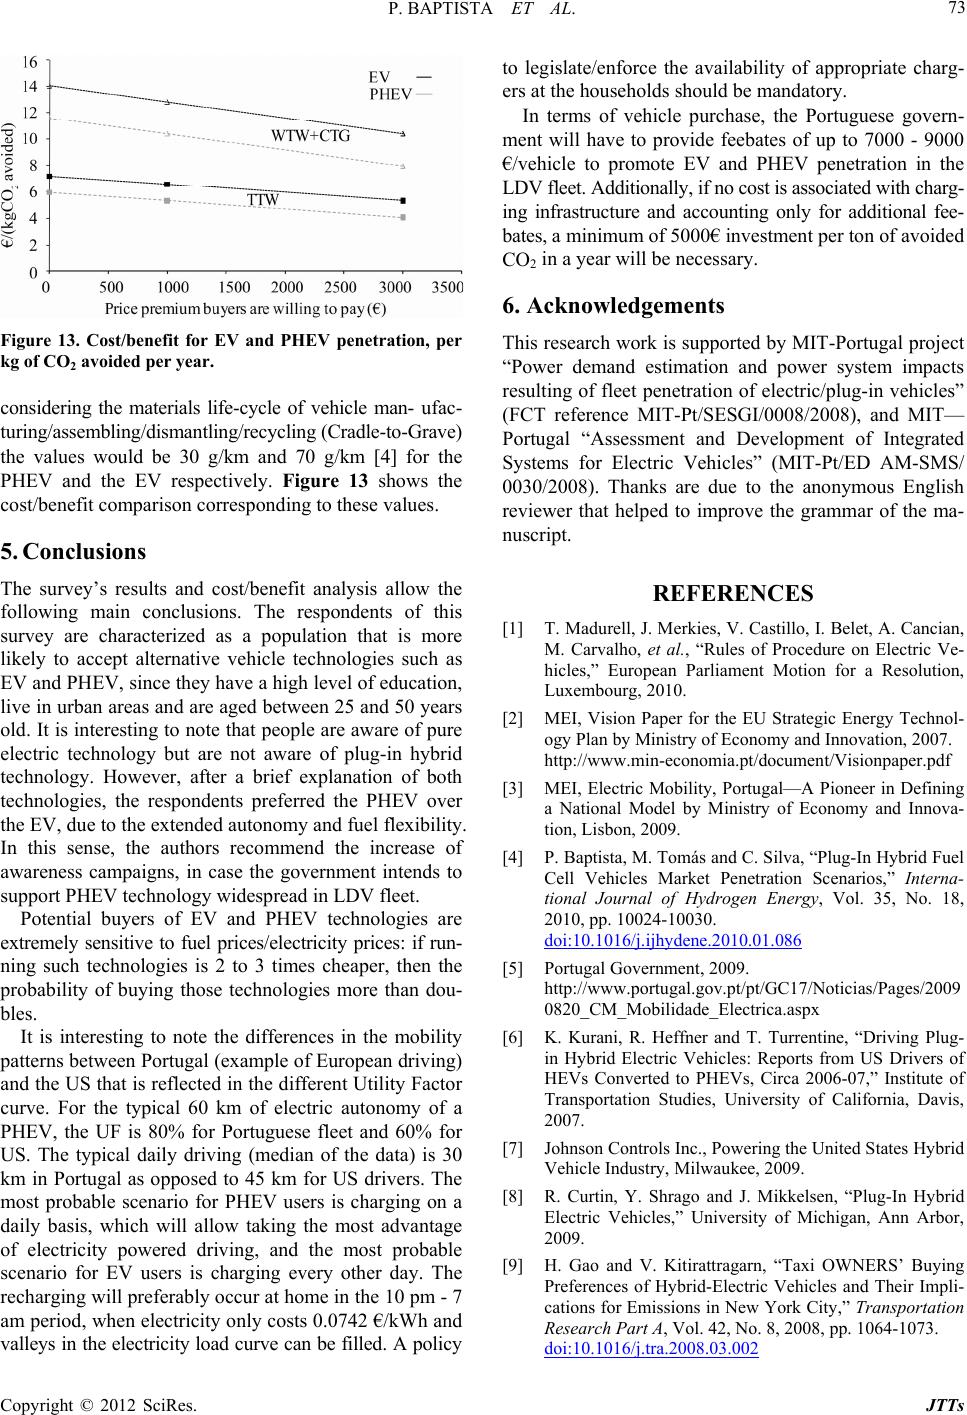 P. BAPTISTA ET AL. 73 Figure 13. Cost/benefit for EV and PHEV penetration, per kg of CO2 avoided per year. considering the materials life-cycle of vehicle man- ufac- turing/assembling/dismantling/recycling (Cradle-to-Grave) the values would be 30 g/km and 70 g/km [4] for the PHEV and the EV respectively. Figure 13 shows the cost/benefit comparison corresponding to these values. 5. Conclusions The survey’s results and cost/benefit analysis allow the following main conclusions. The respondents of this survey are characterized as a population that is more likely to accept alternative vehicle technologies such as EV and PHEV, since they have a high level of education, live in urban areas and are aged between 25 and 50 years old. It is interesting to note tha t people ar e aware of pure electric technology but are not aware of plug-in hybrid technology. However, after a brief explanation of both technologies, the respondents preferred the PHEV over the EV, due to the extended auton o my and fuel flexib ility. In this sense, the authors recommend the increase of awareness campaigns, in case the government intends to support PHEV technology widespread in LDV fleet. Potential buyers of EV and PHEV technologies are extremely sensitive to fuel prices/electricity prices: if run- ning such technologies is 2 to 3 times cheaper, then the probability of buying those technologies more than dou- bles. It is interesting to note the differences in the mobility patterns between Portugal (example of European driving) and the US that is reflected in the d ifferent Utility Factor curve. For the typical 60 km of electric autonomy of a PHEV, the UF is 80% for Portuguese fleet and 60% for US. The typical daily driving (median of the data) is 30 km in Portugal as opposed to 45 km for US drivers. The most probable scenario for PHEV users is charging on a daily basis, which will allow taking the most advantage of electricity powered driving, and the most probable scenario for EV users is charging every other day. The recharging will preferably occur at home in the 10 pm - 7 am period, when electricity o nly costs 0.0742 €/kWh an d valleys in the electricity lo ad curve can be filled. A policy to legislate/enforce the availability of appropriate charg- ers at the households should be mandatory. In terms of vehicle purchase, the Portuguese govern- ment will have to provide feebates of up to 7000 - 9000 €/vehicle to promote EV and PHEV penetration in the LDV fleet. Additi onally , if no cos t is associat ed wit h cha rg- ing infrastructure and accounting only for additional fee- bates, a minimum of 5000€ investment per ton of avoided CO2 in a year will be necessary. 6. Acknowledgements This research work is supported by MIT-Portugal project “Power demand estimation and power system impacts resulting of fleet p enetration of electric/plug-in vehicles” (FCT reference MIT-Pt/SESGI/0008/2008), and MIT— Portugal “Assessment and Development of Integrated Systems for Electric Vehicles” (MIT-Pt/ED AM-SMS/ 0030/2008). Thanks are due to the anonymous English reviewer that helped to improve the grammar of the ma- nuscript. REFERENCES [1] T. Madurell, J. Merkies, V. Castillo, I. Belet, A. Cancian, M. Carvalho, et al., “Rules of Procedure on Electric Ve- hicles,” European Parliament Motion for a Resolution, Luxembourg, 2010. [2] MEI, Vision Paper for the EU Strategic Energy Technol- ogy Plan by Ministry of Economy and Innovation, 2007. http://www.min-economia.pt/document/Visionpaper.pdf [3] MEI, Electric Mobility, Portugal—A Pioneer in Defining a National Model by Ministry of Economy and Innova- tion, Lisbon, 2009. [4] P. Baptista, M. Tomás and C. Silva, “Plug-In Hybrid Fuel Cell Vehicles Market Penetration Scenarios,” Interna- tional Journal of Hydrogen Energy, Vol. 35, No. 18, 2010, pp. 10024-10030. doi:10.1016/j.ijhydene.2010.01.086 [5] Portugal Government, 2009. http://www.portugal.gov.pt/pt/GC17/Noticias/Pages/2009 0820_CM_Mobilidade_Electrica.aspx [6] K. Kurani, R. Heffner and T. Turrentine, “Driving Plug- in Hybrid Electric Vehicles: Reports from US Drivers of HEVs Converted to PHEVs, Circa 2006-07,” Institute of Transportation Studies, University of California, Davis, 2007. [7] Johnson Controls Inc., Powering the United States Hybrid Vehicle Industry, Milwaukee, 2009. [8] R. Curtin, Y. Shrago and J. Mikkelsen, “Plug-In Hybrid Electric Vehicles,” University of Michigan, Ann Arbor, 2009. [9] H. Gao and V. Kitirattragarn, “Taxi OWNERS’ Buying Preferences of Hybrid-Electric Vehicles and Their Impli- cations for Emissions in New York City,” Transportation Research Part A, Vol. 42, No. 8, 2008, pp. 1064-1073. doi:10.1016/j.tra.2008.03.002 Copyright © 2012 SciRes. JTTs  P. BAPTISTA ET AL. Copyright © 2012 SciRes. JTTs 74 [10] A. Elgowainy, A. Burnham, M. Wang, J. Molburg and A. Rousseau, “Well-to-Wheels Energy Use and Greenhouse Gas Emissions Analysis of Plug-In Hybrid Electric Vehi- cles,” Center for Transportation Research, Austin, 2009. [11] C. Silva, M. Ross and T. Farias, “Evaluation of Energy Consumption, Emissions and Cost of Plug-In Hybrid Ve- hicles,” Energy Conversion and Management, Vol. 50, No. 7, 2009, pp. 1635-1643. doi:10.1016/j.enconman.2009.03.036 [12] P. Baptista, C. Silva and T. Farias, “Energy and CO2 Emissions Scenarios of Introducing New Vehicle Tech- nologies in the Portuguese Fleet,” International Advanced Mobility Forum, Geneve, 2010. [13] K. Morrowa, D. Karnerb and J. Francfortc, “Plug-In Hy- brid Electric Vehicle Charging Infrastructure Review,” EERE, US Department of Energy Vehicle Technologies Program—Advanced Vehicle Testing Activity, Washing- ton DC, 2008. [14] F. Nemry, G. Leduc and A. Muñoz, “Plug-In Hybrid and Battery-Electric Vehicles: State of the Research and De- velopment and Comparative Analysis of Energy and Cost Efficiency,” European Commission, Joint Research Cen- tre, Luxembourg, 2009. |