

Paper Menu >>
Journal Menu >>
 Geomaterials, 2012, 2, 10-18 http://dx.doi.org/10.4236/gm.2012.21002 Published Online January 2012 (http://www.SciRP.org/journal/gm) Calibration of Numerical Model Applied to a Shear Zone Located on a Slope in an Open Pit Mine—Case History Evandro Moraes da Gama, Bruno C. R. da Silva Department Mining Engineering, Federal University of Minas Gerais, Minas Gerais, Brazil Email: [email protected] Received October 14, 2011; revised November 28, 2011; accepted December 16, 2011 ABSTRACT The instability of a pit mine slope diagnostic caused by the slipping of a localized deep shear zone is described. The slope was designed on ultra basic, serpentine and metabasite rock formations with an angle varying from 40 to 45 de- grees. The perturbed slope zone was classified as RMR 12 and the non-perturbed zone as RMR 75. The boundary of these zones is defined as the shear zone. The pit slope was field mapped in detail and the mechanical properties of the rock were obtained through a laboratory test. The lab data were further processed using the RMR mechanical classifi- cation system. The Distinct Elements Code numerical modeling and simulation software was used to design the pit slope. The model was calibrated through topographic mapping of the points on the ground. The task of calibrating a numerical model is far from simple. Exhaustive attempts to find points of reference are required. The mechanical be- havior in function of the time factor is a problem that has yet to be solved. The instant deformation generated in the numerical model generated functions that can be compared with the deformations of quick shifts acquired in the topog- raphic monitoring. SMR is indeed more often recommended for Pit Slopes, though the fact that we have used RMR does not invalidate the classification for the modeling effect. The main parameters such as spacing, filling, diving direc- tion and continuity allow for compartmentalization of the modeled area. The objective of the modeling was not to pro- ject slopes because this massif was undergoing a progressive slow rupture. The objective of the modeling was to study the movement of the mass of rock and its progressive rupture caused by a shear zone. Keywords: Calibrated Modeling; Shear Zone; Slope and Stability 1. Introduction The term shear zone [SZ] generally refers to an area clo- se to where parallel boundary shear deformations are lo- cated. The shear zones are formed by the relative move- ment of blocks of non-deformed, brittle rocks located on opposite sides moving in opposite directions. The shear zone moves on a parallel plane between the blocks as a result of the movement of the blocks towards both sides. This plane is called the shear plane. The shear zones can be divided into ductile shear, ductile-brittle and fragile zones [1]. Sama Mineração de Amianto has two serpentinite pits which appear to overlap metabasites with little schisto- sity. The main structures for the stability of slopes are foliations; brittle-ductile shear in fault zones. Ductile-brit- tle shear and fault zones appear in profusion in the open pit forming a cross network .The shear zones have vari- able extensions reaching up to several tens of meters. Ma- ny of them show evidence of having moved more than on- ce. Tailings vary on a scale of decimeters. They can be broadly classified into three groups. The first group com- prises the areas of ductile shear formed under the mylo- nitic foliation for S1. These areas have a flat curve shape, in order to circumvent almond lentiform bodies of deform- ed serpentinites, Figure 1. The second group consists of fragile and ductile zones and resembles a type of oblique fault inclined either to the right or to the left. Those groups are discordant from S1 and are related to the serpentinites with the most sig- nificant mineralization. The stability of slopes is cons- trained mainly by the ductile shear zones, which are di- vided into lenses, which separate the lenses of decametric Figure 1. Profile diagram showing the anastomosed shear zones isolating blocks in the form of almonds [2]. C opyright © 2012 SciRes. GM 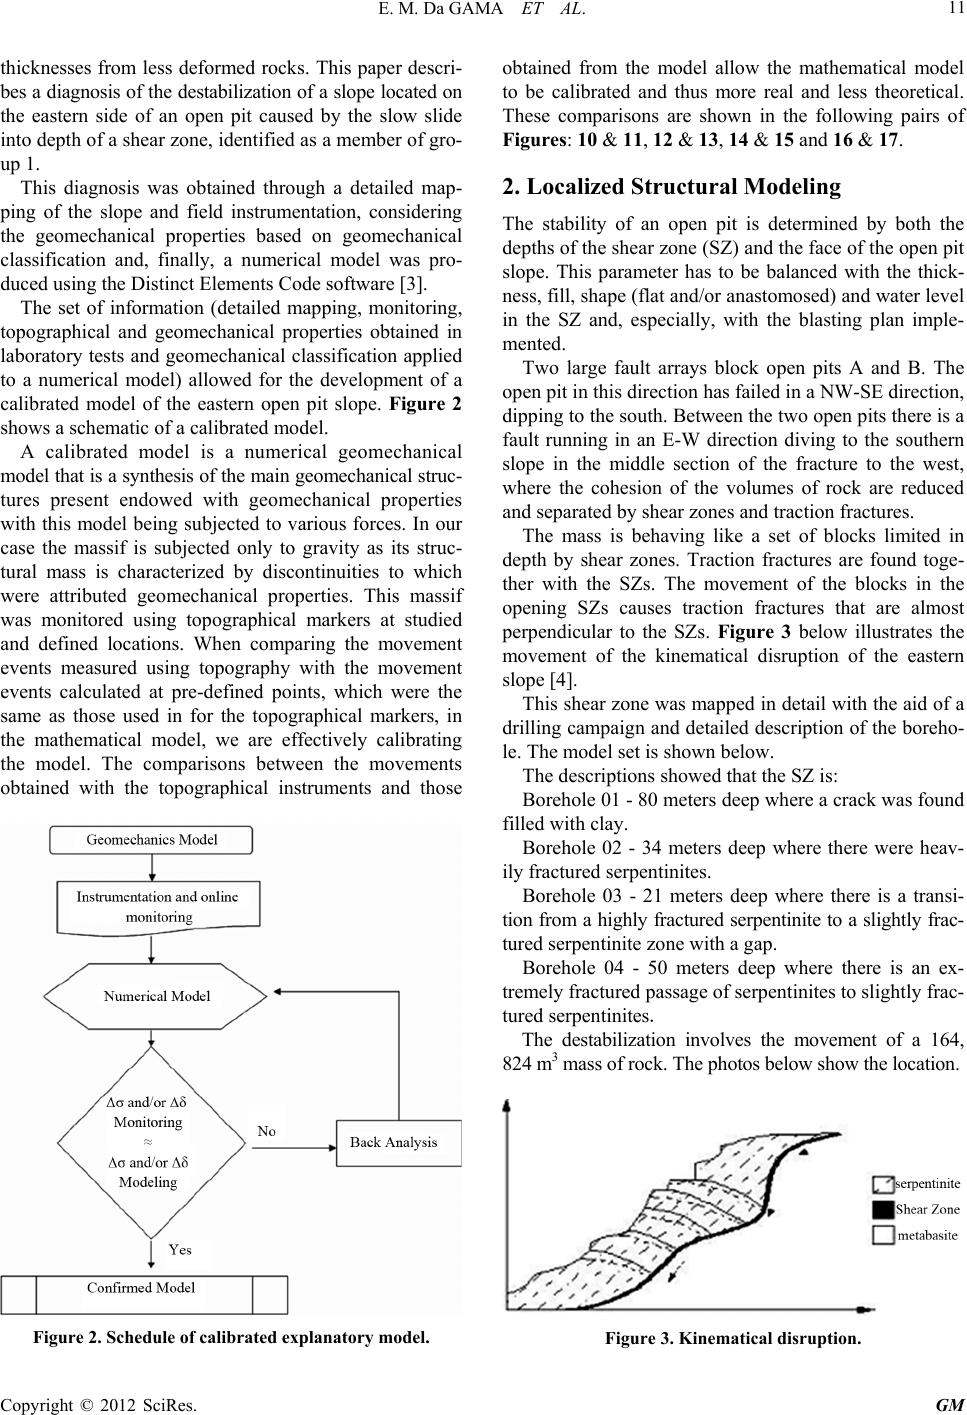 E. M. Da GAMA ET AL. 11 thicknesses from less deformed rocks. This paper descri- bes a diagnosis of the destabilization of a slope located on the eastern side of an open pit caused by the slow slide into depth of a shear zone, identified as a member of gro- up 1. This diagnosis was obtained through a detailed map- ping of the slope and field instrumentation, considering the geomechanical properties based on geomechanical classification and, finally, a numerical model was pro- duced using the Distinct Elements Code software [3]. The set of information (detailed mapping, monitoring, topographical and geomechanical properties obtained in laboratory tests and geomechanical classification applied to a numerical model) allowed for the development of a calibrated model of the eastern open pit slope. Figure 2 shows a schematic of a calibrated model. A calibrated model is a numerical geomechanical model that is a synthesis of the main geomechanical struc- tures present endowed with geomechanical properties with this model being subjected to various forces. In our case the massif is subjected only to gravity as its struc- tural mass is characterized by discontinuities to which were attributed geomechanical properties. This massif was monitored using topographical markers at studied and defined locations. When comparing the movement events measured using topography with the movement events calculated at pre-defined points, which were the same as those used in for the topographical markers, in the mathematical model, we are effectively calibrating the model. The comparisons between the movements obtained with the topographical instruments and those Figure 2. Schedule of calibrated explanatory model. obtained from the model allow the mathematical model to be calibrated and thus more real and less theoretical. These comparisons are shown in the following pairs of Figures: 10 & 11, 12 & 13, 14 & 15 and 16 & 17. 2. Localized Structural Modeling The stability of an open pit is determined by both the depths of the shear zone (SZ) and the face of the open pit slope. This parameter has to be balanced with the thick- ness, fill, shape (flat and/or anastomosed) and water level in the SZ and, especially, with the blasting plan imple- mented. Two large fault arrays block open pits A and B. The open pit in this direction has failed in a NW-SE direction, dipping to the south. Between the two open pits there is a fault running in an E-W direction diving to the southern slope in the middle section of the fracture to the west, where the cohesion of the volumes of rock are reduced and separated by shear zones and traction fractures. The mass is behaving like a set of blocks limited in depth by shear zones. Traction fractures are found toge- ther with the SZs. The movement of the blocks in the opening SZs causes traction fractures that are almost perpendicular to the SZs. Figure 3 below illustrates the movement of the kinematical disruption of the eastern slope [4]. This shear zone was mapped in detail with the aid of a drilling campaign and detailed description of the boreho- le. The model set is shown below. The descriptions showed that the SZ is: Borehole 01 - 80 meters deep where a crack was found filled with clay. Borehole 02 - 34 meters deep where there were heav- ily fractured serpentinites. Borehole 03 - 21 meters deep where there is a transi- tion from a highly fractured serpentinite to a slightly frac- tured serpentinite zone with a gap. Borehole 04 - 50 meters deep where there is an ex- tremely fractured passage of serpentinites to slightly frac- tured serpentinites. The destabilization involves the movement of a 164, 824 m3 mass of rock. The photos below show the location. Figure 3. Kinematical disruption. Copyright © 2012 SciRes. GM 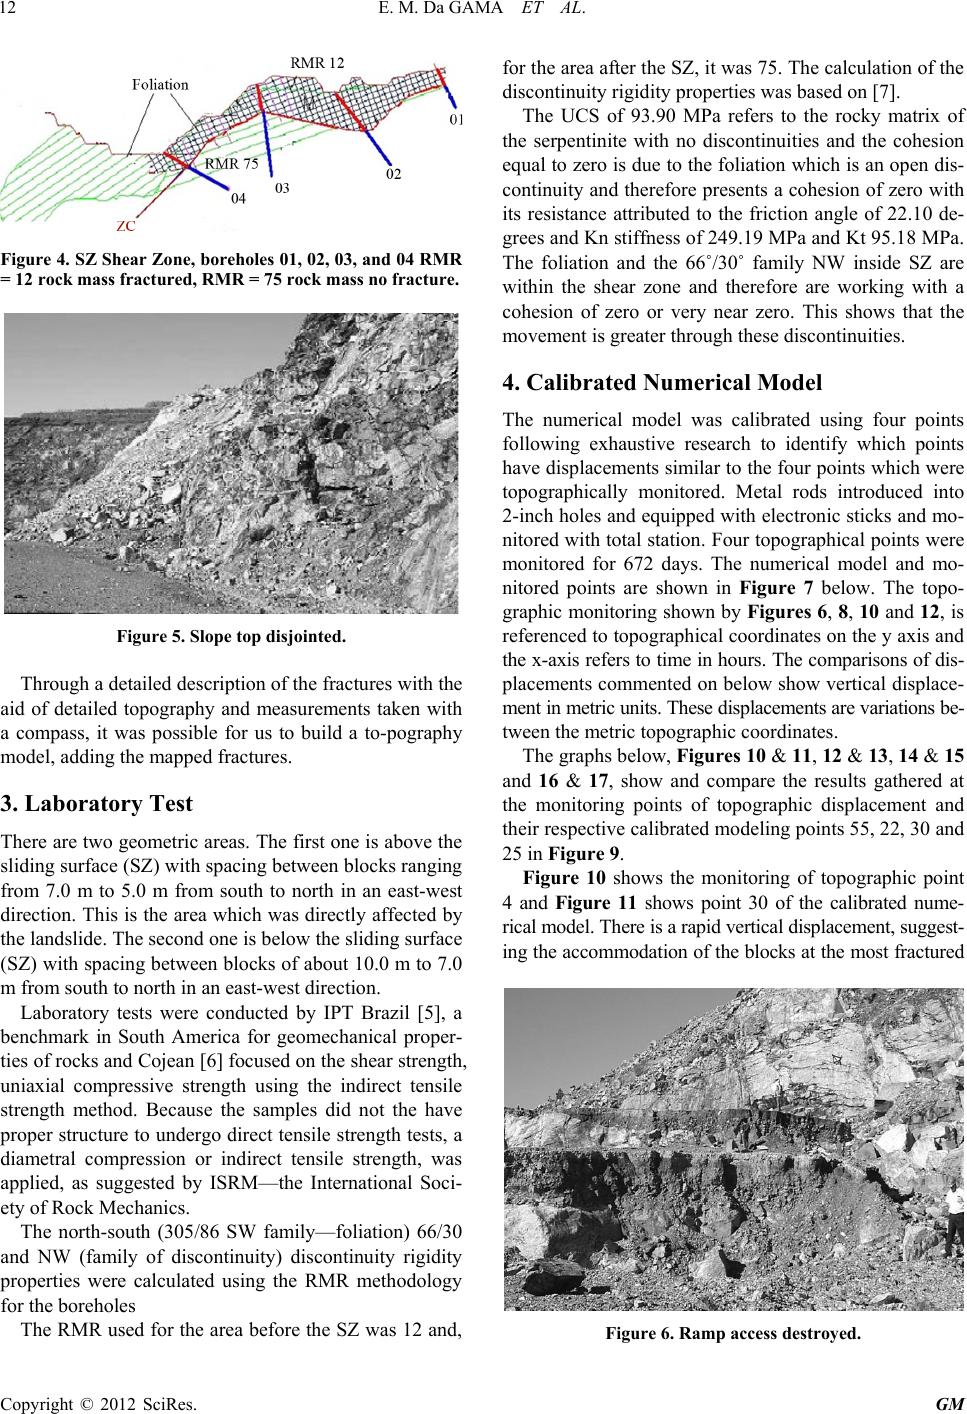 E. M. Da GAMA ET AL. 12 Figure 4. SZ Shear Zone, boreholes 01, 02, 03, and 04 RMR = 12 rock mass fractured, RMR = 75 rock mass no fracture. Figure 5. Slope top disjointed. Through a detailed description of the fractures with the aid of detailed topography and measurements taken with a compass, it was possible for us to build a to-pography model, adding the mapped fractures. 3. Laboratory Test There are two geometric areas. The first one is above the sliding surface (SZ) with spacing between blocks ranging from 7.0 m to 5.0 m from south to north in an east-west direction. This is the area which was directly affected by the landslide. The second one is below the sliding surface (SZ) with spacing between blocks of about 10.0 m to 7.0 m from south to north in an east-west direction. Laboratory tests were conducted by IPT Brazil [5], a benchmark in South America for geomechanical proper- ties of rocks and Cojean [6] focused on the shear strength, uniaxial compressive strength using the indirect tensile strength method. Because the samples did not the have proper structure to undergo direct tensile strength tests, a diametral compression or indirect tensile strength, was applied, as suggested by ISRM—the International Soci- ety of Rock Mechanics. The north-south (305/86 SW family—foliation) 66/30 and NW (family of discontinuity) discontinuity rigidity properties were calculated using the RMR methodology for the boreholes The RMR used for the area before the SZ was 12 and, for the area after the SZ, it was 75. The calculation of the discontinuity rigidity properties was based on [7]. The UCS of 93.90 MPa refers to the rocky matrix of the serpentinite with no discontinuities and the cohesion equal to zero is due to the foliation which is an open dis- continuity and therefore presents a cohesion of zero with its resistance attributed to the friction angle of 22.10 de- grees and Kn stiffness of 249.19 MPa and Kt 95.18 MPa. The foliation and the 66˚/30 ˚ family NW inside SZ are within the shear zone and therefore are working with a cohesion of zero or very near zero. This shows that the movement is greater through these discontinuities. 4. Calibrated Numerical Model The numerical model was calibrated using four points following exhaustive research to identify which points have displacements similar to the four points which were topographically monitored. Metal rods introduced into 2-inch holes and equipped with electronic sticks and mo- nitored with total station. Four topographical points were monitored for 672 days. The numerical model and mo- nitored points are shown in Figure 7 below. The topo- graphic monitoring shown by Figures 6, 8, 10 and 12, is referenced to topographical coordinates on the y axis and the x-axis refers to time in hours. The comparisons of dis- placements commented on below show vertical displace- ment in metric units. These displacements are variations be- tween the metric topographic coordinates. The graphs below, Figures 10 & 11, 12 & 13, 14 & 15 and 16 & 17, show and compare the results gathered at the monitoring points of topographic displacement and their respective calibrated modeling points 55, 22, 30 and 25 in Figure 9. Figure 10 shows the monitoring of topographic point 4 and Figure 11 shows point 30 of the calibrated nume- rical model. There is a rapid vertical displacement, suggest- ing the accommodation of the blocks at the most fractured Figure 6. Ramp access destroyed. Copyright © 2012 SciRes. GM 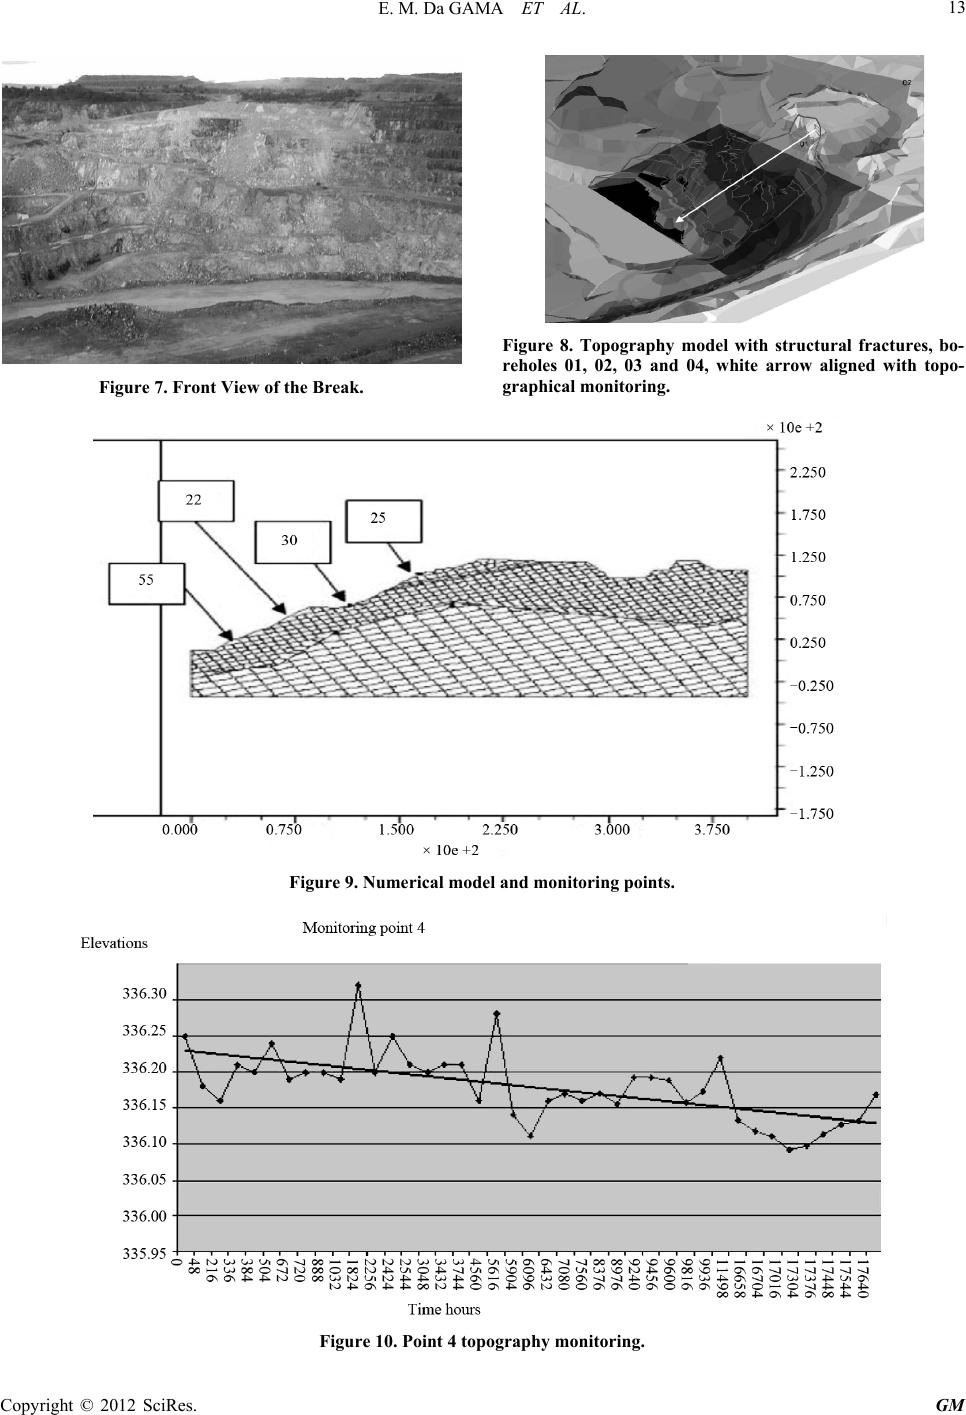 E. M. Da GAMA ET AL. GM 13 Figure 8. Topography model with structural fractures, bo- reholes 01, 02, 03 and 04, white arrow aligned with topo- graphical monitoring. Figure 7. Front View of the Break. Figure 9. Numerical model and monitori ng points. Figure 10. Point 4 topography monitoring. Copyright © 2012 SciRes.  E. M. Da GAMA ET AL. 14 Figure 11. Point 30 calibrated modeling. zone of the ramp, which were the largest blocks. The order of magnitude of the vertical displacements ranged from 0.13 to 0.32 m. We observed the same trend in the accommodation blocks with a vertical variation of between 0.1 and 0.8 m. The numerical model was not able to show a temporal variation as the topographic monitoring was. We did no- tice, however, that the extent to which the 0 to 3 UDEC cycles are applied determines the vertical displacement decrease. Figure 12 shows the monitoring of the topographic point and Figure 13 shows point 25 of the calibrated nu- merical model. Section 1, which is monitored via topo- graphy, shows a maximum displacement of 1.40 m be- tween 0 and 5616 hours. At two peaks, displacements at 1834 hours and 5616 hours were observed. The dis- placements and absolute magnitude are located between 0.30 and 0.80 m. These shifts are associated with accom- modation blocks. After 16,704 hours, shifts are on the order of 0.25 m with a tendency to remain constant for some time. The point 25 of the calibrated model shows two points of maximum displacement of 0.30 m and 0.15 m. After being stabilized at 0.25 m, we kept it this way until the blocks had been stabilized. Figure 14 shows the topographic monitoring of sec- tion 2 and Figure 15 shows the corresponding point in the numerical model. Between 0 and 1032 hours there is a maximum dis- placement of 1.1 m. At the 1032nd hour we have a peak displacement of 1 meter. After this peak, shifts tend to stay at a constant topographic level (325), and show a second set of displacements at elevation 324.5. Figure 11 shows point 35 of the calibrated model where we have the same trend. There is a rapid increase in deformation to 0.18 m. Then we have variations of displacement close to 0.18 m. Finally, the model stabilizes at 0.175 m. This point does not show an order of magnitude for displacement similar to the topography and neither do monitoring points 25 and 30. Figure 14 corresponds to the third point of topo- graphical tracking and Figure 15 shows the correspond- ing point in the calibrated model. Figure 16 shows a progressive shift from 1 to 2 meters over a 426-hour interval, stabilizing at topographic eleva- tion 332. From this point we have a gradual stabilization, pos- sibly temporary, with a maximum displacement of 0.5 m. Figure 12. Point 1 topography monitoring. Copyright © 2012 SciRes. GM  E. M. Da GAMA ET AL. 15 Figure 13. Point 25 calibrated modeling. Figure 17 corresponds to the numerical model and sho- ws the same trend. There is a quick shift to 0.09 m after a gradual stabilization near 0.085 m. But this point does not show an order of magnitude for displacements simi- lar to the displacements obtained through the topographic monitoring. 5. Discussion The curves for the displacements obtained through the mo- nitoring show topographic features very similar to the displacement curves obtained in the numerical model. Paragraphs 30 and 25 of the numerical model show an order of magnitude for the displacements that is com- patible with the numerical model. However, points 55 and 22 do not present an order of magnitude for the dis- placements that is compatible with the topographic monitoring. The topographically monitored points are spaced 100 meters apart. The blocks are disconnected, and their fric- tion coefficient is the only stabilizing factor. The more density there is the greater are the friction and the safety. Thus, the orders of magnitude for the displacements of points 55 and 22, which were similar to those topogra- phic monitoring points, should have been on blocks that were separated or not engaged in the model. But it is not an easy task to consider all the blocks and choose those with mechanical behavior compatible with the real mag- nitudes of the displacements, obtained from topographic monitoring. However the interpretation of physical and mechanical stability is maintained because the curves show displace- ment functions very similar and comparable to those ob- tained in the topographic monitoring. The movements are typical of disconnected blocks where small deformations accumulate over long periods and suffer large deformations faster than usual. The fas- test movements were caused by the dismantling with ex- plosives of the front slope in the studied area. It was observed that the size of the displacement of Figures 6-8 ranges from 0.15 to 0.30 m. Point 4 is in the highest elevation of the ramp followed by monitoring points 1, 2 and 3. There is a clear trend towards an incre- ase in the vertical displacement over time. Figure 14. Point 2 topography monitoring. Copyright © 2012 SciRes. GM  E. M. Da GAMA ET AL. 16 Figure 15. Point 55 calibrated modeling. The Topography monitoring used did not allow for a continuous evaluation of the data with shorter time in- tervals. On the other hand, kn (Normal Joint stiffness) and kt (Joint shear stiffness) applied to the model, can impose minor displacements between the blocks. All these factors make the numerical calibration of the model more difficult [4]. The numerical modeling was performed using the UDEC: Universal Distinct Element Code software, ver- sion 3.0 Itasca Consulting [8]. 5.1. Input Data and Assumptions in the Model The model was based on the size of the blocks in Figure 4. The results of the field mapping were used for the biggest blocks which have dimensions (in meters) of 6.20 × 4.50 × 5.20 × 2.30 and 4.60 × 2.80. The input parame- ters for a numeric geomechanical model are the me- chanical properties shown in Table 1 and the discon- tinueties mapped in the field. As a synthesis of a struc- tural model, the model presented may appear simple. However, the complexity of this model lies in the fact that there is a numerical convergence of the results. 5.2. Results In Figure 18 the dark lines show the model simulation of the slip surfaces of slope, which are within the friction limits, or that is those that are collapsing. They indicate that the SZ, represented by the thick, dark line is found in the process of collapsing. The same occurs at several points of the 66/30 NW foliation family, which are also in process of free shear. Figure 19 shows that, through the simulation model, maximum displacements of 4.41 × 10⁻² m were found, which are represented by the regions highlighted by the thick, dark lines. At such discontinuity points, the dis- placement opens and continues moving. Figure 16. Point 3 topography monitoring. Copyright © 2012 SciRes. GM  E. M. Da GAMA ET AL. 17 Table 1. Results of mechanical laboratory tests. Lythotypes C Mpa Φ grade σc Mpa σt Mpa γ t/m3 G Mpa K Mpa Kn Mpa Kt Mpa Serpentinite Matrix 1.10 44.90 93.90 11.07 2.63 17521.00 37963.00 Foliation inside SZ 0.00 22.10 249.18 95.81 66˚/30˚ Family NW inside SZ 0.09 29.60 249.18 95.81 Foliation after SZ 0.26 26.90 4047.82 1553.60 66˚/30˚ Family NW after SZ 0.97 58.50 4047.82 1553.60 C: cohesion, θ: friction angle, σc: Uniaxial Compression , σt: Indirect Tension, γ: density, G: Shear modulus, kn: Normal Joint stiffness, kt: Joint shear stiffness. Figure 17. Point 22 calibrated modeling. Figure 18. Joint now at shear limit shown in darker lines. 6. Conclusions The destabilization of a shear zone, shown in this paper, is a slow and continuous process. Topographic monitoring, especially from point 04 when compared to the 30th point shows a weak relation- ship with the displacement of the surface of the tracked slope and a small similarity to the numerical model de- veloped. Factors contributing to this destabilization are closely linked to the angles of the slope used in the plowing op- erations and placement of embankments with a geometric relationship to the fault and SZ located near the face of the dismantled slope. This analysis shows the need for a detailed map of the structural stability of the open pit in operation. The task of calibrating a numerical model is far from simple. Exhaustive attempts to find points of reference are required. The time factor is a problem that has yet to be solved, but, for now, the deformation generated in the Figure 19. Shear displacement show n in dar ker lines. Copyright © 2012 SciRes. GM  E. M. Da GAMA ET AL. 18 numerical model generated functions that can be com- pared with the deformations with quick shifts acquired through topographic monitoring. The topography does not allow for the tracking of a continuous data record. With a continuous record of, for example, one measurement per minute, perhaps we’d have a better calibration of the model [9]. REFERENCES [1] J. G. Ramsay, “Shear Zone Geometry a Review,” Journal of Structural Geology, Vol. 2, No. 1-2, 1980, pp. 83-89. doi:10.1016/0191-8141(80)90038-3 [2] Y. Hasuo, F. S. Magalhaes and A. F. Mangolin, “Applied Structural Geology,” 1992, pp. 363-382. [3] P. A. Cundall, “Numerical Modeling of Jointed and Faulted Rock in Mechanics of Jointed and Faulted Rock,” A. A. Balkema, Rotterdam, 1990, pp 11-18. [4] E. Gama and L. Borrher, “Efeito de uma zona de cisalhamento na estabilidade de um talude de mineração”. In: IV Congresso Brasileiro de mina á ceu aberto e mina subterranea, Belo Horizonte. MG Brasil, 2006. [5] IPT, “Relatório de Ensaios,” Instituto de Pesquisas Tecnologicas, Sama Mineração, 1996. [6] R. Cojean and S. Curtil, “Rapport d’Avancement des travaux de Thése,” ARMINES Centre de Geologie de L’Ingenieur, Paris, 1995. [7] P. A. Cundall and R. D. Hart. “Development of General- ized 2-D and 3-D Distinct Element Modeling Programs for Jointed Rock,” Itasca Consulting Group, US Army Corps of Engineers, Itasca Consulting Group, 1985. [8] D. Billaux, F. Dedecker and P. Cundall, “A Novel Ap- proach to Studying Rock Damage: The Three Dimen- sional Adaptive Continuum/Discontinuum Code,” Pro- ceedings of EUROCK 2004 & 53rd Geomechanics Col- loquium, Ed. Schubert, 2004, pp. 723-728. [9] E. M. Gama. “Rock Mechanics Applied to Mining,”. EEUFMG, Vol. 1, 2005. Copyright © 2012 SciRes. GM |