

Paper Menu >>
Journal Menu >>
 American Journal of Plant Sciences, 2011, 2, 816-822 doi :1 0.4236/ aj ps.2011 .26096 Publ i s hed Online December 2011 (http://www.SciRP.org/journal/ajps) Copyright © 2011 SciRes. AJPS Secondary Structure Changes and Thermal Stability of Plasma Membrane Proteins of Wheat Roots in Heat Stress Xin Zhao1, Yong Shi1, Li Chen2, Fenlin Sheng3, Haiyan Zhou1 1Laboratory of Plant Stress Ecophysiology and Biotechnology, Cold and Arid Regions Environmental and Engineering Research Institute, Chinese Academy of Sciences, Lanzhou, China; 2College of Life Science and Engineering, The Northwest University for Nationalities, Lanzhou, China; 3Instrumental Analysis and Research Center, Lanzhou University, Lanzhou, China. Email: [email protected] Received July 21st, 2011; r e vised August 20th, 2011; accepted September 6th, 2011. ABSTRACT The wheat roots membrane separates the cell from the environment around it and encloses the cell contents. The pro- tein secondary structure and thermal stability of the plasma membrane of wheat root have been characterized in D2O buffer from 20˚C to 90˚C by Attenuated total reflection Fourier transform infrared spectroscopy (ATR-FTIR). Quantita- tive analysis of the amide I band (1700 - 1600 cm–1) showed that the plasma membrane proteins contains 41% α-helix, 16% β-sheet, 18% turn, and 25% disorder structures at 20˚C. At elevated temperatures from 25˚C up to 90˚C, the α-helix and the β-sheet structure unfold into turns and the disorder structure, with a major conformational transition occurring at 50˚C. There is a rapid decline in H+-ATPase activity of plasma membrane from 35˚C to 55˚C and it re- main very low level H+-ATPase activity of PM from 55˚C to 90˚C. Therefore the protein conformational transition was one of reasons of loses H+-ATPase activity of plasma membrane. Keywords: Plasma Membrane, Heat Stress, Protein Second Structure, ATR-FTIR 1. Introduction The plant plasma membrane (PM) separates the cell from the environment around it and encloses the cell contents. It has four important functions: it acts as a semi-perme- able barrier, it regulates transport in and out of the cell; and it provides communication and adhesion. It is the first line of cell defense against the stress from the out- side environment and against harmful free radicals. The heat sensitivity of the PM has both practical and theoretical significance. The study of the heat denatura- tion process can provide an insight into the structural organization and individual roles of proteins in general. More specifically, heat can induce functional change in the plant PM [1]. A review by Arrondo [2] descripted the applications of IR spectroscopy to the study of mem- brane proteins. Shi [3] reported a study on FT-IR of the secondary structure and conformational changes of a pho- tosystem II (PS II) membrane and core complex during heat denaturation. The core of the PS II denatured from 55˚C to 65˚C with transitions of the secondary structure from co-helix and t urns to β-sheet and random coils. The denaturation of light-harvesting chlorophyll protein (LHCP) began at 65˚C and was characterized by a rapid increase of the turns. However, the above studies were restricted by a lack of information on the conformational changes of proteins during heat denaturation; such information is necessary for an understanding of the mechanism of the heat inactivation of the PM. Attenuated total reflection Fourier transform infrared spectroscopy (ATR-FTIR) is one of the most powerful tools for recording infrared spectra of biological materi- als in general, and for biological membranes in particular. It has fast speed, yields a strong signal with only a few micrograms of sample, and most importantly it allows in- formation about the orientation of various parts of the molecule under study to be evaluated in an oriented sys- tem. The environment of the molecules can be modulated so that their conformation can be studied as a function of temperature, pressure and pH, as well as in the presence of species ligands. Because of the long IR wavelength, light scattering problems are virtually non-existent and highly aggregated materials or large membrane fragments can be investigated. A unique advantage of infrared spec-  Secondary Structure Changes and Thermal Stability of Plasma Membrane Proteins of Wheat Roots in Heat Stress 817 troscopy is that it allows simultaneous study of the stru- cture of lipids and proteins in intact biological mem- branes without introduction of foreign perturbing probes [4]. Some types of analysis of infrared data are claimed to provide highly accurate quantitative estimates of the content of secondary structures, with a standard devia- tion as low as 2% - 3% with respect to the corresponding X-ray structures. The advantage of FTIR is that protein secondary structure is measured in the native environ- ment of the proteins and that it is a noninvasive tech- nique. FTIR spectroscopy is a unique possibility for the simultaneous study of protein and lipid structures and dynamics in biological membranes [5,6]. Differences in the C-O stretching vibrations of the peptide groups (the amide-I region between 1600 - 1700 cm–1) provide in- formation on the type of secondary structure, such as α-helix, β-strands, disorder and different kinds of turn structures [7]. The processes controlling plant gro wth and survival in a hostile environment might be clarified at molecular and cellular level. Therefore, we examine the effect of heat inactivation on the activity of PM H+-ATPase and the PM protein, and investigate the changes in the protein secondary structure of PM in response to high tempera- tures by FTIR. 2. Material and Methods 2.1. Plan t Ma teria ls Wheat seeds (Triticum aestivum var. Longchun No. 20, purchased from Gansu Agriculture Sciences Academy, China) were sterilized in 1% sodium hypochlorite (Na- ClO) solution for 20 min, then soaked in water for 24 h and germinated in the dark at 25˚C for 24 h., The seed- lings were gro wn for 10 days at 19˚C in quartz sa nd and irrigated with tap-water. They were illuminated for 14 h each day with a light intensity of 100 µmol m–2·s–1. Since the root plasma membrane is the site of absorption vari- ous nutrition, we harvested the purification of plasma membrane from wheat roots. 2.2. Wheat Roo ts Pla sma Mem brane Is olatio n and Purification Wheat roots plasma membrane was prepared by two- phase partition [8]. Roots were cut into pieces and imme- diately homogenized in the isolation medium containing 50 mM HEPES-tris, pH 7.5, 250 mM sucrose, 1 mM EDTA, 0.6% PVP, 1 mM PMSF, and 1 mM DTT at 4˚C. The homogenate was filtered through four layers of cot- ton gauze and centrifuged (Beckman AJ-250) at 15,000 g for 15 min. The supernatant was then centrifuged (Beck- man AJ-250) at 80,000 g for 60 min in order to obtain a microsomal pellet, which was resuspended in a buffer containing 0.048% potassium phosphate (pH 7.8). The suspension was then added to a phase mixture to obtain a phase system consisting of 0.048% potassium phosphate (pH 7.8), 6.2% PEG-3350, 6.2% dextran T- 500, 0.015% KCl, and 250 mM sucrose. After it was centrifuged at 1000 g for 5 min for three times, the final upper phases were collected, diluted at least twice with 50 mM HEPES-tris, pH 7.4, 250 mM sucrose, 1 mM EDTA, 1 mM DTT, and 1 mM PMSF, and centrifuged for 60 min at 80,000 g. The resulting pellet was resus- pended in 50 mM Tris-HCl pH 7.4, 250 mM sucrose, 1 mM EDTA, 1 mM DTT , and 1 mM PMSF. All the above steps were carried out at 4˚C. Plasma membrane pellets were used immediately to obtain ATR-FTIR spectral. 2.3. PM H e at Trea tment Polarized attenuated total internal reflection infrared spe- ctroscopy is one of the best tools available for obtaining information on the orientation of peptides interacting with membranes. The method is simple (oriented multi- layer systems are easily obtained by drying a membrane suspension on the internal reflection element). It is sensi- tive (less than 1 mg of peptide is required to form a sin- gle monolayer) and it does not require specific labeling. To remove the spectral interference from H2O absorption bands (OH- bond strongly absorbed on amide I 1600 - 1700 cm–1), the PM samples were dissolved in an identi- cal concentration but D2O-based buffer. Heat inactivation was performed by incubating a puri- fied PM sample on a CaF2 plate in a temperature bath (Yamato-Komatsu Coolnics circulator CTE-24A) in steps of 5˚C from 20˚C to 90˚C. After every heating step, the PM sa mple was left to stab ilize for 5 min and then i m me- diately subjected to ATR-FTIR measurement, and then increased temperature in the step 5˚C. The spectrum was obtained on an OMNI sampler of a Fourier Transform Infrared spectrometer (Nexus 670; Nicolet, Madison, WI) with germanium plane in a 2 mm2 sensing area. Attenuated total reflection infrared (ATR- FTIR) spectra were recorded on an OMNIC sampling in- strument. The internal reflection element was a germa- nium ATR plate (50 × 20 × 2 mm) with an aperture angle of 45˚. In total, 128 scans were accumulated for each spectrum. Spectra were recorded at a nominal resolution of 2 cm–1. 2.4. Assay of H+-ATPase A cti v it y Heat inactivation was performed by incubating a purified PM sa mple in tubes that p uted in Dri-Block Heater (DB - 2D Digital, United Kindom) in steps of 5˚C from 20˚C to 90˚C (three repeats). After every heating step, the PM sample was left to stabilize for 5 min and then measure its H+-ATPase activity as same treatment as the method in 2.3. ATP hydrolysis assays were performed as de- Copyright © 2011 SciRes. AJPS  Secondary Structure Changes and Thermal Stability of Plasma Membrane Proteins of Wheat Roots in Heat Stress 818 scribed by Ohinishi [9]. Membrane proteins (10 - 15 µg) were added to 0.5 ml of reaction medium containing 25 mM HEPES-Tris (pH 6.5), 3 mM ATP, 50 mM KCl, 1 mM Na3MoO4, and 0.015% (w/v) Triton X-100, in the presence or absence of 400 µM Na3VO4. After 30 min incubation at 37˚C, the reaction was quenched by the addition of 10% (w/v) TCA. The H+-ATPase activity was determined by measuring the release of Pi [9]. Pro- tein in the plasma membranes was measured by the me- thod of Bradford [10] with bovine serum albumin as the standard. 2.5. FTIR Spectral Data Analysis The IR Data Manager analytical software of OMNIC (Version 6.0; Nicolet, USA) was used to obtain original and Fourier self-deconvolution spectra and second-deri- vati ve spec t ra. The parameters for the Fourier self-deconvolution pro- cedure were a smooth factor of 15.0 and a width factor of 10.0 cm–l, using the interactive OMNIC 6.0 tool for Fou- rier self-deconvolution. The line width in the deconvo- lved spectrum was chosen carefully to avoid introduction of erroneous bands [11]. The second-derivative spectrum was normalized, and the band position was calculated as the average of the spectral positions at 80% of the total peak height. They were smoothed over 15 data points. The water spectra to be subtracted were collected un- der the same conditions as the membrane spectra. Crite- ria for the correctness of subtraction were removal of the band near 2200 cm–1 and flat baseline between 1800 and 2000 cm–1 for samples in H2O and elimination of the strong band at 1209 cm–1 for samples in D2O, avoiding negative side lobes. Second-derivative and deconvolu- tion spectra were used to determine the number and the positions of the bands as starting parameters for the curve- fitting procedure, assuming Pearson or Voigt band shapes. The band-fitting used Origin 7.0 software with an ap- pended PFM (Peak Fitting Maximum) function and for protein studies the spectral region between 1800 and 1500 cm–1 was selected. This region contains the amide I and amide II absorption bands of the protein backbones. Band curve-fitting includes the decomposition of the amide I band into its constituents and the assignment of these components to protein structural features. To start the quantification process, the number and position of the bands and a rough estimation of band shapes, widths and heights of the components is needed. The Gaussian peak shape was used to fit the spectrum collected at each time point (Chi-square < 10 - 5). Band curve-fitting is best performed on original bands, although it is sometimes ac- complished, less accurately, on more shapely spectra ob- tained through self- deconvolution or s econd derivation . 3. Results and Discussion 3.1. High Temperatures Induced Inactivation of PM H+-ATPase An increase in temperature was accompanied by inhibit- tion of the H+-ATPase activity of the PM vesicles iso- lated from wheat roots (Figure 1), with a particularly sharp reduction as the temperature rose from 35˚C to 50˚C, and it was remaining at a very low level from 50˚C to 90˚C. 3.2. Relationship of Band positions of Amide I with High Temperature Stress The most studied infrared band of proteins is the amide I band appearing between 1600 and 1700 cm–1, with a ma- ximum for most proteins at around 1654 - 1674 cm–1. This arises primarily from the stretch vibration of the pe- ptide C=O group. Normal mode analysis reveals that the C=O stretching couples slightly with CN stretching, CN deformation and NH bending. Unfortunately, the HOH bending motion of water almost coincides with the amide I band and makes studies in proton aqueous solution dif- ficult [12]. This problem is overcome by using D2O as solvent. The D2O substitution leads to a shift of the am- ide I band (amide I) between 2 and 9 cm–1 to lower fre- quencies depending on the particular protein [13]. Because the C=O group is involved in different sec- ondary structure elements via hydrogen bonding to the peptide NH group, the experimentally observed amide I band envelopes a multitude of single bands with different frequencies which can be resolved as described above. The large number o f infrared spectroscopic studie s in com- 0 2 4 6 8 10 12 14 16 18 20 20 2530 35 4045 5055 60 6570 75 8085 90 PM H+ -ATP as e A c t iv it y (um olP i/m g pr otei n h) Temperature (˚C) Figure 1. Inactivation of H+-ATPase in PM vesicl es isolate d from wheat roots. The PM vesicles were heated from 20˚C to 90˚C with 10 min at every 5˚C step, and then the H+- ATPase activity was determined by measuring the release of Pi. Values are mean ± SE of at least four replicates. Copyright © 2011 SciRes. AJPS  Secondary Structure Changes and Thermal Stability of Plasma Membrane Proteins of Wheat Roots in Heat Stress Copyright © 2011 SciRes. AJPS 819 were curve fitted with Origin 7.0 software with appended PFM (Peak Fitting Maximum) function. The Ga ussian peak peak shape was used to fit the spectrum collected at each time point (Figure 3). The peaks belongs to the Amide I bination with crystal st ructure and NMR anal yses on va- rious proteins revealed some variability of the frequen- cy of the assigned component amide I bands. However, one can generally classify the components between 1658 cm–1 to α-helices [14,15], 1620 - 1635 cm–1 to intramo- lecular β-sheets, and 1665 - 1690 cm–1 to turns [11,14, 15]. However, aggregated proteins show intermolecular antiparallel β-sheets with infrared absorption around 1614 - 1624 cm–1 [11,14,15]. Some exceptions from this general assignment have discussed in the recent review by Arrondo and Goni [3] and by Heimburg [16]. Table 1 summarizes published assignments of amide I compo- nents of the PM spectrum to secondary structure ele- ments. Secondary structure composition can be estimated from the relative area of the single bands assigned to the different structures assuming that the extinction coeffi- cient for the peptide CO stretch vibration is the same in all hydrogen bonding structures. Table 1. Frequencies and proposed structural assignments of the bands for the decomposition between 1700 and 1580 cm–1 in the infrared spectrum of the PM. Frequency (cm–1) Assignment References 1704 Ester C- O group Blume [17] Menikh [18] 1693 β-Sheet He, WZ [19] 1665 Turns Surewicz [20] Dong [15] 1657 α-Helix He, WZ [19] Dong [15] 1650 Rando m co il + loops Surewicz [18] Dong [15] 1638 β-Sheet He, WZ [19] Surewicz [18] Dong [14] 1628 β-Sheet (strands) He, WZ [16] Surewicz [18] Dong [15] 1610 Side-chain (tyrosine) He, WZ [19] MacDonald [21] 1582 Amide II band He, WZ [19] Haris [13] 3.3. Cha ng e s i n Prote in Second a ry Conformation of PM Damaged under High Temperature Stress The original FTIR spectral band (Figure 2) often gener- ated complex multi-component bands that overlap into a broad unresolved absorption. To quantitatively analyze the change in intensities of the amide I band, the IR spe- ctra of the PM used Fourier self-deconvolution spectra and second-derivative spectra. The IR spectra of the PM 1456.28 1650.96 0. 0 0. 2 0. 4 0. 6 0. 8 1. 0 1. 2 1. 4 1. 6 1. 8 2. 0 2. 2 2. 4 2. 6 2. 8 Abs 10 00 1100 1200 1300 1400 15 00 1600 1700 18 00 cm –1 Figure 2. Change in the band region from 1800 to 1000 cm–1 in the infrare d spectr um of t he plasma membrane i n D2O buffer during the st epped heating process. Fro m upper to low er, the spectra are those at 2 0˚C to 90˚C wi th increasing te mperature steps of 5˚C. 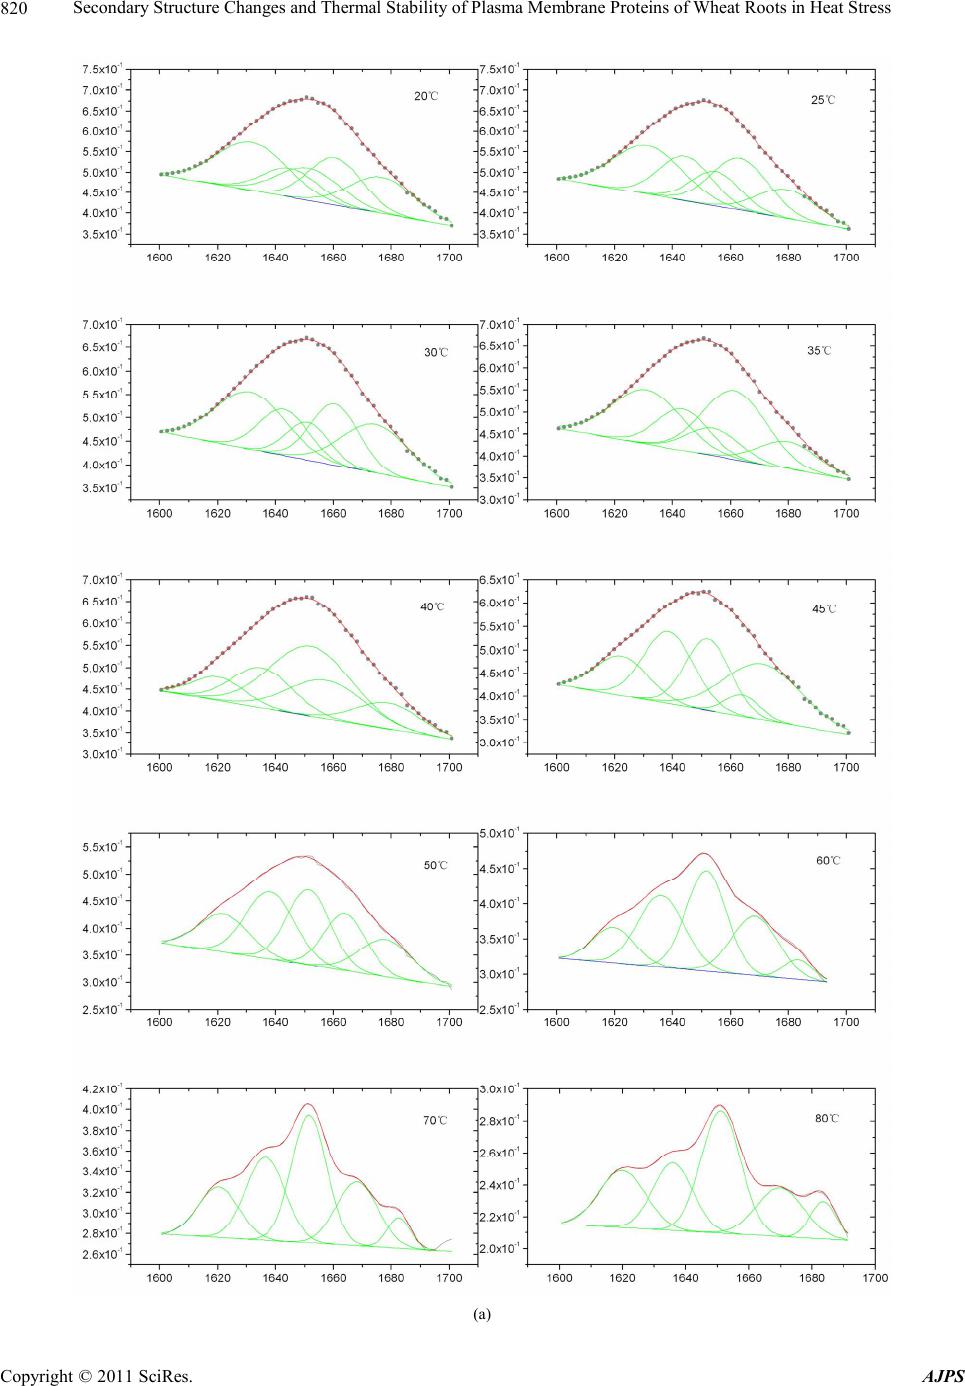 Secondary Structure Changes and Thermal Stability of Plasma Membrane Proteins of Wheat Roots in Heat Stress 820 (a) Copyright © 2011 SciRes. AJPS 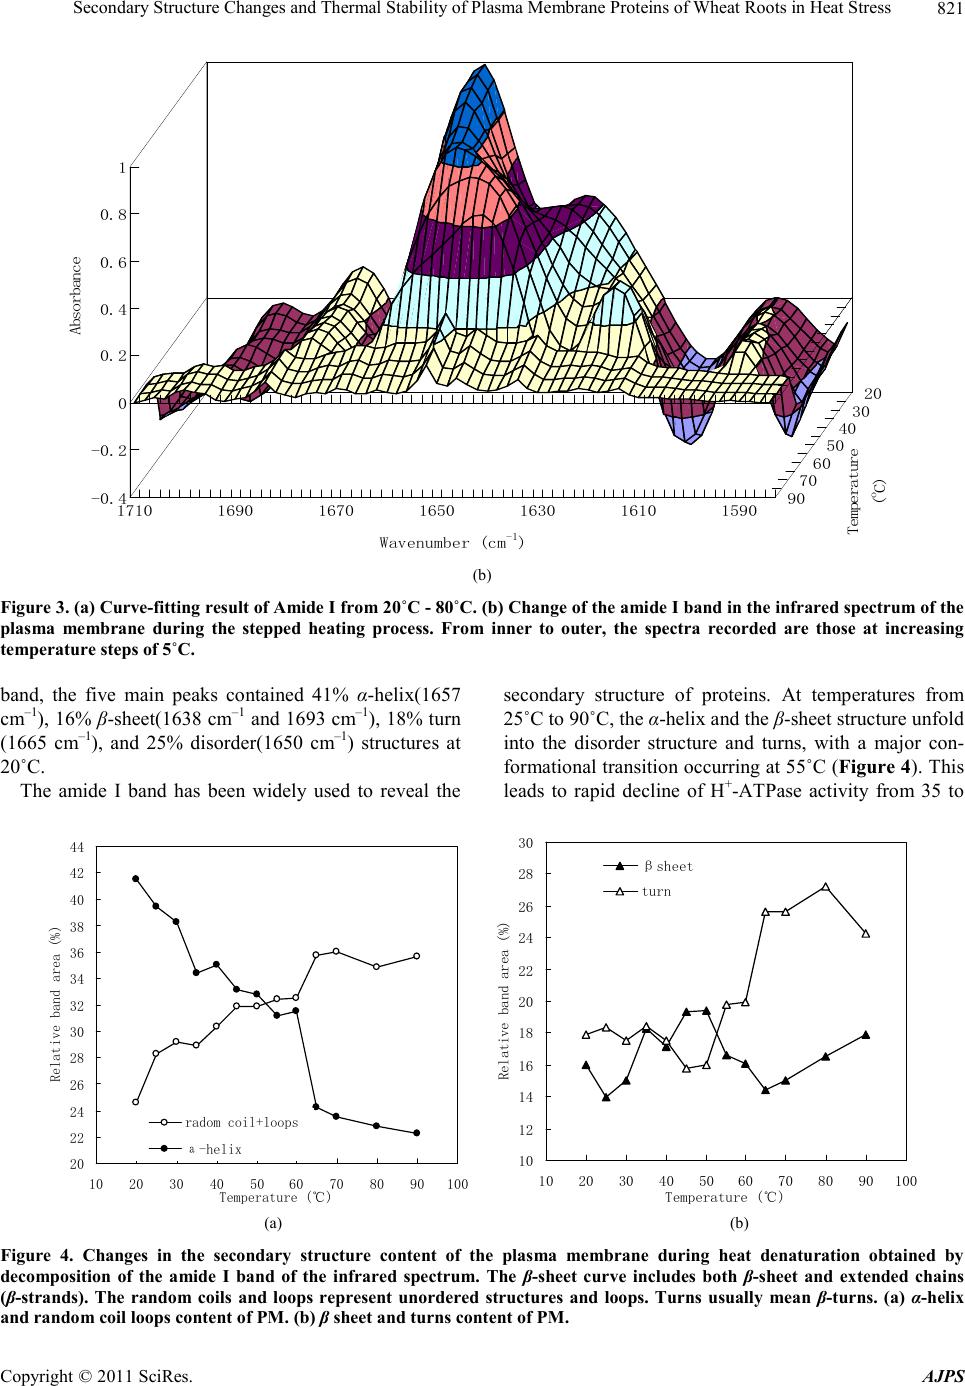 Secondary Structure Changes and Thermal Stability of Plasma Membrane Proteins of Wheat Roots in Heat Stress Copyright © 2011 SciRes. AJPS 821 -0.4 -0.2 0 0.2 0.4 0.6 0.8 1 Absorbance 1710 1690 1670 1650 1630 1610 1590 20 30 40 50 60 70 90 Wavenumber (cm -1 ) Temperature ( o C) (b) Figure 3. (a) Curve-fitting result of Amide I from 20˚C - 80˚C. (b) Change of the amide I band in the infrared spectrum of the plasma membrane during the stepped heating process. From inner to outer, the spectra recorded are those at increasing temperature ste ps of 5˚C. band, the five main peaks contained 41% α-helix(1657 cm–1), 16% β-sheet(1638 cm–1 and 1693 cm–1), 18% turn (1665 cm–1), and 25% disorder(1650 cm–1) structures at 20˚C. The amide I band has been widely used to reveal the secondary structure of proteins. At temperatures from 25˚C to 90˚C, the α-helix and the β-sheet structure unfold into the disorder structure and turns, with a major con- formational transition occurring at 55˚C (Figure 4). This leads to rapid decline of H+-ATPase activity from 35 to 20 22 24 26 28 30 32 34 36 38 40 42 44 10 20 30 40 5060 70 80 90100 Temperature (℃) Relative band area (%) radom coil+loops а-helix 10 12 14 16 18 20 22 24 26 28 30 10 20 30 40 5060 70 80 90100 Temperature (℃) Relative band area (%) βsheet turn (a) (b) Figure 4. Changes in the secondary structure content of the plasma membrane during heat denaturation obtained by decomposition of the amide I band of the infrared spectrum. The β-sheet curve includes both β-sheet and extended chains (β-strands). The random coils and loops represent unordered structures and loops. Turns usually mean β-turns. (a) α-helix and random coil loops content of PM. (b) β sheet and turns content of PM. 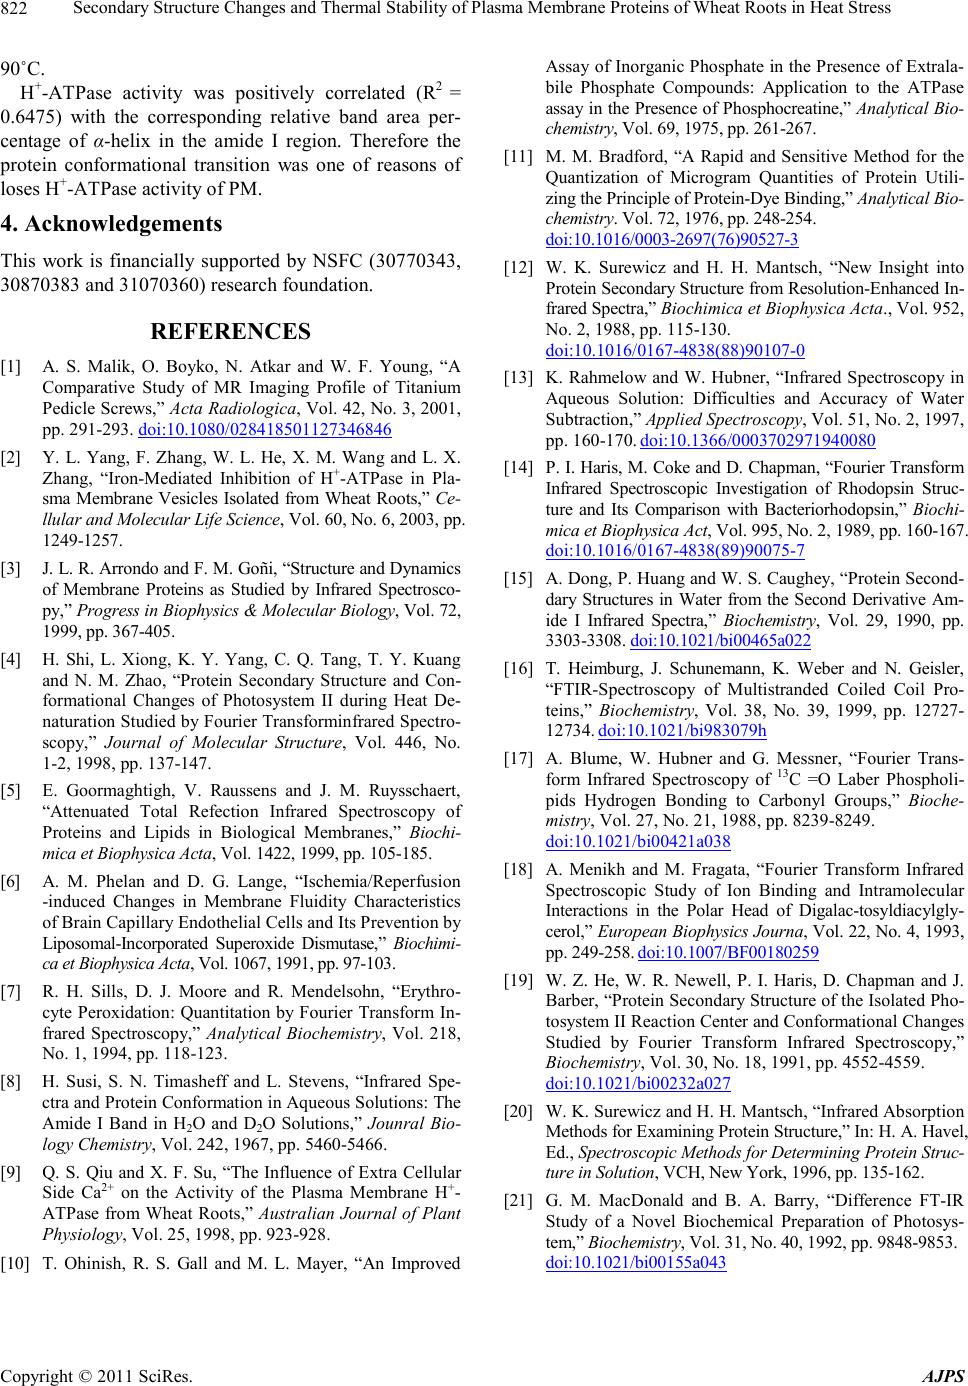 Secondary Structure Changes and Thermal Stability of Plasma Membrane Proteins of Wheat Roots in Heat Stress 822 90˚C. H+-ATPase activity was positively correlated (R2 = 0.6475) with the corresponding relative band area per- centage of α-helix in the amide I region. Therefore the protein conformational transition was one of reasons of loses H+-ATPase activity of PM. 4. Acknowledgements This work is financially supported by NSFC (30770343, 30870383 and 31070360) research foundation. REFERENCES [1] A. S. Malik, O. Boyko, N. Atkar and W. F. Young, “A Comparative Study of MR Imaging Profile of Titanium Pedicl e Screws,” Acta Radiologica, Vol. 42, No. 3, 2001, pp. 291-293. doi:10.1080/028418501127346846 [2] Y. L. Yang, F. Zhang, W. L. He, X. M. Wang and L. X. Zhang, “Iron-Mediated Inhibition of H+-ATPase in Pla- sma Membrane Vesicles Isolated from Wheat Roots,” Ce- llular and Molecular Life Science, Vol. 60, No. 6, 2003, pp. 1249-1257. [3] J. L. R. Arrondo and F. M. Goñi, “Structure and Dynamics of Membrane Proteins as Studied by Infrared Spectrosco- py,” Progress in Biophysics & Molecular Biology, Vol. 72, 1999, pp. 367-405. [4] H. Shi, L. Xiong, K. Y. Yang, C. Q. Tang, T. Y. Kuang and N. M. Zhao, “Protein Secondary Structure and Con- formational Changes of Photosystem II during Heat De- naturation Studied by Fourier Transforminfrared Spectro- scopy,” Journal of Molecular Structure, Vol. 446, No. 1-2, 1998, pp. 137-147. [5] E. Goormaghtigh, V. Raussens and J. M. Ruysschaert, “Attenuated Total Refection Infrared Spectroscopy of Proteins and Lipids in Biological Membranes,” Biochi- mica et Biophysica Acta, Vol. 142 2, 1999, pp. 105- 18 5. [6] A. M. Phelan and D. G. Lange, “Ischemia/Reperfusion -induced Changes in Membrane Fluidity Characteristics of Brain Capillary Endothelial Cells and Its Prevention by Liposomal-Incorporated Superoxide Dismutase,” Biochimi- ca et Biophysica Acta, Vol. 1067, 1991, pp. 97-103. [7] R. H. Sills, D. J. Moore and R. Mendelsohn, “Erythro- cyte Peroxidation: Quantitation by Fourier Transform In- frared Spectroscopy,” Analytical Biochemistry, Vol. 218, No. 1, 1994, pp. 118- 12 3. [8] H. Susi, S. N. Timasheff and L. Stevens, “Infrared Spe- ctra and Protein Conformation in Aqueous Solutions: The Amide I Band in H2O and D2O Solutions,” Jounral Bio- logy Chemistry, Vol. 242, 1967, pp. 5460-5466. [9] Q. S. Qiu and X. F. Su, “The Influence of Extra Cellular Side Ca2+ on the Activity of the Plasma Membrane H+- ATPase from Wheat Roots,” Australian Journal of Plant Physiology, Vol. 25, 199 8, pp. 92 3- 9 28. [10] T. Ohinish, R. S. Gall and M. L. Mayer, “An Improved Assay of Inorganic Phosphate in the Presence of Extrala- bile Phosphate Compounds: Application to the ATPase assay in the P resence of P hosphocreat ine,” Analytical Bio- chemistry, Vol. 69, 1975, pp. 261-267. [11] M. M. Bradford, “A Rapid and Sensitive Method for the Quantization of Microgram Quantities of Protein Utili- zing the Principle of Protein-Dye Binding,” Analytical Bio- chemistry. Vol. 72, 1976, pp. 248-254. doi:10.1016/0003-2697(76)90527-3 [12] W. K. Surewicz and H. H. Mantsch, “New Insight into Protein Secondary Structure from Resolution-Enhanced In- frared Spectra, ” Biochimica et Biophysica Acta., Vol. 952, No. 2, 1988, pp. 115-130. do i:10.1016/0167-4838(88)90107-0 [13] K. Rahmelow and W. Hubner, “Infrared Spectroscopy in Aqueous Solution: Difficulties and Accuracy of Water Subtraction,” Applied Spectroscopy, Vol. 51, No. 2, 1997, pp. 160- 170. doi:10.1366/0003702971940080 [14] P. I. Haris, M. Coke and D. Chapman, “Fourier Transform Infrared Spectroscopic Investigation of Rhodopsin Struc- ture and Its Comparison with Bacteriorhodopsin,” Biochi- mica et Biophysica Act, Vol. 995, No. 2, 1989, pp. 160-167. do i:10.1016/0167-4838(89)90075-7 [15] A. Dong, P. Huang and W. S. Caughey, “Protein Second- dary Structures in Water from the Second Derivative Am- ide I Infrared Spectra,” Biochemistry, Vol. 29, 1990, pp. 3303-330 8. doi:10.1021/bi00465a022 [16] T. Heimburg, J. Schunemann, K. Weber and N. Geisler, “FTIR-Spectroscopy of Multistranded Coiled Coil Pro- teins,” Biochemistry, Vol. 38, No. 39, 1999, pp. 12727- 12734. doi:10.1021/bi983079h [17] A. Blume, W. Hubner and G. Messner, “Fourier Trans- form Infrared Spectroscopy of 13C =O Laber Phospholi- pids Hydrogen Bonding to Carbonyl Groups,” Bioche- mistry, Vol. 27, No. 21, 198 8, pp . 8239-82 49. doi:10.1021/bi00421a038 [18] A. Menikh and M. Fragata, “Fourier Transform Infrared Spectroscopic Study of Ion Binding and Intramolecular Interactions in the Polar Head of Digalac-tosyldiacylgly- cerol,” European Biophysics Journa, Vol. 22, No. 4, 1993, pp. 249-25 8. doi:10.1007/BF00180259 [19] W. Z. He, W. R. Newell, P. I. Haris, D. Chapman and J. Barber, “P rotein Secon dary Structu re of the Isol ated Pho- tosystem II Reaction Center and Conformational Changes Studied by Fourier Transform Infrared Spectroscopy,” Biochemistry, Vol. 30, No. 18, 1991, pp. 4552-4559. doi:10.1021/bi00232a027 [20] W. K. Surewicz and H. H. Mantsch, “Infrared Absorption Methods for Examining Protein Structure,” In: H. A. Havel, Ed., Spectroscopic Methods for Determining Protein Struc- ture in Solution, VCH, N e w York, 1996, pp. 135-162. [21] G. M. MacDonald and B. A. Barry, “Difference FT-IR Study of a Novel Biochemical Preparation of Photosys- tem,” Biochemistry, Vol. 31, No. 40, 199 2, p p. 98 48-9853. doi:10.1021/bi00155a043 Copyright © 2011 SciRes. AJPS |