

Paper Menu >>
Journal Menu >>
 Open Journal of Acoust i c s , 2011, 1, 63-69 doi:10.4236/oja.2011.13008 Published Online December 2011 (http://www.SciRP.org/journal/oja) Copyright © 2011 SciRes. OJA Towards Earthquake Shields: A Numerical Investigation of Earthquake Shielding with Seismic Crystals Baris Baykant Alagoz1, Serkan Alagoz2 1Department of Electric-Electronics Engineering, Inonu University, Malatya, Turkey 2Department of Physics, Inonu University, Malatya, Turkey E-mail: [email protected] Received October 10, 2011; revised November 14, 2011; accepted November 24, 2011 Abstract Authors numerically demonstrate that the seismic surface waves from an earthquake can be attenuated by a seis- mic crystal structure constructed on the ground. In the study, seismic crystals with a lattice constant of kilome- ter are investigated in the aspect of band gaps (Stop band), and some design considerations for earthquake shield- ing are discussed for various crystal configurations in a theoretical manner. Authors observed in their FDTD based 2D wave simulation results that the proposed earthquake shield can provide a decreasing in magnitude of surface seismic waves. Such attenuation of seismic waves might reduce the damage in an earthquake. Keywords: Earthquake Shielding, Seismic Metamaterials, Seismic Wave Attenuation, Band Gap Analysis 1. Introduction and Preliminaries In recent research about photonic, phononic and sonic crystals, band gaps were observed in the band structure characteristics of crystals with various lattice geometries [1-20]. As crystal structures exhibit very low transmis- sion in the frequencies within band gaps, they were also referred to as “stop bands.” Band gaps appear in the wave transmission spectrum when a homogenous wave propagation medium turns into an inhomogeneous me- dium with periodic defects. Those periodical defects in the medium disturb the wave propagation at certain fre- quency groups, which make up the so-called band gap. In general, the periodical defects in a medium are com- monly called scatterers and the medium in which the wave propagates is called the host material of the crystal structure. In order to form such a periodically inhomogeneous medium, photonic crystals, used for electromagnetic waves, are composed of periodically modulated dielec- tric materials [9-12]; sonic crystals for acoustic waves are mostly composed of periodic arrays of solid rods in the air [1,3-5] and phononic crystal are made of solid or liquid host material with a periodic inhomogenization [15-17]. For a seismic crystal implementation, in our study, we preferred periodic holes in the ground as the scatterers and the ground itself as the host material. A representation of a 2D seismic crystal structure and its relevant design parameters is given in Figure 1. The hole scatterer-solid host configurations and their full band gap effect were demonstrated for surface acoustic waves on two-dimensional phononic crystal in the sub-meter scales, such as a piezoelectric phononic crystals [15-17]. As a result of scalability features of two dimensional crystal lattice with respect to wavelength (a is constant), the similar band gap effects can be obtained for the seismic waves via a larger crystal implementation in the scales of kilometers [14]. This idea was our basic motivation in this theoretical work. In general notation, the distance between the centers of the cylindrical scattering materials is referred to as the lattice constant and denoted by a ,and radius of the cy- lindrical scattering material is denoted by r. The para- meter h is the height of the holes and λ represents the wavelength. Band gap properties of crystal structures have been used practically in the application of wave isolation in a selected frequency band [5,6,8,18,19]. In a similar fash- ion, we numerically investigate crystal structures built on the ground in order to attenuate the longitudinal ground vibrations propagating on the surface of the earth by means of band gaps. We employed the hole-ground type crystal structures to be a sort of seismic crystal and ap- plied them towards isolating a region from seismic waves, i.e., to earthquake shielding. Another technique to isolation, recently made progress, is to cloaking method 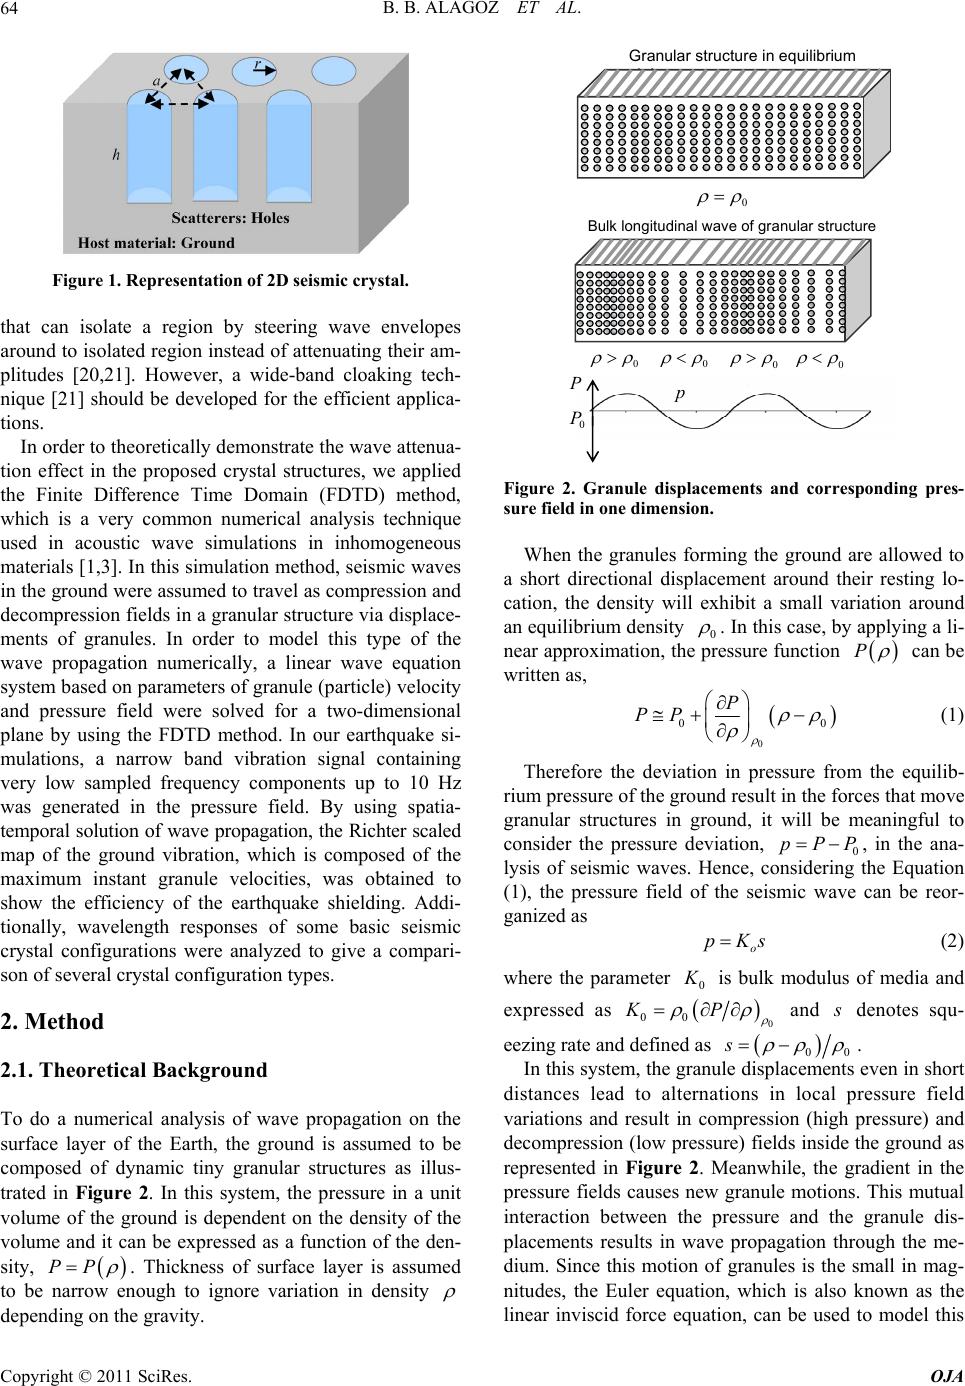 B. B. ALAGOZ ET AL. 64 Figure 1. Representation of 2D seismic crystal. that can isolate a region by steering wave envelopes around to isolated region instead of attenuating their am- plitudes [20,21]. However, a wide-band cloaking tech- nique [21] should be developed for the efficient applica- tions. In order to theoretically demonstrate the wave attenua- tion effect in the proposed crystal structures, we applied the Finite Difference Time Domain (FDTD) method, which is a very common numerical analysis technique used in acoustic wave simulations in inhomogeneous materials [1,3]. In this simulation method, seismic waves in the ground were assumed to travel as compression and decompression fields in a granular structure via displace- ments of granules. In order to model this type of the wave propagation numerically, a linear wave equation system based on parameters of granule (particle) velocity and pressure field were solved for a two-dimensional plane by using the FDTD method. In our earthquake si- mulations, a narrow band vibration signal containing very low sampled frequency components up to 10 Hz was generated in the pressure field. By using spatia- temporal solution of wave propagation, the Richter scaled map of the ground vibration, which is composed of the maximum instant granule velocities, was obtained to show the efficiency of the earthquake shielding. Addi- tionally, wavelength responses of some basic seismic crystal configurations were analyzed to give a compari- son of several crystal configuration types. 2. Method 2.1. Theoretical Background To do a numerical analysis of wave propagation on the surface layer of the Earth, the ground is assumed to be composed of dynamic tiny granular structures as illus- trated in Figure 2. In this system, the pressure in a unit volume of the ground is dependent on the density of the volume and it can be expressed as a function of the den- sity, PP . Thickness of surface layer is assumed to be narrow enough to ignore variation in density depending on the gravity. Granular structure in equilibrium state 0 Bulk longitudinal wave of granular structure 0 0 0 0 p P 0 P Figure 2. Granule displacements and corresponding pres- sure field in one dimension. When the granules forming the ground are allowed to a short directional displacement around their resting lo- cation, the density will exhibit a small variation around an equilibrium density 0 . In this case, by applying a li- near approximation, the pressure function P can be written as, 0 0 P PP 0 (1) Therefore the deviation in pressure from the equilib- rium pressure of the ground result in the forces that move granular structures in ground, it will be meaningful to consider the pressure deviation, 0, in the ana- lysis of seismic waves. Hence, considering the Equation (1), the pressure field of the seismic wave can be reor- ganized as pPP o pKs (2) where the parameter 0 K is bulk modulus of media and expressed as 0 KP 00 and s denotes squ- eezing rate and defined as 00 s . In this system, the granule displacements even in short distances lead to alternations in local pressure field variations and result in compression (high pressure) and decompression (low pressure) fields inside the ground as represented in Figure 2. Meanwhile, the gradient in the pressure fields causes new granule motions. This mutual interaction between the pressure and the granule dis- placements results in wave propagation through the me- dium. Since this motion of granules is the small in mag- nitudes, the Euler equation, which is also known as the linear inviscid force equation, can be used to model this Copyright © 2011 SciRes. OJA 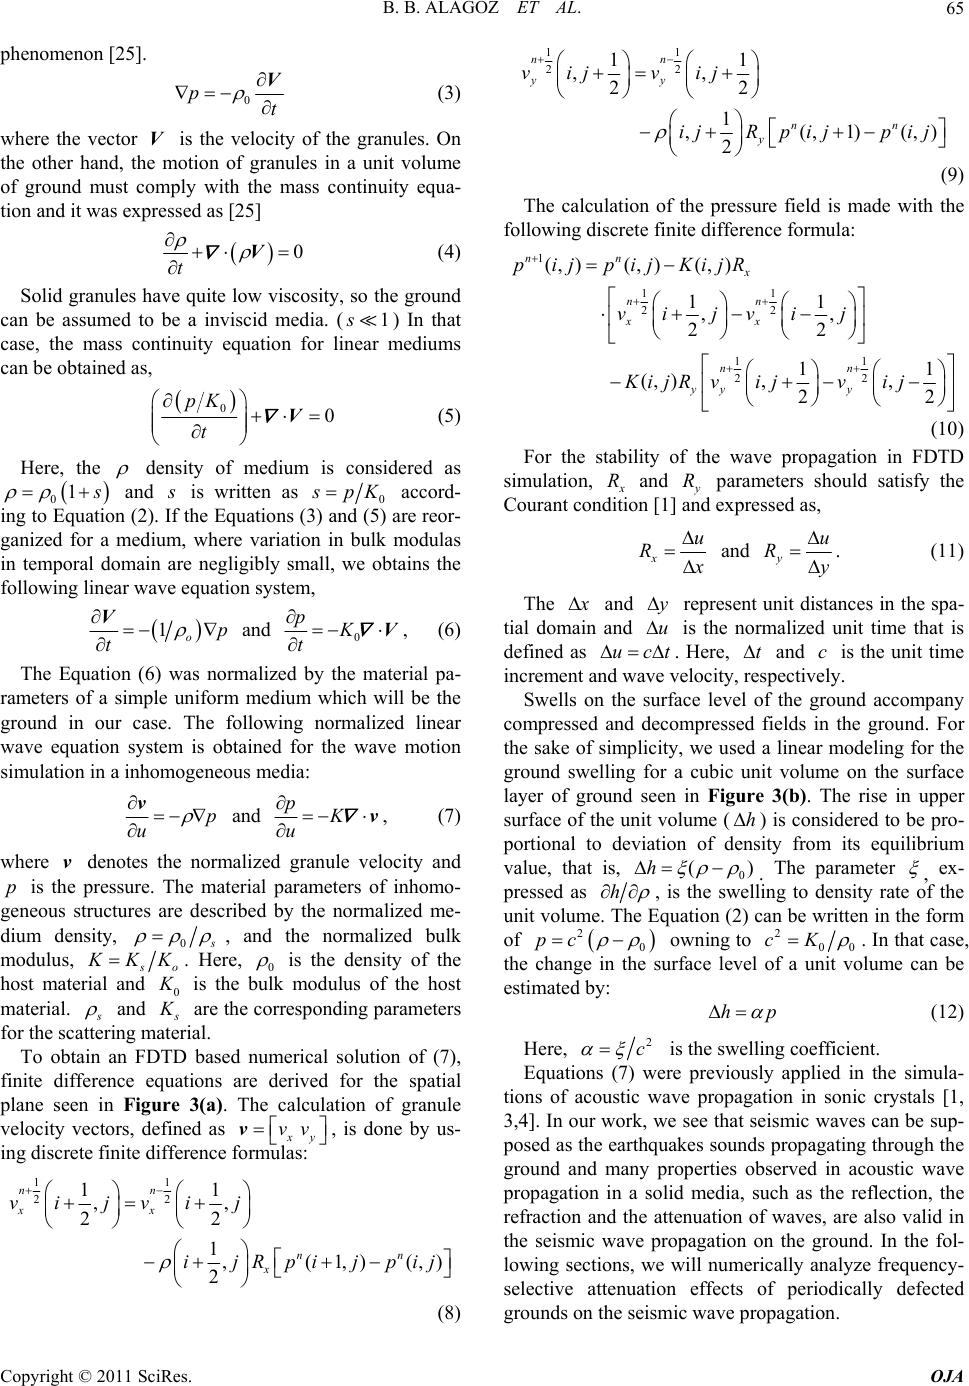 B. B. ALAGOZ ET AL.65 phenomenon [25]. 0 pt V (3) where the vector is the velocity of the granules. On the other hand, the motion of granules in a unit volume of ground must comply with the mass continuity equa- tion and it was expressed as [25] V 0 t V (4) Solid granules have quite low viscosity, so the ground can be assumed to be a inviscid media. () In that case, the mass continuity equation for linear mediums can be obtained as, 1s 00 pK t V (5) Here, the density of medium is considered as 0 1 s and s is written as 0 s pK accord- ing to Equation (2). If the Equations (3) and (5) are reor- ganized for a medium, where variation in bulk modulas in temporal domain are negligibly small, we obtains the following linear wave equation system, 1op t V and 0 pK t V , (6) The Equation (6) was normalized by the material pa- rameters of a simple uniform medium which will be the ground in our case. The following normalized linear wave equation system is obtained for the wave motion simulation in a inhomogeneous media: p u v and pK u v, (7) where denotes the normalized granule velocity and is the pressure. The material parameters of inhomo- geneous structures are described by the normalized me- dium density, v p 0 s , and the normalized bulk modulus, s o K KK. Here, 0 is the density of the host material and 0 K is the bulk modulus of the host material. s and s K are the corresponding parameters for the scattering material. To obtain an FDTD based numerical solution of (7), finite difference equations are derived for the spatial plane seen in Figure 3(a). The calculation of granule velocity vectors, defined as x y, is done by us- ing discrete finite difference formulas: vv v 11 22 11 ,, 22 1 ,(1,)(, 2 nn xx nn x vi jvi j ijRpijpij ) (8) 11 22 11 ,, 22 1 ,(,1) 2 nn yy nn y vij vij ijRp ijp ij (,) (9) The calculation of the pressure field is made with the following discrete finite difference formula: 1 11 22 11 22 (, )(, )(, ) 11 ,, 22 11 (,),, 22 nn x nn xx nn yy y pijpijKijR vi jvi j Ki jRvi jvij (10) For the stability of the wave propagation in FDTD simulation, x R and y R parameters should satisfy the Courant condition [1] and expressed as, x u R x and y u Ry . (11) The x and y represent unit distances in the spa- tial domain and u is the normalized unit time that is defined as uct . Here, and c is the unit time increment and wave velocity, respectively. t Swells on the surface level of the ground accompany compressed and decompressed fields in the ground. For the sake of simplicity, we used a linear modeling for the ground swelling for a cubic unit volume on the surface layer of ground seen in Figure 3(b). The rise in upper surface of the unit volume () is considered to be pro- portional to deviation of density from its equilibrium value, that is, 0 h (h) . The parameter , ex- pressed as h , is the swelling to density rate of the unit volume. The Equation (2) can be written in the form of 0 2 pc owning to 2 00 cK . In that case, the change in the surface level of a unit volume can be estimated by: hp (12) Here, 2 c is the swelling coefficient. Equations (7) were previously applied in the simula- tions of acoustic wave propagation in sonic crystals [1, 3,4]. In our work, we see that seismic waves can be sup- posed as the earthquakes sounds propagating through the ground and many properties observed in acoustic wave propagation in a solid media, such as the reflection, the refraction and the attenuation of waves, are also valid in the seismic wave propagation on the ground. In the fol- lowing sections, we will numerically analyze frequency- selective attenuation effects of periodically defected grounds on the seismic wave propagation. Copyright © 2011 SciRes. OJA 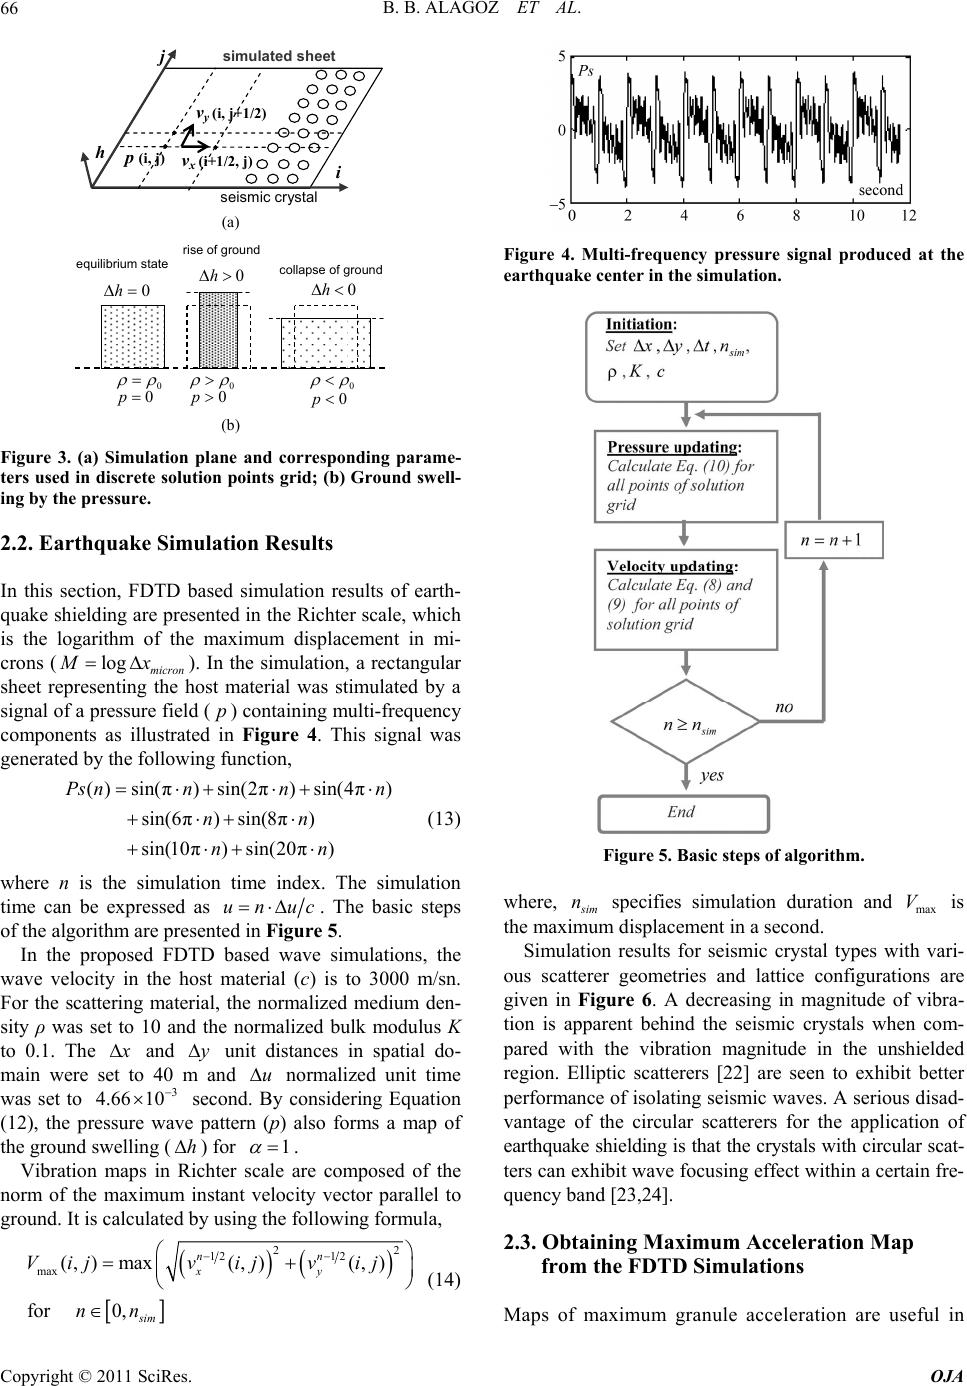 B. B. ALAGOZ ET AL. 66 (a) vx (i+1/2, j) h i j simulated sheet seismic crystal p (i, j) vy (i, j+1/2) (a) 0 0 0 0h0h equilibrium sta t e 0h rise of ground collapse of ground 0p0p0p (b) Figure 3. (a) Simulation plane and corresponding parame- ters used in discrete solution points grid; (b) Ground swell- ing by the pressure. 2.2. Earthquake Simulation Results In this section, FDTD based simulation results of earth- quake shielding are presented in the Richter scale, which is the logarithm of the maximum displacement in mi- crons (). In the simulation, a rectangular sheet representing the host material was stimulated by a signal of a pressure field () containing multi-frequency components as illustrated in Figure 4. This signal was generated by the following function, log micron Mx p () sin(π)s in(2π)sin(4π) sin(6π)sin(8π) sin(10π)sin(20π) Ps nnnn nn nn (13) where n is the simulation time index. The simulation time can be expressed as unuc . The basic steps of the algorithm are presented in Figure 5. In the proposed FDTD based wave simulations, the wave velocity in the host material (c) is to 3000 m/sn. For the scattering material, the normalized medium den- sity ρ was set to 10 and the normalized bulk modulus K to 0.1. The x and y unit distances in spatial do- main were set to 40 m and u normalized unit time was set to second. By considering Equation (12), the pressure wave pattern (p) also forms a map of the ground swelling () for 3 10 4.66 h1 . Vibration maps in Richter scale are composed of the norm of the maximum instant velocity vector parallel to ground. It is calculated by using the following formula, 2 12 12 max (, )max(, )(,) for 0, nn xy sim Vijv ijv ij nn Figure 4. Multi-frequency pressure signal produced at the earthquake center in the simulation. Figure 5. Basic steps of algorithm. where, s im specifies simulation duration and is the maximum displacement in a second. nmax V Simulation results for seismic crystal types with vari- ous scatterer geometries and lattice configurations are given in Figure 6. A decreasing in magnitude of vibra- tion is apparent behind the seismic crystals when com- pared with the vibration magnitude in the unshielded region. Elliptic scatterers [22] are seen to exhibit better performance of isolating seismic waves. A serious disad- vantage of the circular scatterers for the application of earthquake shielding is that the crystals with circular scat- ters can exhibit wave focusing effect within a certain fre- quency band [23,24]. 2 (14) 2.3. Obtaining Maximum Acceleration Map from the FDTD Simulations Maps of maximum granule acceleration are useful in Copyright © 2011 SciRes. OJA 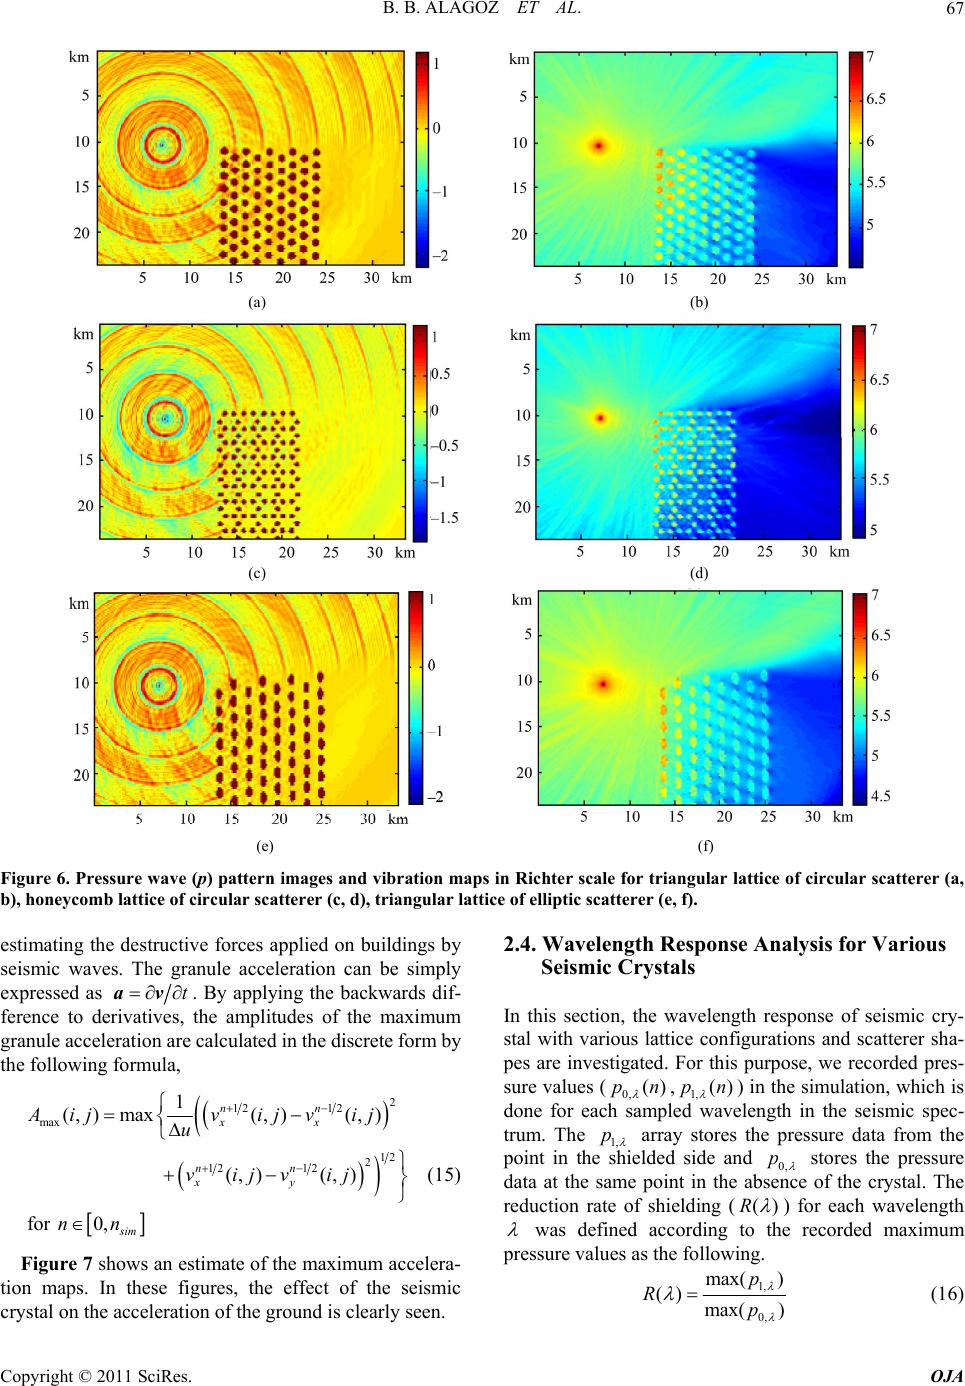 B. B. ALAGOZ ET AL. Copyright © 2011 SciRes. OJA 67 (a) (b) (c) (d) (e) (f) Figure 6. Pressure wave (p) pattern images and vibration maps in Richter scale for triangular lattice of circular scatterer (a, b), honeycomb lattice of circular scatterer (c, d), triangular lattice of elliptic scatterer (e, f). 2.4. Wavelength Response Analysis for Various Seismic Crystals estimating the destructive forces applied on buildings by seismic waves. The granule acceleration can be simply expressed as t av. By applying the backwards dif- ference to derivatives, the amplitudes of the maximum granule acceleration are calculated in the discrete form by the following formula, 2 12 12 max 12 2 12 12 1 (, )max(, )(, ) (, )(, ) for 0, nn xx nn xy sim Aijv ijv ij u vijvij nn (15) In this section, the wavelength response of seismic cry- stal with various lattice configurations and scatterer sha- pes are investigated. For this purpose, we recorded pres- sure values (0,,1, ) in the simulation, which is done for each sampled wavelength in the seismic spec- trum. The 1, ()pn p ()pn array stores the pressure data from the point in the shielded side and 0, p stores the pressure data at the same point in the absence of the crystal. The reduction rate of shielding (()R ) for each wavelength was defined according to the recorded maximum pressure values as the following. Figure 7 shows an estimate of the maximum accelera- tion maps. In these figures, the effect of the seismic crystal on the acceleration of the ground is clearly seen. 1, 0, max( ) () max( ) p Rp (16) 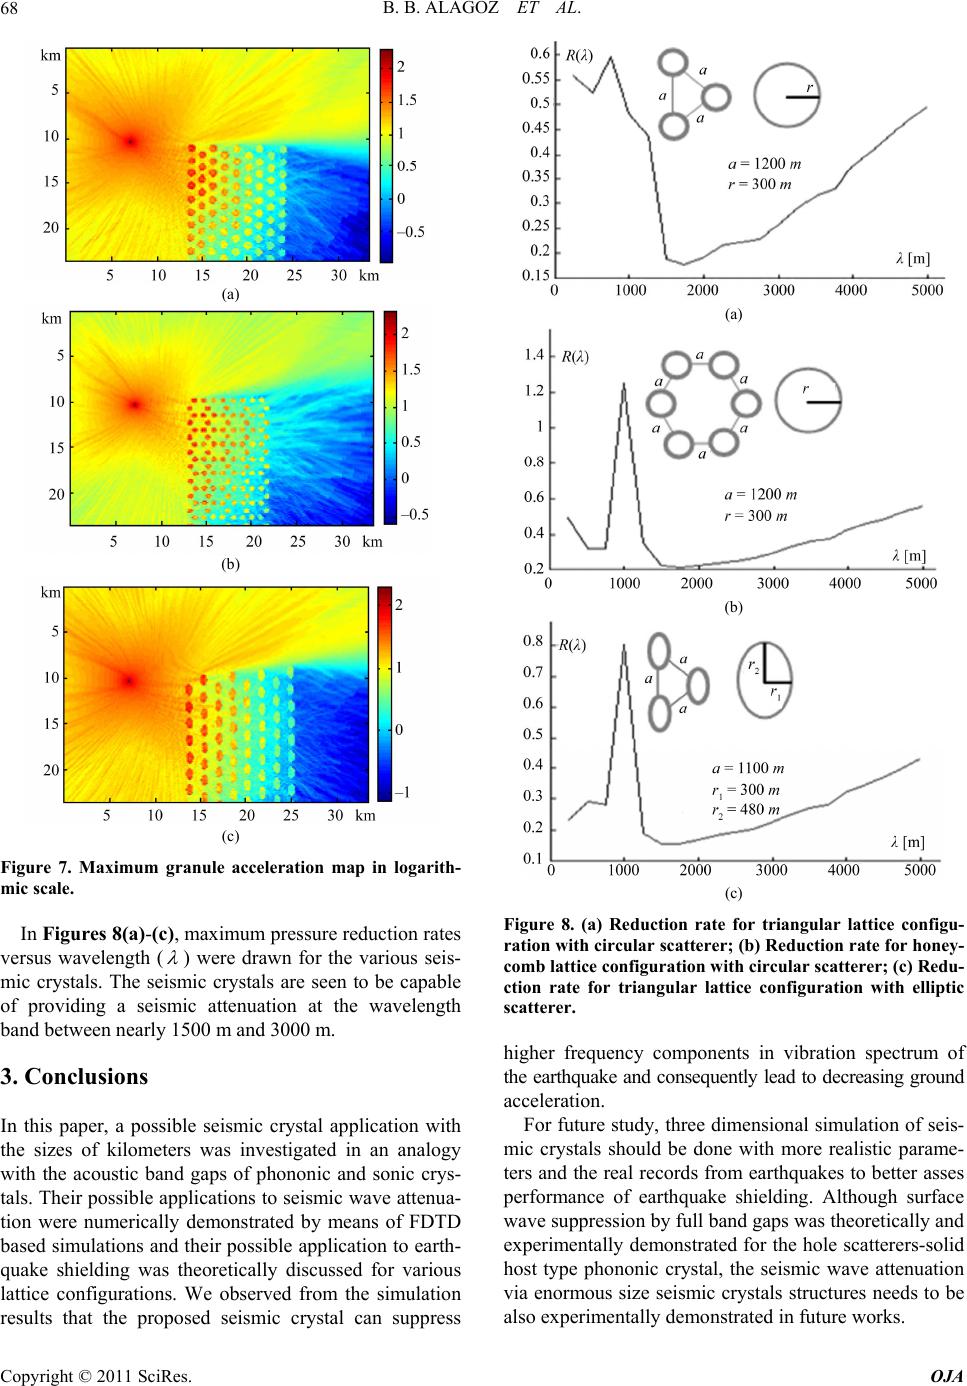 B. B. ALAGOZ ET AL. 68 (a) (b) (c) Figure 7. Maximum granule acceleration map in logarith- mic scale. In Figures 8(a)-(c), maximum pressure reduction rates versus wavelength ( ) were drawn for the various seis- mic crystals. The seismic crystals are seen to be capable of providing a seismic attenuation at the wavelength band between nearly 1500 m and 3000 m. 3. Conclusions In this paper, a possible seismic crystal application with the sizes of kilometers was investigated in an analogy with the acoustic band gaps of phononic and sonic crys- tals. Their possible applications to seismic wave attenua- tion were numerically demonstrated by means of FDTD based simulations and their possible application to earth- quake shielding was theoretically discussed for various lattice configurations. We observed from the simulation results that the proposed seismic crystal can suppress (a) (b) (c) Figure 8. (a) Reduction rate for triangular lattice configu- ration with circular scatterer; (b) Reduction rate for honey- comb lattice configuration with circular scatterer; (c) Redu- ction rate for triangular lattice configuration with elliptic scatterer. higher frequency components in vibration spectrum of the earthquake and consequently lead to decreasing ground acceleration. For future study, three dimensional simulation of seis- mic crystals should be done with more realistic parame- ters and the real records from earthquakes to better asses performance of earthquake shielding. Although surface wave suppression by full band gaps was theoretically and experimentally demonstrated for the hole scatterers-solid host type phononic crystal, the seismic wave attenuation via enormous size seismic crystals structures needs to be also experimentally demonstrated in future works. Copyright © 2011 SciRes. OJA 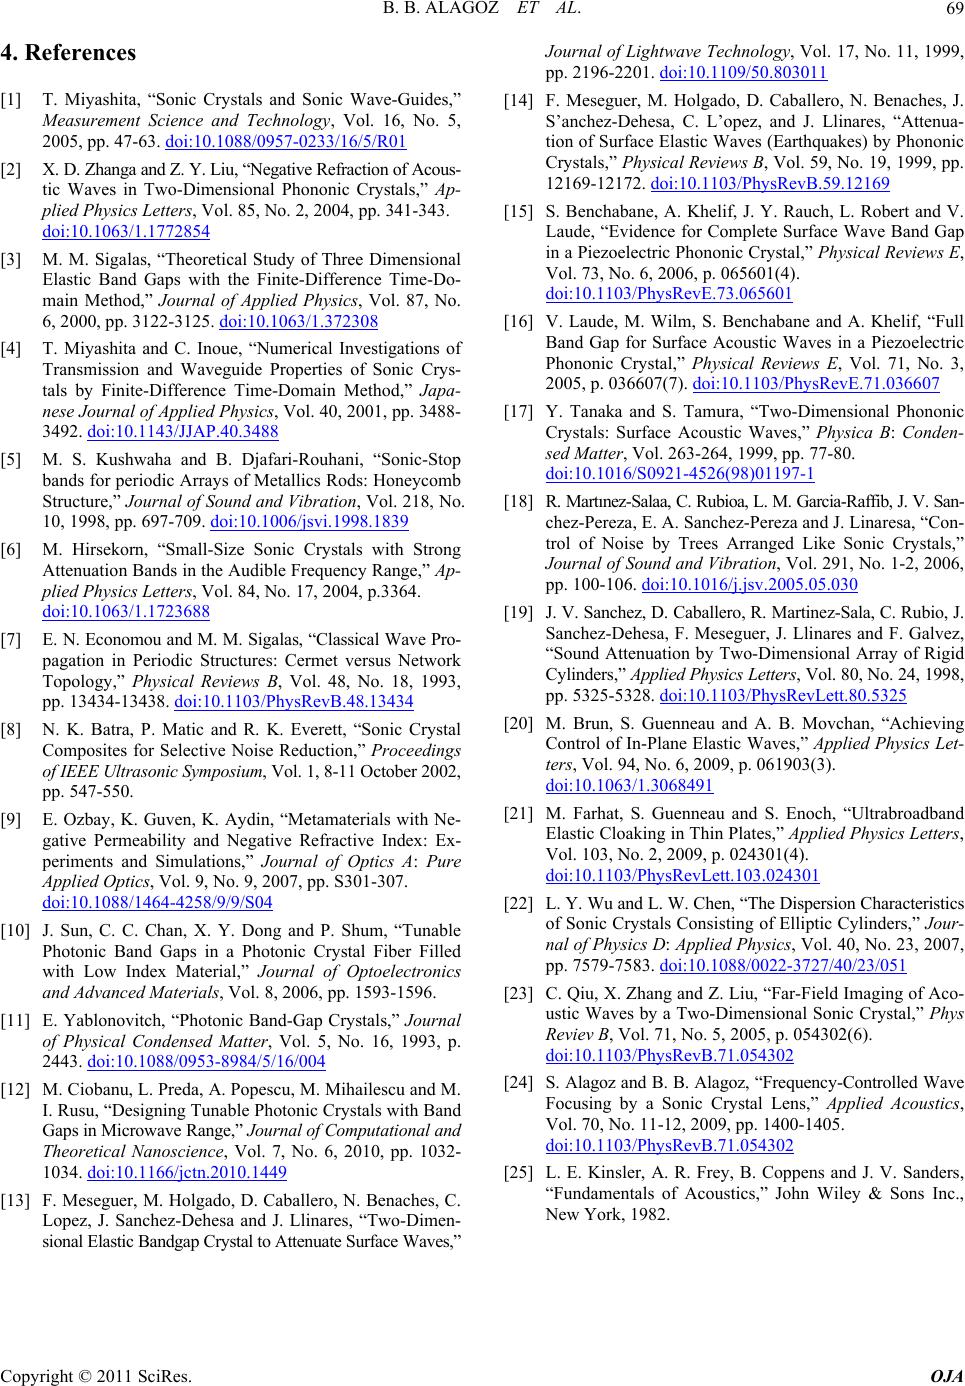 B. B. ALAGOZ ET AL. Copyright © 2011 SciRes. OJA 69 4. References [1] T. Miyashita, “Sonic Crystals and Sonic Wave-Guides,” Measurement Science and Technology, Vol. 16, No. 5, 2005, pp. 47-63. doi:10.1088/0957-0233/16/5/R01 [2] X. D. Zhanga and Z. Y. Liu, “Negative Refraction of Acous- tic Waves in Two-Dimensional Phononic Crystals,” Ap- plied Physics Letters, Vol. 85, No. 2, 2004, pp. 341-343. doi:10.1063/1.1772854 [3] M. M. Sigalas, “Theoretical Study of Three Dimensional Elastic Band Gaps with the Finite-Difference Time-Do- main Method,” Journal of Applied Physics, Vol. 87, No. 6, 2000, pp. 3122-3125. doi:10.1063/1.372308 [4] T. Miyashita and C. Inoue, “Numerical Investigations of Transmission and Waveguide Properties of Sonic Crys- tals by Finite-Difference Time-Domain Method,” Japa- nese Journal of Applied Physics, Vol. 40, 2001, pp. 3488- 3492. doi:10.1143/JJAP.40.3488 [5] M. S. Kushwaha and B. Djafari-Rouhani, “Sonic-Stop bands for periodic Arrays of Metallics Rods: Honeycomb Structure,” Journal of Sound and Vibration, Vol. 218, No. 10, 1998, pp. 697-709. doi:10.1006/jsvi.1998.1839 [6] M. Hirsekorn, “Small-Size Sonic Crystals with Strong Attenuation Bands in the Audible Frequency Range,” Ap- plied Physics Letters, Vol. 84, No. 17, 2004, p.3364. doi:10.1063/1.1723688 [7] E. N. Economou and M. M. Sigalas, “Classical Wave Pro- pagation in Periodic Structures: Cermet versus Network Topology,” Physical Reviews B, Vol. 48, No. 18, 1993, pp. 13434-13438. doi:10.1103/PhysRevB.48.13434 [8] N. K. Batra, P. Matic and R. K. Everett, “Sonic Crystal Composites for Selective Noise Reduction,” Proceedings of IEEE Ultrasonic Symposium, Vol. 1, 8-11 October 2002, pp. 547-550. [9] E. Ozbay, K. Guven, K. Aydin, “Metamaterials with Ne- gative Permeability and Negative Refractive Index: Ex- periments and Simulations,” Journal of Optics A: Pure Applied Optics, Vol. 9, No. 9, 2007, pp. S301-307. doi:10.1088/1464-4258/9/9/S04 [10] J. Sun, C. C. Chan, X. Y. Dong and P. Shum, “Tunable Photonic Band Gaps in a Photonic Crystal Fiber Filled with Low Index Material,” Journal of Optoelectronics and Advanced Materials, Vol. 8, 2006, pp. 1593-1596. [11] E. Yablonovitch, “Photonic Band-Gap Crystals,” Journal of Physical Condensed Matter, Vol. 5, No. 16, 1993, p. 2443. doi:10.1088/0953-8984/5/16/004 [12] M. Ciobanu, L. Preda, A. Popescu, M. Mihailescu and M. I. Rusu, “Designing Tunable Photonic Crystals with Band Gaps in Microwave Range,” Journal of Computational and Theoretical Nanoscience, Vol. 7, No. 6, 2010, pp. 1032- 1034. doi:10.1166/jctn.2010.1449 [13] F. Meseguer, M. Holgado, D. Caballero, N. Benaches, C. Lopez, J. Sanchez-Dehesa and J. Llinares, “Two-Dimen- sional Elastic Bandgap Crystal to Attenuate Surface Waves,” Journal of Lightwave Technology, Vol. 17, No. 11, 1999, pp. 2196-2201. doi:10.1109/50.803011 [14] F. Meseguer, M. Holgado, D. Caballero, N. Benaches, J. S’anchez-Dehesa, C. L’opez, and J. Llinares, “Attenua- tion of Surface Elastic Waves (Earthquakes) by Phononic Crystals,” Physical Reviews B, Vol. 59, No. 19, 1999, pp. 12169-12172. doi:10.1103/PhysRevB.59.12169 [15] S. Benchabane, A. Khelif, J. Y. Rauch, L. Robert and V. Laude, “Evidence for Complete Surface Wave Band Gap in a Piezoelectric Phononic Crystal,” Physical Reviews E, Vol. 73, No. 6, 2006, p. 065601(4). doi:10.1103/PhysRevE.73.065601 [16] V. Laude, M. Wilm, S. Benchabane and A. Khelif, “Full Band Gap for Surface Acoustic Waves in a Piezoelectric Phononic Crystal,” Physical Reviews E, Vol. 71, No. 3, 2005, p. 036607(7). doi:10.1103/PhysRevE.71.036607 [17] Y. Tanaka and S. Tamura, “Two-Dimensional Phononic Crystals: Surface Acoustic Waves,” Physica B: Conden- sed Matter, Vol. 263-264, 1999, pp. 77-80. doi:10.1016/S0921-4526(98)01197-1 [18] R. Martınez-Salaa, C. Rubioa, L. M. Garcia-Raffib, J. V. San- chez-Pereza, E. A. Sanchez-Pereza and J. Linaresa, “Con- trol of Noise by Trees Arranged Like Sonic Crystals,” Journal of Sound and Vibration, Vol. 291, No. 1-2, 2006, pp. 100-106. doi:10.1016/j.jsv.2005.05.030 [19] J. V. Sanchez, D. Caballero, R. Martinez-Sala, C. Rubio, J. Sanchez-Dehesa, F. Meseguer, J. Llinares and F. Galvez, “Sound Attenuation by Two-Dimensional Array of Rigid Cylinders,” Applied Physics Letters, Vol. 80, No. 24, 1998, pp. 5325-5328. doi:10.1103/PhysRevLett.80.5325 [20] M. Brun, S. Guenneau and A. B. Movchan, “Achieving Control of In-Plane Elastic Waves,” Applied Physics Let- ters, Vol. 94, No. 6, 2009, p. 061903(3). doi:10.1063/1.3068491 [21] M. Farhat, S. Guenneau and S. Enoch, “Ultrabroadband Elastic Cloaking in Thin Plates,” Applied Physics Letters, Vol. 103, No. 2, 2009, p. 024301(4). doi:10.1103/PhysRevLett.103.024301 [22] L. Y. Wu and L. W. Chen, “The Dispersion Characteristics of Sonic Crystals Consisting of Elliptic Cylinders,” Jour- nal of Physics D: Applied Physics, Vol. 40, No. 23, 2007, pp. 7579-7583. doi:10.1088/0022-3727/40/23/051 [23] C. Qiu, X. Zhang and Z. Liu, “Far-Field Imaging of Aco- ustic Waves by a Two-Dimensional Sonic Crystal,” Phys Reviev B, Vol. 71, No. 5, 2005, p. 054302(6). doi:10.1103/PhysRevB.71.054302 [24] S. Alagoz and B. B. Alagoz, “Frequency-Controlled Wave Focusing by a Sonic Crystal Lens,” Applied Acoustics, Vol. 70, No. 11-12, 2009, pp. 1400-1405. doi:10.1103/PhysRevB.71.054302 [25] L. E. Kinsler, A. R. Frey, B. Coppens and J. V. Sanders, “Fundamentals of Acoustics,” John Wiley & Sons Inc., New York, 1982. |