

Paper Menu >>
Journal Menu >>
 Int. J. Communications, Network and System Sciences, 2011, 4, 770-777 doi:10.4236/ijcns.2011.432095 Published Online December 2011 (http://www.SciRP.org/journal/ijcns) Copyright © 2011 SciRes. IJCNS Improved Authentication Accuracy by Individually Set Orders of the Fractional Fourier Transform and Effects of Damage of Fingerprint Image on Authentication Accuracy Reiko Iwai, Hiroyuki Yoshimura Graduate School of Engineering, Chiba University, Chiba, Japan E-mail: [email protected], [email protected] Received Octoberr 21, 2011; revised November 29, 2011; accepted December 5, 2011 Abstract Recently, ubiquitous personal devices with a fingerprint authentication function have been increasing. In such devices, there is almost no possibility of the authentication by impostors unless they are lost or stolen. However, for example, in the management of entering and leaving a building, not only the fingerprint au- thentication device but also the other authentication measures, such as an IC card, a key, etc., are generally used. In our previous studies, we have analyzed the authentication accuracy of the fingerprint authentication devices for personal possessions where other authentication measures are not needed. As a result, we made clear that the authentication accuracy in our method has extremely high compared with that in the marketed compact fingerprint authentication products, even if dirt, sebum, etc., are attached to the fingertip and there are scratches. In this study, we analyze the damage ratio of the fingerprint image where the genuine authen- tication can be conducted without problems, because the fingertip is easily got large cuts. Moreover, we analyze the impostor authentication of the fingerprint authentication devices for public possessions in the two cases of without and with other authentication measures. As a result, it is found that clearer impostor authentication can be achieved in the case of with other authentication measures. In addition, it is found that the damage ratio of the fingerprint image to conduct clearer genuine authentication without the image cor- rection is less than 14.3%. Keywords: Fractional Fourier Transform, Fingerprint Authentication, Biometrics, Personal Information Protection 1. Introduction The authentication of personal identities by fingerprints has been much researched until now. In particular, it has recently been paid attention to because of ease, cheap price and being used everywhere. In the use of a finger- print authentication system, the users do not have to re- member the fingerprint itself and there is no worry to lose it like a password, once the relevant information is registered as a fingerprint template in the system. The fingerprint, however, cannot be changed like a password if the information leaks out from the system. Moreover, the fingerprint identifier does not always have the same condition so that there is a possibility of false authentica- tion. In our previous studies [1-4], in order to solve these problems, we proposed a new data processing method using the fractional Fourier transform (FRT) [5-9] to generate the fingerprint templates. Recently, the resear- ches related to the fingerprint authentication using the FRT have been conducted to deal with the fake finger- prints, to consider the fingerprint encryption and decryp- tion algorithm for enhanced security, to consider the size of the encrypted fingerprint images for secure transmis- sion on digital communication networks, and so on [10- 12]. In our previous studies [1-4], we have assumed the fingerprint authentication devices for personal posses- sions such as cell phones, where other authentication measures such as an IC card, a key, etc., are not needed. As a result, we made clear that the authentication accu-  R. IWAI ET AL. 771 racy in our method has extremely high compared with that in the marketed compact fingerprint authentication products, even if dirt, sebum, etc., are attached to the fingertip and there are scratches. In this study, we ana- lyze the damage ratio of the fingerprint image where the genuine authentication can be conducted without prob- lems, because the fingertip is easily got large cuts. Moreover, we assume the fingerprint authentication de- vices for public possessions such as ATMs in a bank, diligence and indolence management in an office, etc., and analyze the impostor authentication in the two cases of without and with other authentication measures. Spe- cifically, 1) we compare the impostor authentication ac- curacy in the case that the FRT’s orders are fixed in each fingerprint authentication device with that in the case that the FRT’s orders are changed in each fingerprint identifier; 2) we analyze the effects of the damage, such as large cuts, in the fingerprint image on the genuine authentication accuracy. We prepare three kinds of real fingerprint images: the genuine fingerprint images; the impostor fingerprint im- ages; the genuine fingerprint images with various dam- ages such as large cuts, and focus on the peak value of the two-dimensional (2D) normalized cross-correlation function (NCF) between the intensity distributions of the FRTs (i.e., the intensity FRTs). The intensity FRT is ob- tained by extracting 256 × 256 pixels at the center part of the 2D original fingerprint image and conducting the FRTs with the random FRT’s orders in the different lines of the extracted image. Specifically, we obtain the peak values of the NCFs in the following: 1) the intensity FRT of the extracted genuine fingerprint image is registered (we call it the fingerprint template); 2) the intensity FRT of the newly scanned and extracted fingerprint image is obtained (we call it the impostor intensity FRT or the damaged genuine intensity FRT); 3) the peak value of the NCF derived from 1) and 2) is obtained. Finally, we obtain the minimum error rate (MER) by a value satis- fied with the condition the false acceptance rate (FAR) and the false rejection rate (FRR) take the same value [13]. The MER is derived from the properties of the NCFs. The authentication threshold is also decided. In Section 2, first, the generation method of the fin- gerprint templates is explained. Next, to conduct clearer impostor authentication, we compare the properties of the peak values of the NCFs between the fingerprint templates and the impostor intensity FRTs in cases of 1) the FRT’s orders to obtain the impostor FRT intensity are the same as those used to generate the fingerprint template and 2) the FRT’s orders to obtain the impostor FRT intensity are different from those used to generate the fingerprint template. In Section 3, the properties of the peak values of the NCFs between the fingerprint templates and the intensity FRTs of the damaged genuine fingerprint images caused by large cuts (i.e., the dam- aged genuine intensity FRTs) are obtained. In Section 4, we evaluate the authentication accuracy based on the MER derived from the results obtained in Sections 2 and 3. Finally, in Section 5, conclusions in our study and future study are described. 2. Properties of the Peak Values of the NCFs between the Fingerprint Templates and the Impostor Intensity FRTs In this Section, first, we explain the generation method of the fingerprint templates. Next, we obtain the peak value of the NCF between the fingerprint template and the impostor intensity FRT when the FRT’s orders used to obtain the impostor intensity FRT are the same as those used to obtain the fingerprint template, i.e., the impostor authentication accuracy in the case that the FRT’s orders are fixed in each fingerprint authentication device. We also obtain the peak value when the FRT’s orders used to obtain the impostor intensity FRT are different from those used to obtain the fingerprint template, i.e., the impostor authentication accuracy in the case that the FRT’s orders are changed in each fingerprint identifier. Finally, we analyze the mean values and the standard deviations of the NCFs in cases of the same FRT’s orders and the different ones. 2.1. Generation Method of the Fingerprint Templates In this subsection, the generation method of the finger- print templates is explained. Fingerprint images provided by the Biometric System Laboratory [14] were used as original fingerprint images. The provided fingerprint images were 880 from 110 fingertips. For each fingertip, there were 8 fingerprint images. We selected one finger- print image for each fingertip. Therefore, we used 110 original fingerprint images which were not affected by abrasion and distortion. As an example, Figure 1 visual- izes the data in the TIF format with 480 vertical and 640 horizontal pixels. In our previous study, it was clear that the fingerprint authentication accuracy is scarcely af- fected by extracted size [3]. Therefore, in this study, as depicted in Figure 2, we analyzed using the fingerprint images with 256 vertical and 256 horizontal pixels ex- tracted from the center of Figure 1. We call this image the genuine fingerprint image. The real size corresponds to 13.0 mm by 13.0 mm. In this study, as shown in Fig- ure 2, height and width of the images are called line and column, respectively. The FRT is the generalization of a conventional Fourier Copyright © 2011 SciRes. IJCNS  772 R. IWAI ET AL. Column Line Figure 1. An example of the original fingerprint image. Line FRT’s O r der p1 p2 p3 p4 p5 p255 p256 Column Figure 2. Genuine fingerprint image with 256 lines and 256 columns extracted from the center of the image shown in Figure 1. transform (FT). The FRT of the one-dimensional input data is defined as [15,16] ux 222 2 exp πtan exp2 π/sind, pp p p uxuxix x s ixx sx (1) where a constant factor has been dropped; π2p , where p is the FRT’s order; s is a constant. In particular, in the optical FRT, s is called a scale factor expressed in terms of s s f where is the wavelength and s f is an arbitrarily fixed focal length. In this study, the value of s was fixed at 1.0. In particular, p takes a value of 4n + 1, n being any integer, the FRT corresponds to the conventional FT. The intensity FRT, p p I x, is ob- tained by calculating 2 pp In this study, the grayscale distribution in one line of a genuine fingerprint image shown in Figure 2 could be regarded as a wave pattern. The FRT was performed using Equation (1) in each line of the image by changing the FRT’s order randomly and the intensity FRT distri- butions with the different FRT’s orders in different lines were obtained. In Figure 2, the FRT’s orders are ex- pressed in terms of p1, p2, , p256 and take values from 0.1 to 1.9 because this range has been thought to be the best performance in our processing method [4]. ux . Figure 3 shows the intensity FRT of the genuine fin- gerprint image shown in Figure 2. In this study, this im- age is called the fingerprint template. The peak value of the fingerprint template is 1.18 × 10⁶. We prepared 110 fingerprint templates. 2.2. Peak Value of the NCF between the Fingerprint Template and the Impostor Intensity FRT in Case of the Same FRT’s Orders In this subsection, we obtain the peak value of the NCF between the fingerprint template and the impostor inten- sity FRT, when the FRT’s orders used to obtain the im- postor intensity FRT are the same as those used to obtain the fingerprint template. Figure 4 illustrates an example of the impostor fingerprint image with 256 lines and 256 columns. Figure 5 shows the impostor intensity FRT of Figure 4. The peak value is 3.23 × 10⁶. Figure 6 illustrates the NCF between the fingerprint template shown in Figure 3 and the imposter intensity FRT shown in Figure 5. The peak value is 0.703 and this means that the identification between a genuine person and an impostor person can be conducted correctly Figure 3. Fingerprint template of the genuine fingerprint image shown in Figure 2. Column Line Figure 4. Impostor finger print image with 256 lines and 256 columns. Copyright © 2011 SciRes. IJCNS 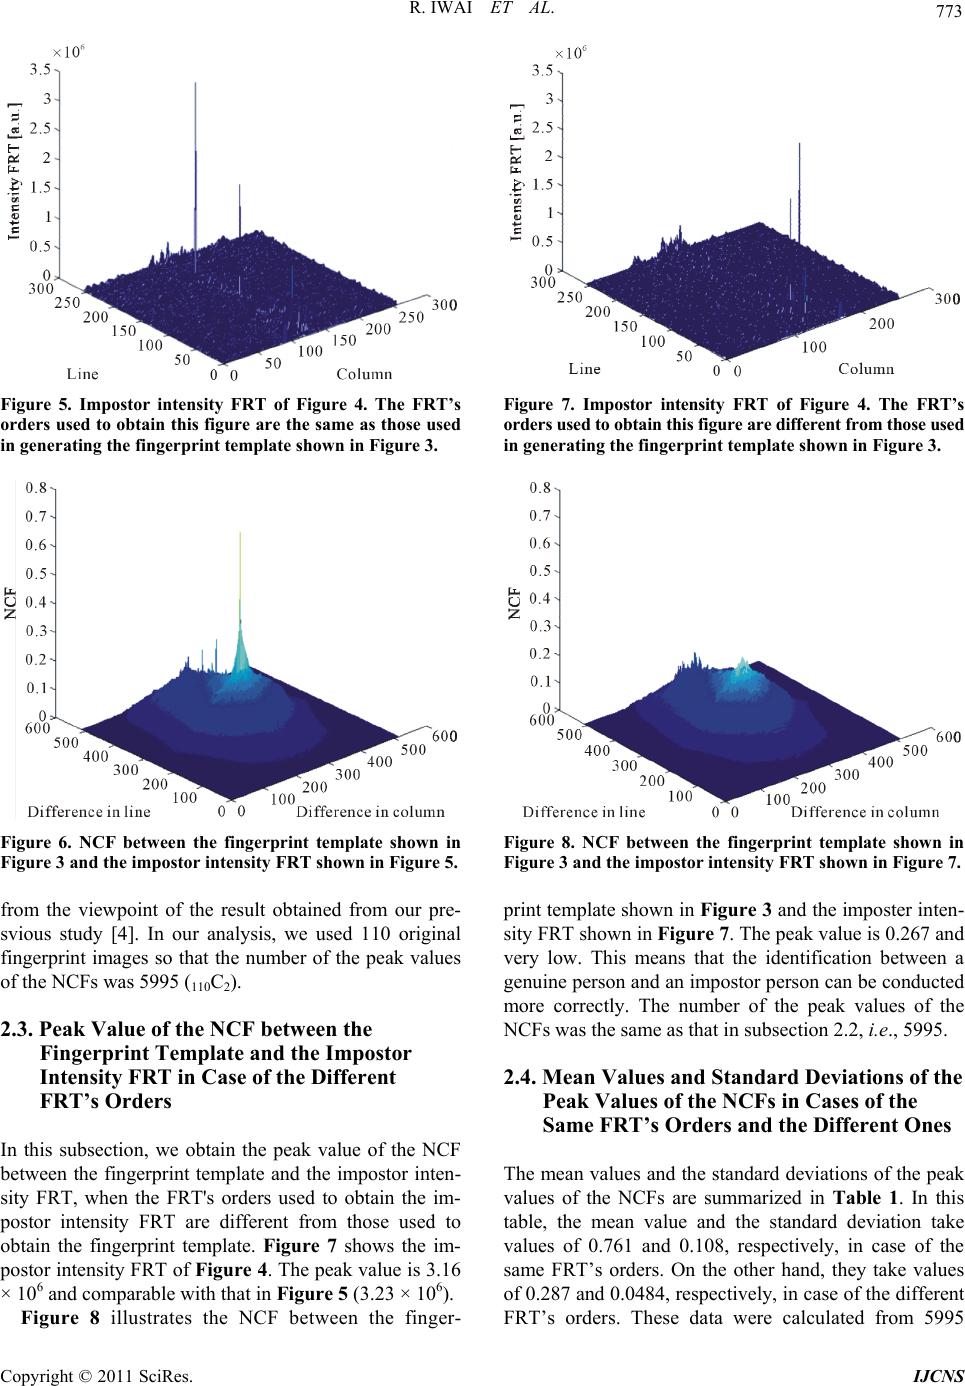 R. IWAI ET AL. 773 Figure 5. Impostor intensity FRT of Figure 4. The FRT’s orders used to obtain this figure are the same as those used in generating the fingerprint template shown in Figure 3. Figure 6. NCF between the fingerprint template shown in Figure 3 and the impostor intensity FRT shown in Figure 5. from the viewpoint of the result obtained from our pre- svious study [4]. In our analysis, we used 110 original fingerprint images so that the number of the peak values of the NCFs was 5995 (110C2). 2.3. Peak Value of the NCF between the Fingerprint Template and the Impostor Intensity FRT in Case of the Different FRT’s Orders In this subsection, we obtain the peak value of the NCF between the fingerprint template and the impostor inten- sity FRT, when the FRT's orders used to obtain the im- postor intensity FRT are different from those used to obtain the fingerprint template. Figure 7 shows the im- postor intensity FRT of Figure 4. The peak value is 3.16 × 10⁶ and comparable with that in Figure 5 (3.23 × 10⁶). Figure 8 illustrates the NCF between the finger- Figure 7. Impostor intensity FRT of Figure 4. The FRT’s orders used to obtain this figure are different from those used in generating the fingerprint template shown in Figure 3. Figure 8. NCF between the fingerprint template shown in Figure 3 and the impostor intensity FRT shown in Figure 7. print template shown in Figure 3 and the imposter inten- sity FRT shown in Figure 7. The peak value is 0.267 and very low. This means that the identification between a genuine person and an impostor person can be conducted more correctly. The number of the peak values of the NCFs was the same as that in subsection 2.2, i.e., 5995. 2.4. Mean Values and Standard Deviations of the Peak Values of the NCFs in Cases of the Same FRT’s Orders and the Different Ones The mean values and the standard deviations of the peak values of the NCFs are summarized in Table 1. In this table, the mean value and the standard deviation take values of 0.761 and 0.108, respectively, in case of the same FRT’s orders. On the other hand, they take values of 0.287 and 0.0484, respectively, in case of the different FRT’s orders. These data were calculated from 5995 Copyright © 2011 SciRes. IJCNS 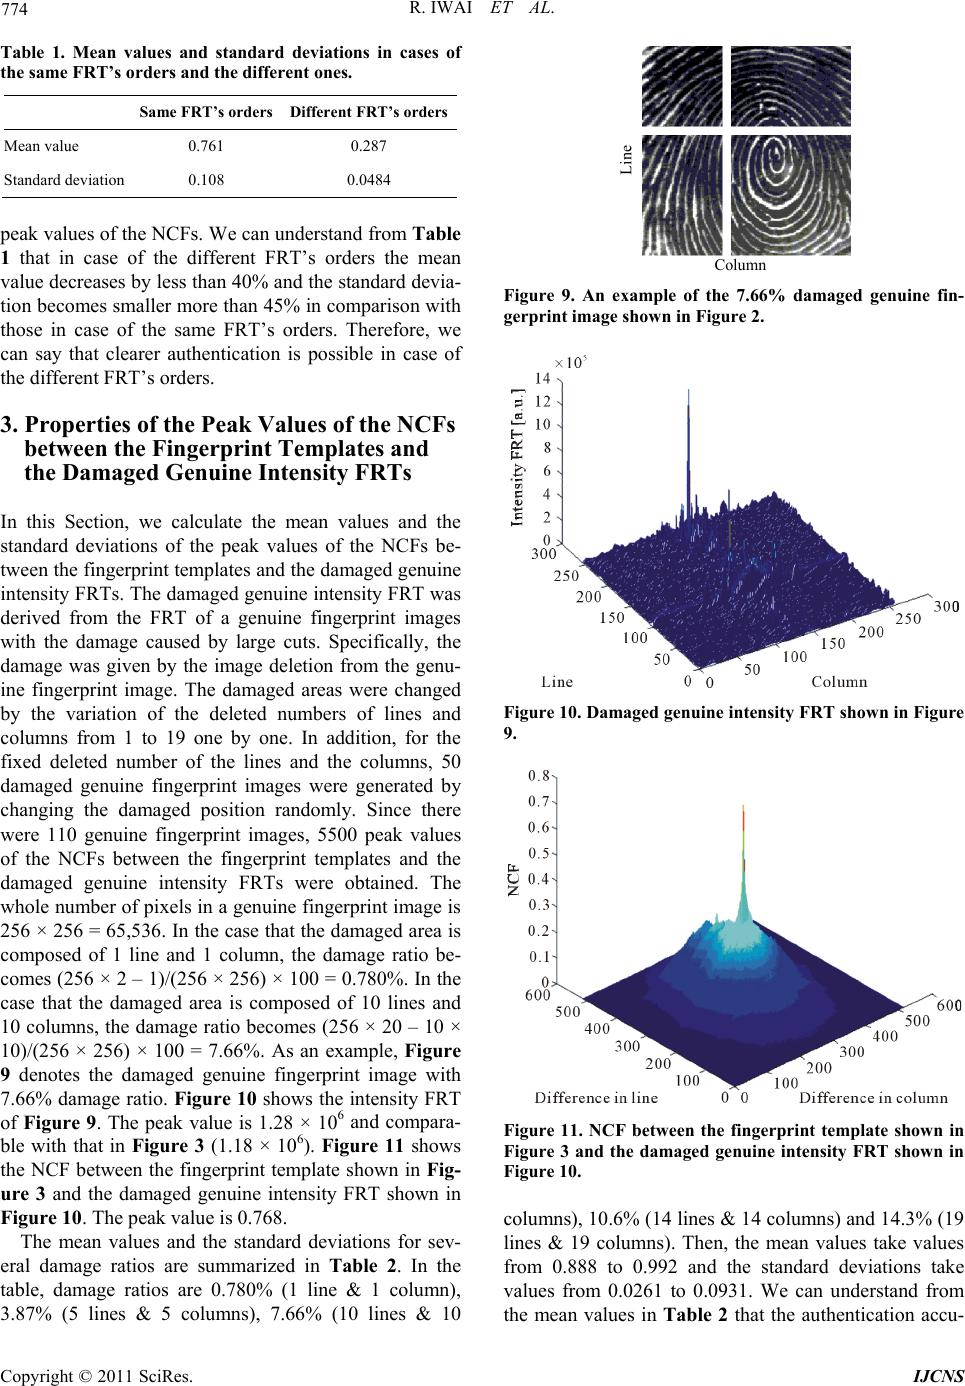 774 R. IWAI ET AL. Table 1. Mean values and standard deviations in cases of the same FRT’s orders and the different ones. Same FRT’s orders Different FRT’s orders Mean value 0.761 0.287 Standard deviation 0.108 0.0484 peak values of the NCFs. We can understand from Table 1 that in case of the different FRT’s orders the mean value decreases by less than 40% and the standard devia- tion becomes smaller more than 45% in comparison with those in case of the same FRT’s orders. Therefore, we can say that clearer authentication is possible in case of the different FRT’s orders. 3. Properties of the Peak Values of the NCFs between the Fingerprint Templates and the Damaged Genuine Intensity FRTs In this Section, we calculate the mean values and the standard deviations of the peak values of the NCFs be- tween the fingerprint templates and the damaged genuine intensity FRTs. The damaged genuine intensity FRT was derived from the FRT of a genuine fingerprint images with the damage caused by large cuts. Specifically, the damage was given by the image deletion from the genu- ine fingerprint image. The damaged areas were changed by the variation of the deleted numbers of lines and columns from 1 to 19 one by one. In addition, for the fixed deleted number of the lines and the columns, 50 damaged genuine fingerprint images were generated by changing the damaged position randomly. Since there were 110 genuine fingerprint images, 5500 peak values of the NCFs between the fingerprint templates and the damaged genuine intensity FRTs were obtained. The whole number of pixels in a genuine fingerprint image is 256 × 256 = 65,536. In the case that the damaged area is composed of 1 line and 1 column, the damage ratio be- comes (256 × 2 – 1)/(256 × 256) × 100 = 0.780%. In the case that the damaged area is composed of 10 lines and 10 columns, the damage ratio becomes (256 × 20 – 10 × 10)/(256 × 256) × 100 = 7.66%. As an example, Figure 9 denotes the damaged genuine fingerprint image with 7.66% damage ratio. Figure 10 shows the intensity FRT of Figure 9. The peak value is 1.28 × 10⁶ and compara- ble with that in Figure 3 (1.18 × 10⁶). Figure 11 shows the NCF between the fingerprint template shown in Fig- ure 3 and the damaged genuine intensity FRT shown in Figure 10. The peak value is 0.768. The mean values and the standard deviations for sev- eral damage ratios are summarized in Table 2. In the table, damage ratios are 0.780% (1 line & 1 column), 3.87% (5 lines & 5 columns), 7.66% (10 lines & 10 Column Line Figure 9. An example of the 7.66% damaged genuine fin- gerprint image shown in Figure 2. Figure 10. Damaged genuine intensity FRT shown in Figure 9. Figure 11. NCF between the fingerprint template shown in Figure 3 and the damaged genuine intensity FRT shown in Figure 10. columns), 10.6% (14 lines & 14 columns) and 14.3% (19 lines & 19 columns). Then, the mean values take values from 0.888 to 0.992 and the standard deviations take values from 0.0261 to 0.0931. We can understand from the mean values in Table 2 that the authentication accu- Copyright © 2011 SciRes. IJCNS 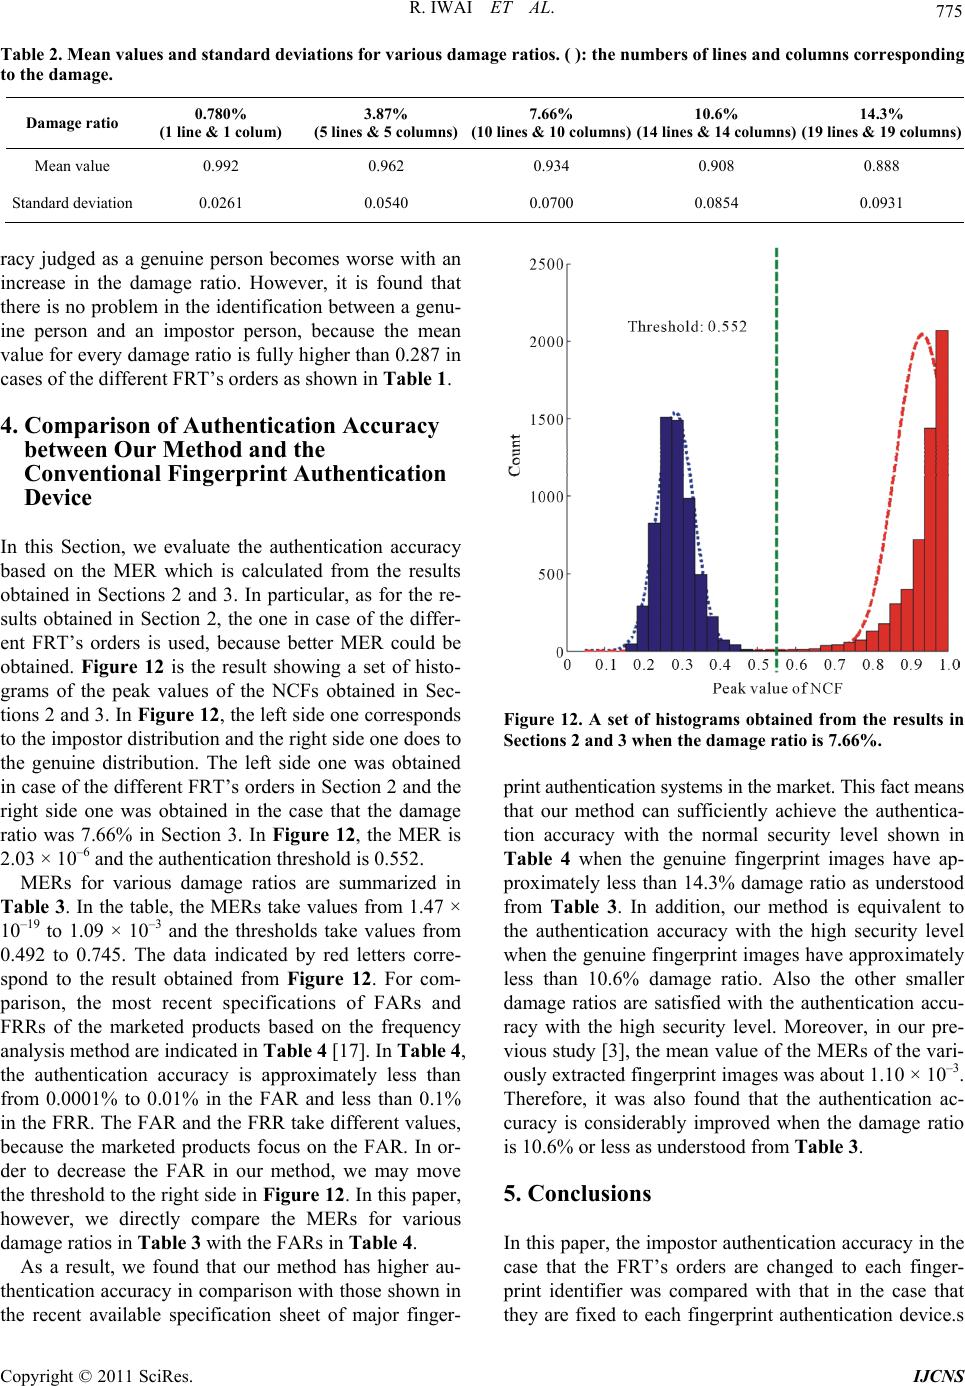 R. IWAI ET AL. Copyright © 2011 SciRes. IJCNS 775 Table 2. Mean values and standard deviations for various damage ratios. ( ): the numbers of lines and columns corresponding to the damage. Damage ratio 0.780% (1 line & 1 colum) 3.87% (5 lines & 5 columns)7.66% (10 lines & 10 columns)10.6% (14 lines & 14 columns) 14.3% (19 lines & 19 columns) Mean value 0.992 0.962 0.934 0.908 0.888 Standard deviation 0.0261 0.0540 0.0700 0.0854 0.0931 racy judged as a genuine person becomes worse with an increase in the damage ratio. However, it is found that there is no problem in the identification between a genu- ine person and an impostor person, because the mean value for every damage ratio is fully higher than 0.287 in cases of the different FRT’s orders as shown in Table 1. 4. Comparison of Authentication Accuracy between Our Method and the Conventional Fingerprint Authentication Device In this Section, we evaluate the authentication accuracy based on the MER which is calculated from the results obtained in Sections 2 and 3. In particular, as for the re- sults obtained in Section 2, the one in case of the differ- ent FRT’s orders is used, because better MER could be obtained. Figure 12 is the result showing a set of histo- grams of the peak values of the NCFs obtained in Sec- tions 2 and 3. In Figure 12, the left side one corresponds to the impostor distribution and the right side one does to the genuine distribution. The left side one was obtained in case of the different FRT’s orders in Section 2 and the right side one was obtained in the case that the damage ratio was 7.66% in Section 3. In Figure 12, the MER is 2.03 × 10⁻⁶ and the authentication threshold is 0.552. Figure 12. A set of histograms obtained from the results in Sections 2 and 3 when the damage ratio is 7.66%. print authentication systems in the market. This fact means that our method can sufficiently achieve the authentica- tion accuracy with the normal security level shown in Table 4 when the genuine fingerprint images have ap- proximately less than 14.3% damage ratio as understood from Table 3. In addition, our method is equivalent to the authentication accuracy with the high security level when the genuine fingerprint images have approximately less than 10.6% damage ratio. Also the other smaller damage ratios are satisfied with the authentication accu- racy with the high security level. Moreover, in our pre- vious study [3], the mean value of the MERs of the vari- ously extracted fingerprint images was about 1.10 × 10⁻³. Therefore, it was also found that the authentication ac- curacy is considerably improved when the damage ratio is 10.6% or less as understood from Table 3. MERs for various damage ratios are summarized in Table 3. In the table, the MERs take values from 1.47 × 10⁻¹⁹ to 1.09 × 10⁻³ and the thresholds take values from 0.492 to 0.745. The data indicated by red letters corre- spond to the result obtained from Figure 12. For com- parison, the most recent specifications of FARs and FRRs of the marketed products based on the frequency analysis method are indicated in Table 4 [17]. In Table 4, the authentication accuracy is approximately less than from 0.0001% to 0.01% in the FAR and less than 0.1% in the FRR. The FAR and the FRR take different values, because the marketed products focus on the FAR. In or- der to decrease the FAR in our method, we may move the threshold to the right side in Figure 12. In this paper, however, we directly compare the MERs for various damage ratios in Table 3 with the FARs in Table 4. 5. Conclusions In this paper, the impostor authentication accuracy in the case that the FRT’s orders are changed to each finger- print identifier was compared with that in the case that they are fixed to each fingerprint authentication device.s As a result, we found that our method has higher au- thentication accuracy in comparison with those shown in the recent available specification sheet of major finger- 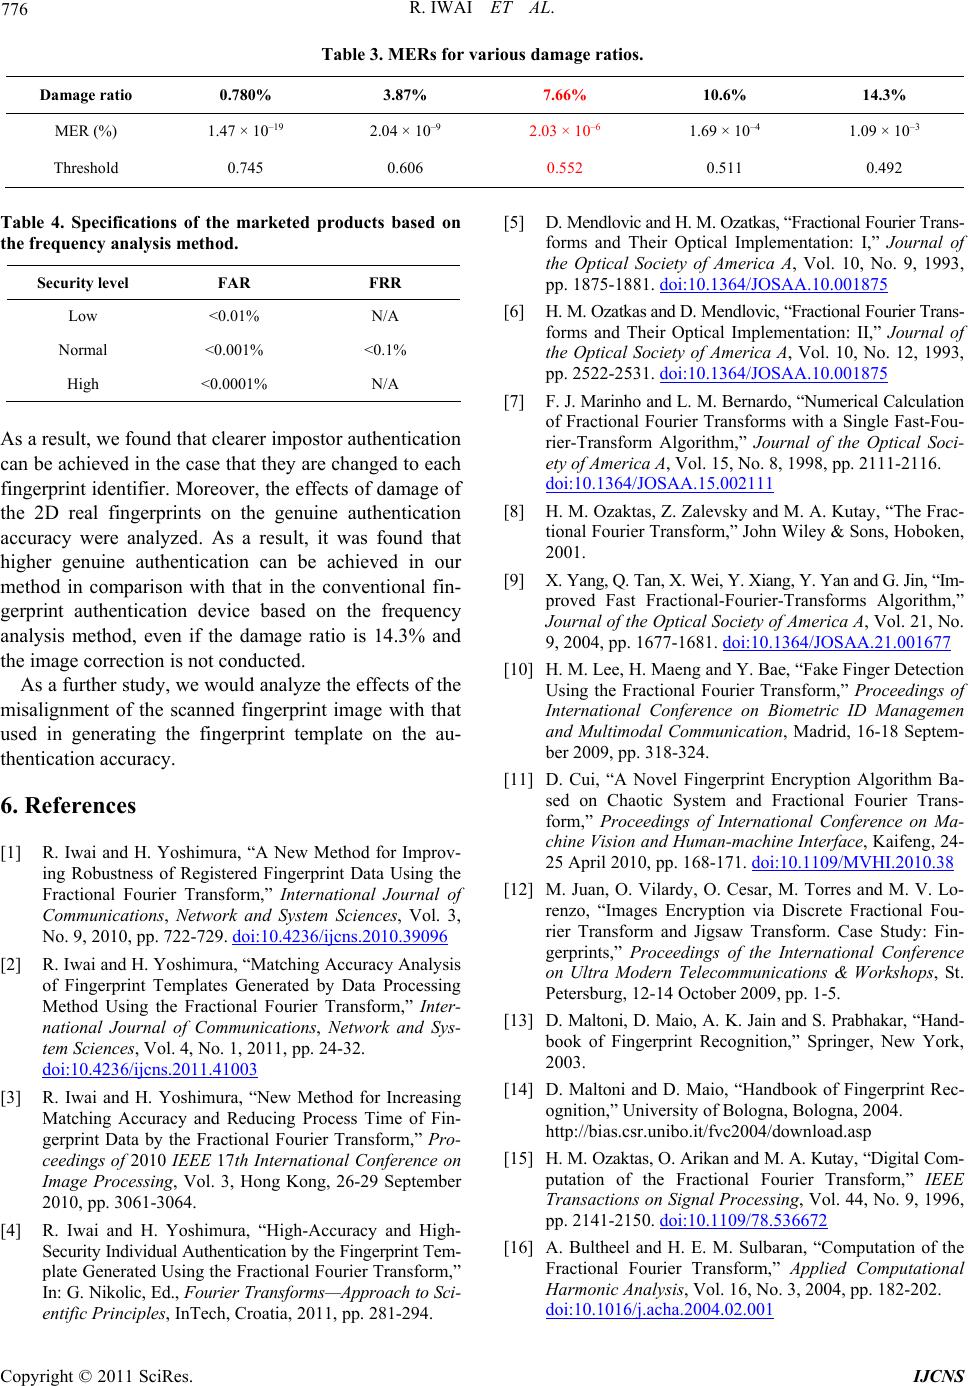 776 R. IWAI ET AL. Table 3. MERs for various damage ratios. Damage ratio 0.780% 3.87% 7.66% 10.6% 14.3% MER (%) 1.47 × 10⁻¹⁹ 2.04 × 10⁻⁹ 2.03 × 10⁻⁶ 1.69 × 10⁻⁴ 1.09 × 10⁻³ Threshold 0.745 0.606 0.552 0.511 0.492 Table 4. Specifications of the marketed products based on the frequency analysis method. Security level FAR FRR Low <0.01% N/A Normal <0.001% <0.1% High <0.0001% N/A As a result, we found that clearer impostor authentication can be achieved in the case that they are changed to each fingerprint identifier. Moreover, the effects of damage of the 2D real fingerprints on the genuine authentication accuracy were analyzed. As a result, it was found that higher genuine authentication can be achieved in our method in comparison with that in the conventional fin- gerprint authentication device based on the frequency analysis method, even if the damage ratio is 14.3% and the image correction is not conducted. As a further study, we would analyze the effects of the misalignment of the scanned fingerprint image with that used in generating the fingerprint template on the au- thentication accuracy. 6. References [1] R. Iwai and H. Yoshimura, “A New Method for Improv- ing Robustness of Registered Fingerprint Data Using the Fractional Fourier Transform,” International Journal of Communications, Network and System Sciences, Vol. 3, No. 9, 2010, pp. 722-729. doi:10.4236/ijcns.2010.39096 [2] R. Iwai and H. Yoshimura, “Matching Accuracy Analysis of Fingerprint Templates Generated by Data Processing Method Using the Fractional Fourier Transform,” Inter- national Journal of Communications, Network and Sys- tem Sciences, Vol. 4, No. 1, 2011, pp. 24-32. doi:10.4236/ijcns.2011.41003 [3] R. Iwai and H. Yoshimura, “New Method for Increasing Matching Accuracy and Reducing Process Time of Fin- gerprint Data by the Fractional Fourier Transform,” Pro- ceedings of 2010 IEEE 17th International Conference on Image Processing, Vol. 3, Hong Kong, 26-29 September 2010, pp. 3061-3064. [4] R. Iwai and H. Yoshimura, “High-Accuracy and High- Security Individual Authentication by the Fingerprint Tem- plate Generated Using the Fractional Fourier Transform,” In: G. Nikolic, Ed., Fourier Transforms—Approach to Sci- entific Principles, InTech, Croatia, 2011, pp. 281-294. [5] D. Mendlovic and H. M. Ozatkas, “Fractional Fourier Trans- forms and Their Optical Implementation: I,” Journal of the Optical Society of America A, Vol. 10, No. 9, 1993, pp. 1875-1881. doi:10.1364/JOSAA.10.001875 [6] H. M. Ozatkas and D. Mendlovic, “Fractional Fourier Trans- forms and Their Optical Implementation: II,” Journal of the Optical Society of America A, Vol. 10, No. 12, 1993, pp. 2522-2531. doi:10.1364/JOSAA.10.001875 [7] F. J. Marinho and L. M. Bernardo, “Numerical Calculation of Fractional Fourier Transforms with a Single Fast-Fou- rier-Transform Algorithm,” Journal of the Optical Soci- ety of America A, Vol. 15, No. 8, 1998, pp. 2111-2116. doi:10.1364/JOSAA.15.002111 [8] H. M. Ozaktas, Z. Zalevsky and M. A. Kutay, “The Frac- tional Fourier Transform,” John Wiley & Sons, Hoboken, 2001. [9] X. Yang, Q. Tan, X. Wei, Y. Xiang, Y. Yan and G. Jin, “Im- proved Fast Fractional-Fourier-Transforms Algorithm,” Journal of the Optical Society of America A, Vol. 21, No. 9, 2004, pp. 1677-1681. doi:10.1364/JOSAA.21.001677 [10] H. M. Lee, H. Maeng and Y. Bae, “Fake Finger Detection Using the Fractional Fourier Transform,” Proceedings of International Conference on Biometric ID Managemen and Multimodal Communication, Madrid, 16-18 Septem- ber 2009, pp. 318-324. [11] D. Cui, “A Novel Fingerprint Encryption Algorithm Ba- sed on Chaotic System and Fractional Fourier Trans- form,” Proceedings of International Conference on Ma- chine Vision and Human-machine Interface, Kaifeng, 24- 25 April 2010, pp. 168-171. doi:10.1109/MVHI.2010.38 [12] M. Juan, O. Vilardy, O. Cesar, M. Torres and M. V. Lo- renzo, “Images Encryption via Discrete Fractional Fou- rier Transform and Jigsaw Transform. Case Study: Fin- gerprints,” Proceedings of the International Conference on Ultra Modern Telecommunications & Workshops, St. Petersburg, 12-14 October 2009, pp. 1-5. [13] D. Maltoni, D. Maio, A. K. Jain and S. Prabhakar, “Hand- book of Fingerprint Recognition,” Springer, New York, 2003. [14] D. Maltoni and D. Maio, “Handbook of Fingerprint Rec- ognition,” University of Bologna, Bologna, 2004. http://bias.csr.unibo.it/fvc2004/download.asp [15] H. M. Ozaktas, O. Arikan and M. A. Kutay, “Digital Com- putation of the Fractional Fourier Transform,” IEEE Transactions on Signal Processing, Vol. 44, No. 9, 1996, pp. 2141-2150. doi:10.1109/78.536672 [16] A. Bultheel and H. E. M. Sulbaran, “Computation of the Fractional Fourier Transform,” Applied Computational Harmonic Analysis, Vol. 16, No. 3, 2004, pp. 182-202. doi:10.1016/j.acha.2004.02.001 Copyright © 2011 SciRes. IJCNS  R. IWAI ET AL. 777 [17] DDS Co., Ltd., “Hybrid Biometric Authentication Device, Hybrid Biometric Authentication Method, and Compu- ter-Readable Storage Medium Where Computer Program for Hybrid Biometric Authentication Is Stored,” WO 2009/096475 A1, 2009. http://www.freepatentsonline.com/WO2009096475.pdf Copyright © 2011 SciRes. IJCNS |