

Paper Menu >>
Journal Menu >>
 Vol.2, No.3, 131-138 (2010) Natural Science http://dx.doi.org/10.4236/ns.2010.23022 Copyright © 2010 SciRes. OPEN ACCESS Investigation of nonlinear temperature distribution in biological tissues by using bioheat transfer equation of Pennes’ type Ahmed Lakhssassi1, Emmanuel Kengne1*, Hicham Semmaoui2 1LIMA – Laboratoire d’Ingénierie des Microsystèmes Avancés, Département d’informatique et d’ingénierie, Université du Québec en Outaouais, Gatineau, Canada; [email protected] 2Department of Electrical Engineering, Polytechnique, University of Montrea, Montreal, Canada Received 14 December 2009; revised 8 January 2010; accepted 30 January 2010. ABSTRACT In this paper, a two level finite difference scheme of Crank-Nicholson type is constructed and used to numerically investigate nonlinear temperature distribution in biological tissues described by bioheat transfer equation of Pennes’ type. For the equation under consideration, the thermal conductivity is either depth-dependent or tem- perature-dependent, while blood perfusion is temperature-dependent. In both cases of depth- dependent and temperature-dependent thermal conductivity, it is shown that blood perfusion decreases the temperature of the living tissue. Our numerical simulations show that neither the localization nor the magnitude of peak tempera- ture is affected by surface temperature; however, the width of peak temperature increases with surface temperature. Keywords: Bioheat Transfer Equation of Pennes Type; Pennes’ Bioheat Transfer Equation; Modified Crank-Nicholson Method; Two-Level Finite Difference Scheme 1. INTRODUCTION The evaluation of thermal conductivities in living tis- sues is a very complex process which involves several phenomenological mechanisms, such as heat transfer due to perfusion of the arterial-venous blood through the pores of the tissue (blood convection), heat con- duction in tissues, metabolic heat generation and ex- ternal interactions, such as electromagnetic radiation emitted from cell phones, evaporation, metabolism, etc. The heat transfer mechanism in biological tissues is important for therapeutic practices, such as cancer hy- perthermia, burn injury, brain hypothermia resuscita- tion, disease diagnostics, cryosurgery, etc. Many of the bioheat transfer problems have been modeled using Pennes’ equation [1], which accounts for the ability of tissue to remove heat by both passive conduction (diffusion) and perfusion of tissue by blood. Perfusion is defined as the nonvectorial volumetric blood flow per tissue volume in a region that contains sufficient capillaries that an average flow description is considered reasonable. Pennes’ model was adapted by many biologists for the analysis of various heat transfer phenomena in a living body [2-7]. Others, after evaluations of the Pennes model in specifical situations, have concluded that many of the hypotheses (foundational to the model) are not valid. Then these latter modified and generalized the model to adequate systems [8-11]. To analyze nonlinear temperature dis- tribution in living tissues, it is sometime useful to modify the one-dimensional (1D) Pennes’ bioheat trans- fer equation by adding nonlinear terms, which gener- ally account for temperature-dependent variability in tissue perfusion (see for example [12]). To treat the system of motion in living bodies, we have written the transient 1D bioheat transfer type model in a generalized form as follows [13], ,0,, * ** Lxtxp QuTc x u k xt u cmbmb (1) where x is the distance from the surface to the body core (in m), t is the time (in s), kc ,, are the density (in gm/m³), specific heat (in cal/gm°C) and thermal conductivity of tissue (in cal/m×s×°C), respectively and b c, is the specific heat of blood (in cal/gm °C), b is the density of blood (in gm/m³), m Q is the metabolic heat production per volume, m is the nondirectional mass flow (in gm×s/m³) associated with perfusion so that / bm b Tc Tc is the perfusion coeffi- cient, and txp , is the heat deposited per volume due *E. Kengne dedicates this work to his son Kengneson Fred Jake Sado  A. Lakhssassi et al. / Natural Science 2 (2010) 131-138 Copyright © 2010 SciRes. OPEN ACCESS 132 to spatially distributed heating. * s uTT is the ele- vated temperature (in °C) in the x -direction, where T represents the temperature distribution (in °C) in the x -direction and s T represents the skin’s steady state temperature (in °C). L is the distance (in m) between the skin surface and the body core. In this general form, m is a function of temperature to in- clude the specific case of temperature dependent per- fusion. We assume that the thermal conductivity k satisfies k , where and are two posi- tive constants. The form of the perfusion coefficient T , which incorporates the heat capacity and density of blood and tissue, depends on the characteristics of the response. For a temperature response without an overshoot, the perfusion is defined as a spatially averaged constant, i.e., 0,T where 0 is the steady-state per- fusion at a constant heat flux. With an overshoot re- sponse, we assume that the perfusion increases with time because of vasodilation and capillary recruitment with a higher temperature. For Pennes’ model ,pxt is constant andm /, bb where b is the blood perfusion rate. In this case the second term on the right-hand side of the state Eq.1 describes the heat transport between the tissue and the microcirculatory blood perfusion. In biological modeling, the nondirectional mass flow m associated with perfusion is of form m / bb F T * /uand ,pxt is null, where F T is a function which can be chosen as a polynomial function of the temperature. The model used in this paper is the following nonlinear bioheat transfer equation ,0, 2 1 * ** LxQ c Q TT uc x u k xt u c m bb m s bbb (2) which is a special case of Eq.1 In this equation b and 1 are referred to as the temperature independent (basal) perfusion component and the temperature de- pendent (vasodilation and angiogenesis) perfusion component, respectively. This model is based on a one-dimensional Pennes bioheat transfer equation and is modified to account for temperature-dependent variability in tissue perfusion [12]. Assuming the metabolic heat production m Q to be constant and denoting ,/ * bbm cQuu we obtain the following simplified form of Eq.2. ,0, 2Lxuu x u k x t u (3) where ,/1 c ,/cc bbb and .0/ 1 c Then the perfusion coefficient is .uu Be- side the differential equation, initial and boundary conditions determine the temperature distribution. Eq.3 can be written, in steady-state form, as x u kx 2,uu which, in the case of constant thermal conductivity k, reads . 2 2 2 u k u k dx ud (4) The first integral of Eq.4 is given by , 63 223 2 k u k u kdx du (5) where is a constant of integration. Eq.5 is an el- liptic ordinary differential equation. This equation can be solved using Weierstrass’ elliptic function method [14]. For either 23/2 or 3 200 /2 343 , its particular solutions are x k x k xu 4 cos2 4 cos23 2 2 and , 8 5 , 7 2 14 8 5 , 7 2 59 2 2 x k cn x k cn xu respectively, where mxcn , denotes the Jacobi ellitic cosine function with modulus m. Mathematically, solving bioheat transfer equation requires knowledge of both the initial and boundary conditions applicable to the case under study. The ini- tial conditions describe the state of the biological sys- tem at time, 0 t while the boundary conditions give information both on the surface 0xand at depth .Lx In this work, we use the following initial and boundary conditions. The initial condition is that a biological tissue has a uniform temperature at the steady-state temperature of the biological tissue as in .;0 xuut b (6) Boundary conditions include a constant temperature  A. Lakhssassi et al. / Natural Science 2 (2010) 131-138 Copyright © 2010 SciRes. OPEN ACCESS 133 on the tissue surface whereas no heat flow is assumed at the boundary :Lx 0,0 , ,,0 t x tLu utu surf (7) s urf u being the surface temperature of the biological tissue. Restricting ourselves to nonnegative ,,uxt we follow Zhao et al. [15] and construct a two level finite difference scheme for (3) which has the same order of accuracy. As in [15] our scheme requires only one ini- tial condition and is also unconditionally stable and convergent. The rest of the paper is organized as fol- lows: in Section 2 we construct a finite difference scheme for the modified Pennes Eq.3 and prove its solvability. Numerical experiments are reported in Section 3, while a brief summary of the results is done in Section 4. 2. NUMERICAL SCHEME The main difficulties in numerical solving the bioheat transfer Eq.3 are the nonlinearity due to the perfusion term and the different material properties of the tissue. Using a modified Crank-Nicholson method (see the description below), we are able to integrate the heat equation efficiently. Within this approach, the approxi- mate elevated temperature n u at time n t is con- structed by a combination of previous elevated tempera- ture 1n u at time 1. n t For the numerical computation of the nonlinear heat transfer Eq. 3 with initial and boundary conditions (6) and (7) we use h to represent the space mesh and to represent the time step so that x will be incremented by h and t by . We choose an integer N and h such that .NhL We construct a finite difference scheme for (3) by using the second-order central differ- ence scheme in space and a scheme of Crank-Nicholson [16] type in time. In what follows, n j u denotes the ap- proximate elevated temperature at time n t at depth : j x ,. nn jj uuxt If x denotes the central difference operator, the discretization scheme is then 1 11 1 22 2 nn jj nnnnn jjj jj uu uuuuu 1 1/2 1/2 ,,, nn xjnxjxjnxj kxt ukxt u 1 00 0, , 0. nn nNN jN uu uu h The difference scheme then takes the form , , , 22 22 1 22 2 22 1 2 1 100 1 1 2 1 1 1 2 1 1 1 1 1 1 2 1 1 2 1 1 2 1 1 1 11 2 1 n N n N n n j n j n j n j n j n j n j n j n j n j n j n j n j n j n j n j uuuu u h k u h kk u uu h k u h k h kk uu h k (8) where ., ntjhxkk n j n j The truncation error of this difference schemes in of order 22 hO for each interior grid point 1,, ntxn j and .0 Nj In matrix form, the difference scheme (8) reads ..., 2, 1,n ,uu1 n R n Lnn QQ (9) where the vector T n N nnnnuuuu ,...,,, 210 u represents the numerical solutions at the time level )),,(( n j n j ntxut n L Q (left-hand side matrix depending on n) and n R Q (right-hand side matrix depending on n) are both square tridiagonal matrices of dimension N+1 of the form , and other for ,0 ,1 if ,)2/( , 2 22 1 ,1 if ,)2/( },1,1{ if ,1 2 2 1 1 1 1 2 qp pqkh h kk u pqkh Nqp Q n p n p n p n p n p Ln . and other for ,0 ,1 if ,)2/( , if , 2 22 1 ,1 if ,)2/( ,1 if ,1 ,1 if ,0 12 2 11 1 1 1 1 1 2 qp pqkh pq h kk u pqkh Nqp qp Q n p n p n p n p n p Rn In other words, 0 22 1 2 0 01 1 11 2 n j n j Luk h Qn  A. Lakhssassi et al. / Natural Science 2 (2010) 131-138 Copyright © 2010 SciRes. OPEN ACCESS 134 , 10 22 0 1 22 1 n j n j n jk hh kk 0 22 1 2 0 00 1 1 1 1 2 n j n j Ruk h Qn . 10 22 0 1 1 22 11 1 n j n j n jk hh kk Theorem (on the solvability of system (9)). System (9) is unconditionally solvable for each time step .n Proof. It is sufficient to show that matrix n L Q is inversible. From the expression for n L Q we have ,0 22 1 ;01Q ;01 1 1 1 ,1 1 !11 L 1 2 111 n n p N pqq pq L pp L N q qN L NN N q q L uQQ QQQ nn nn n L So that matrix n L Q is diagonally dominant. By Ger- shgorin’s theorem [17] we conclude that the matrix n L Q is invertible. This proves the theorem. 3. NUMERICAL EXPERIMENTS For the numerical experiments we use mL 01208.0 and 4200000/1 [18]. Because our main aim in this work is the impact of the nonlinear term on the tem- perature distribution, we will work with different choices of nonlinear coefficient . As initial elevated tempera- ture ,xuB we use one of the functions 1 0 uxuB u xx/exp and ,/exp1/ 0 uB xxuxu where 0 u and u x are two constants. The thermal conductiv- ity of tissue k is taken to be either a function of , x namely, 9.01.11210000 2 xxxk or a linear func- tion of the elevated temperature, namely, , 10ukkk with 0.4574k0 and 0.001403k1 (see [19]). To analyze the effects of the blood perfusion, we used the following three couples , of parameters ,01.0,009.0 ,010.0005,0.0 and .02.0,005.0 3.1. Effects of Blood Perfusion, Thermal Conductivity, and Initial Elevated Temperature To analyze the effects of the blood perfusion, we used the following three couples , of parameters ,01.0,009.0 ,010.0005,0.0 and .02.0,005.0 The ca- lculation results of the influences of the blood perfu- sion, the thermal conductivity, and the initial elevated temperature on the temperature distribution are shown in Figures l-4. Figures 1 and 3 and Figures 2 and 4 are obtained with the initial conditions 01 B ux u 1exp / u x x , respectively, with1/200, u x 01 6,u and 02 u 12.928. For all these figures, we used 0. surf B uu Plot (a) gives the elevated temperature profile along the x direction at time 5.2,ts while plot (b) shows the elevated temperature profile along the t direction at depth .01148.0 mx Plots (c) and (d) are obtained with , 0.005,0.02 and show the elevated temperature along the x -direction for different times t and along the t -direction for different depths x , respectively. Plots (e) and (f) show the elevated tem- perature for temperature-dependent (plot (1)) and depth-dependent (plot (2)) thermal conductivity .k Here, we used the parameter , 0.005,0.02 Figures 1 and 2 give the elevated temperature when the thermal conductivity of tissue k is a function of dis- tance x. In Figure 1(a) and (b), as well as in Figure 2(a) and (b), the results show that the higher the blood perfu- sion is, the lower is the elevated temperature. In other words, to decrease the temperature in the living tissue, it is sufficient to increase the blood perfusion. As in the case of x -dependent thermal conductivity, plots (a) and (b) of Figures 3 and 4 show that, in the case of temperature-dependent thermal conductivity, the higher the blood perfusion is, the lower is the elevated temperature. We may then conclude from Figures 1-4 that the effect of the blood perfusion is to decrease the temperature in the living tissue. Figures 1(c) and (d) and Figure 3(c) and (d) show that the peak temperature is a decreasing function of both depth and time. When the initial temperature of the living tissue is a decreasing function of depth x (Figures 1 and 3), a phenomenon of heating (in the sense that the temperature is almost above the initial temperature) is observed both in depth and time, and the peak tempera- ture at any depth is above the initial temperature (see plots (c) and (d) of Figures 1 and 3). To the contrary, a 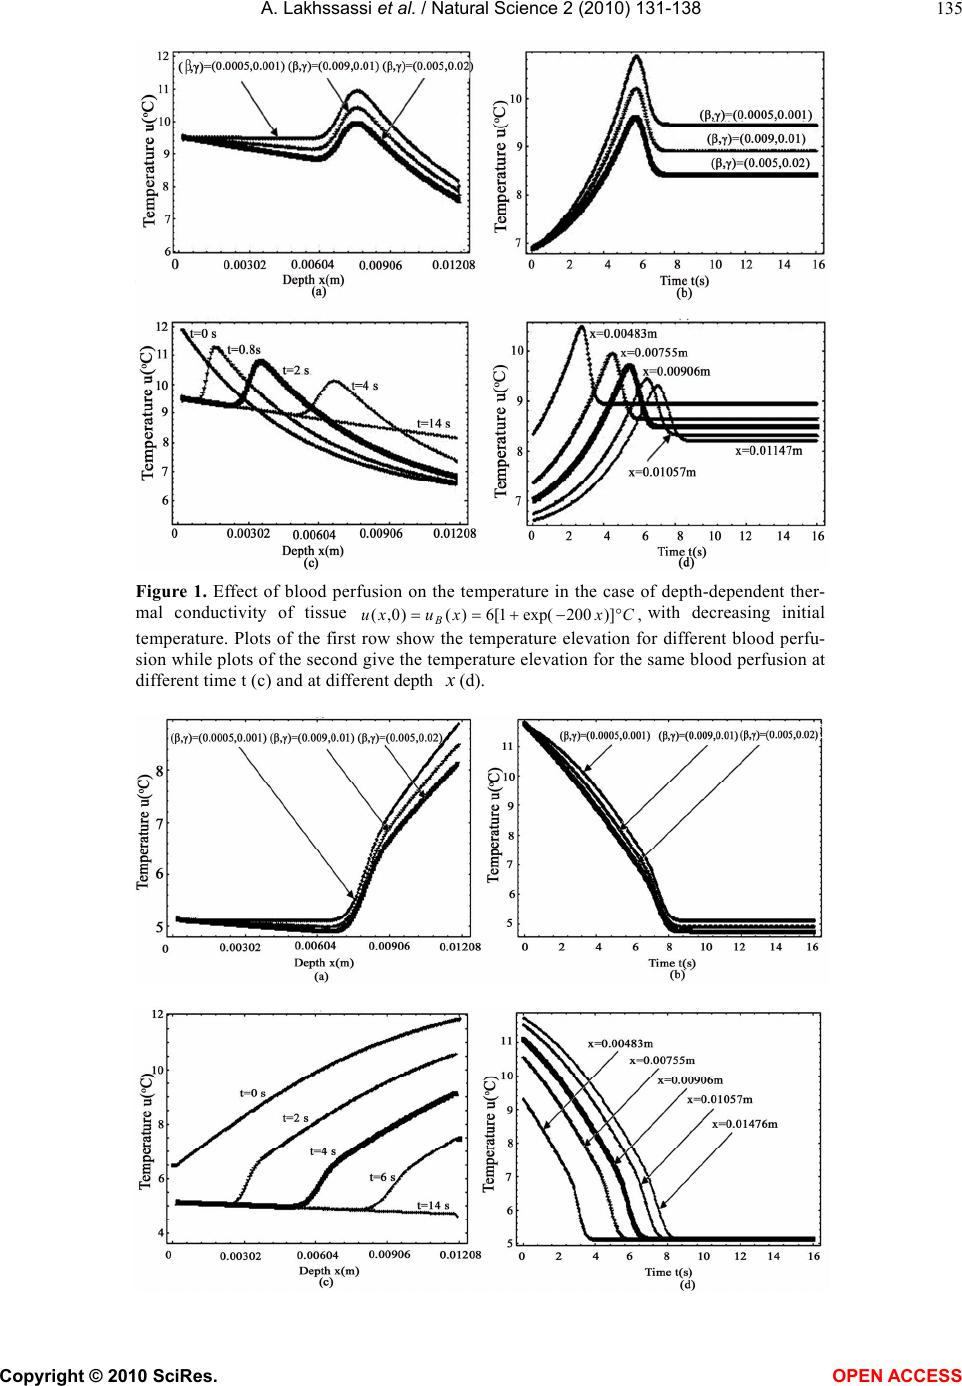 A. Lakhssassi et al. / Natural Science 2 (2010) 131-138 Copyright © 2010 SciRes. OPEN ACCESS 135 Figure 1. Effect of blood perfusion on the temperature in the case of depth-dependent ther- mal conductivity of tissue ,)]200exp(1[6)()0,( Cxxuxu B with decreasing initial temperature. Plots of the first row show the temperature elevation for different blood perfu- sion while plots of the second give the temperature elevation for the same blood perfusion at different time t (c) and at different depth x (d). 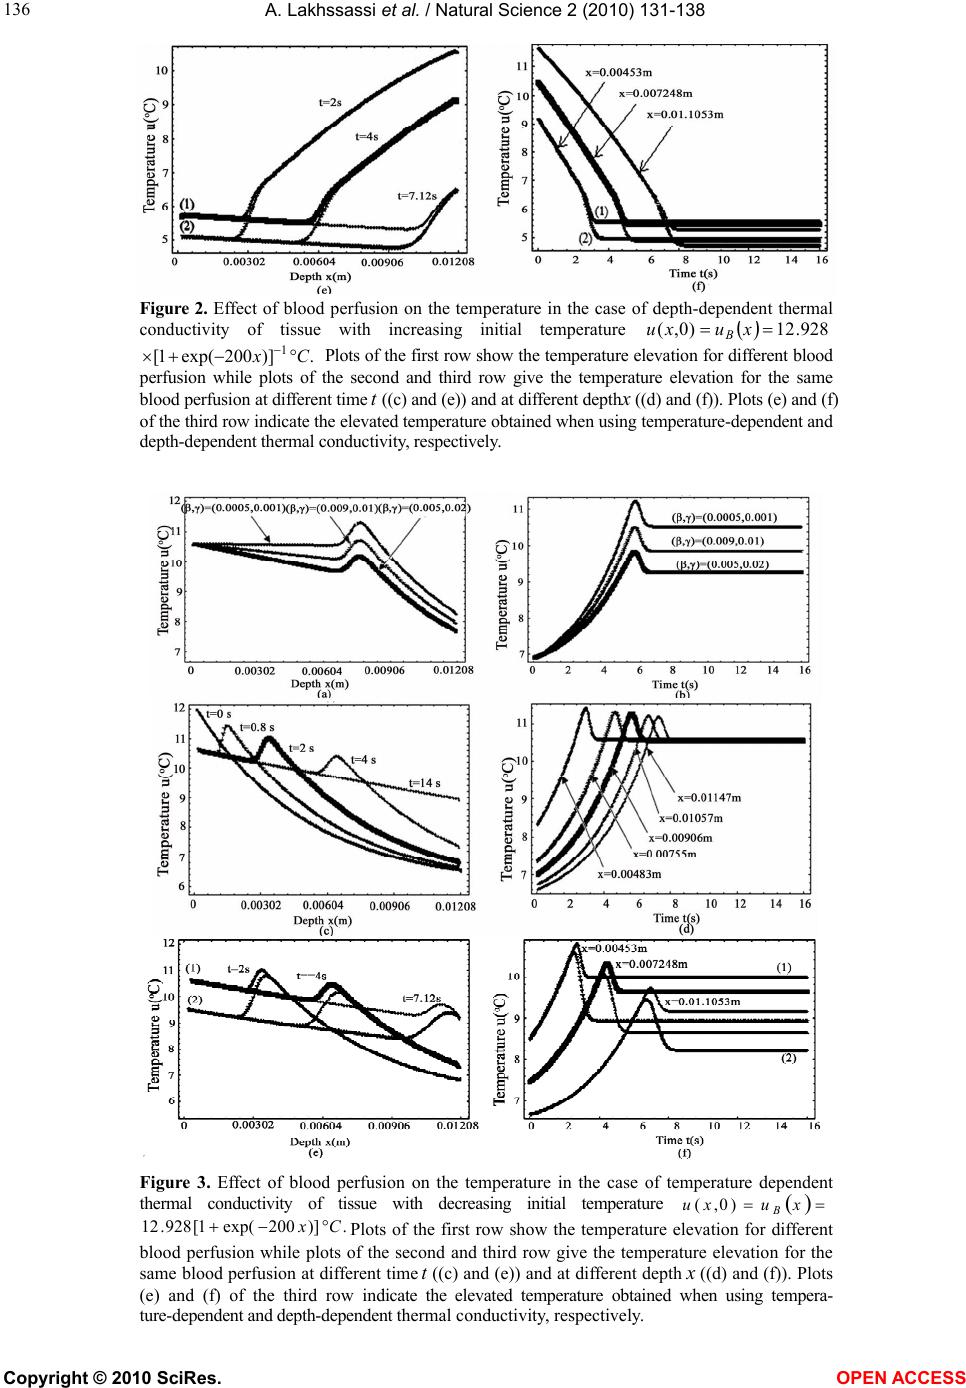 A. Lakhssassi et al. / Natural Science 2 (2010) 131-138 Copyright © 2010 SciRes. OPEN ACCESS 136 Figure 2. Effect of blood perfusion on the temperature in the case of depth-dependent thermal conductivity of tissue with increasing initial temperature 928.12)0,( x u x uB .)]200exp(1[ 1Cx Plots of the first row show the temperature elevation for different blood perfusion while plots of the second and third row give the temperature elevation for the same blood perfusion at different time t ((c) and (e)) and at different depth x ((d) and (f)). Plots (e) and (f) of the third row indicate the elevated temperature obtained when using temperature-dependent and depth-dependent thermal conductivity, respectively. Figure 3. Effect of blood perfusion on the temperature in the case of temperature dependent thermal conductivity of tissue with decreasing initial temperature xuxu B )0,( . ) ]200exp ( 1[928.12 C x Plots of the first row show the temperature elevation for different blood perfusion while plots of the second and third row give the temperature elevation for the same blood perfusion at different time t ((c) and (e)) and at different depth x ((d) and (f)). Plots (e) and (f) of the third row indicate the elevated temperature obtained when using tempera- ture-dependent and depth-dependent thermal conductivity, respectively. 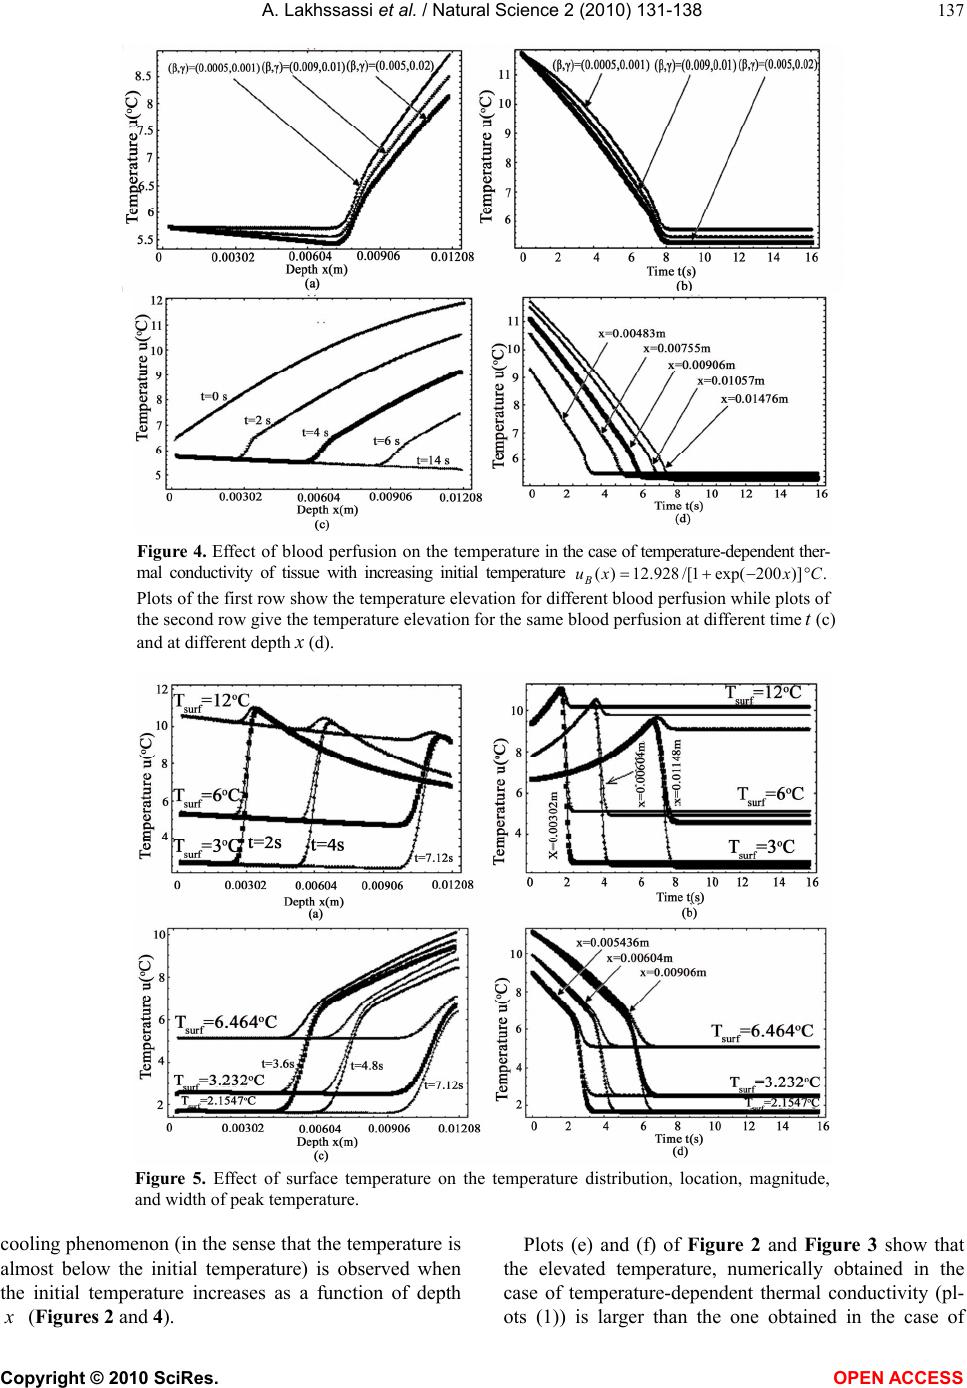 A. Lakhssassi et al. / Natural Science 2 (2010) 131-138 Copyright © 2010 SciRes. OPEN ACCESS 137 Figure 4. Effect of blood perfusion on the temperature in the case of temperature-dependent ther- mal conductivity of tissue with increasing initial temperature .)]200exp(1/[928.12)( CxxuB Plots of the first row show the temperature elevation for different blood perfusion while plots of the second row give the temperature elevation for the same blood perfusion at different time t (c) and at different depth x (d). Figure 5. Effect of surface temperature on the temperature distribution, location, magnitude, and width of peak temperature. cooling phenomenon (in the sense that the temperature is almost below the initial temperature) is observed when the initial temperature increases as a function of depth x (Figures 2 and 4). Plots (e) and (f) of Figure 2 and Figure 3 show that the elevated temperature, numerically obtained in the case of temperature-dependent thermal conductivity (pl- ots (1)) is larger than the one obtained in the case of 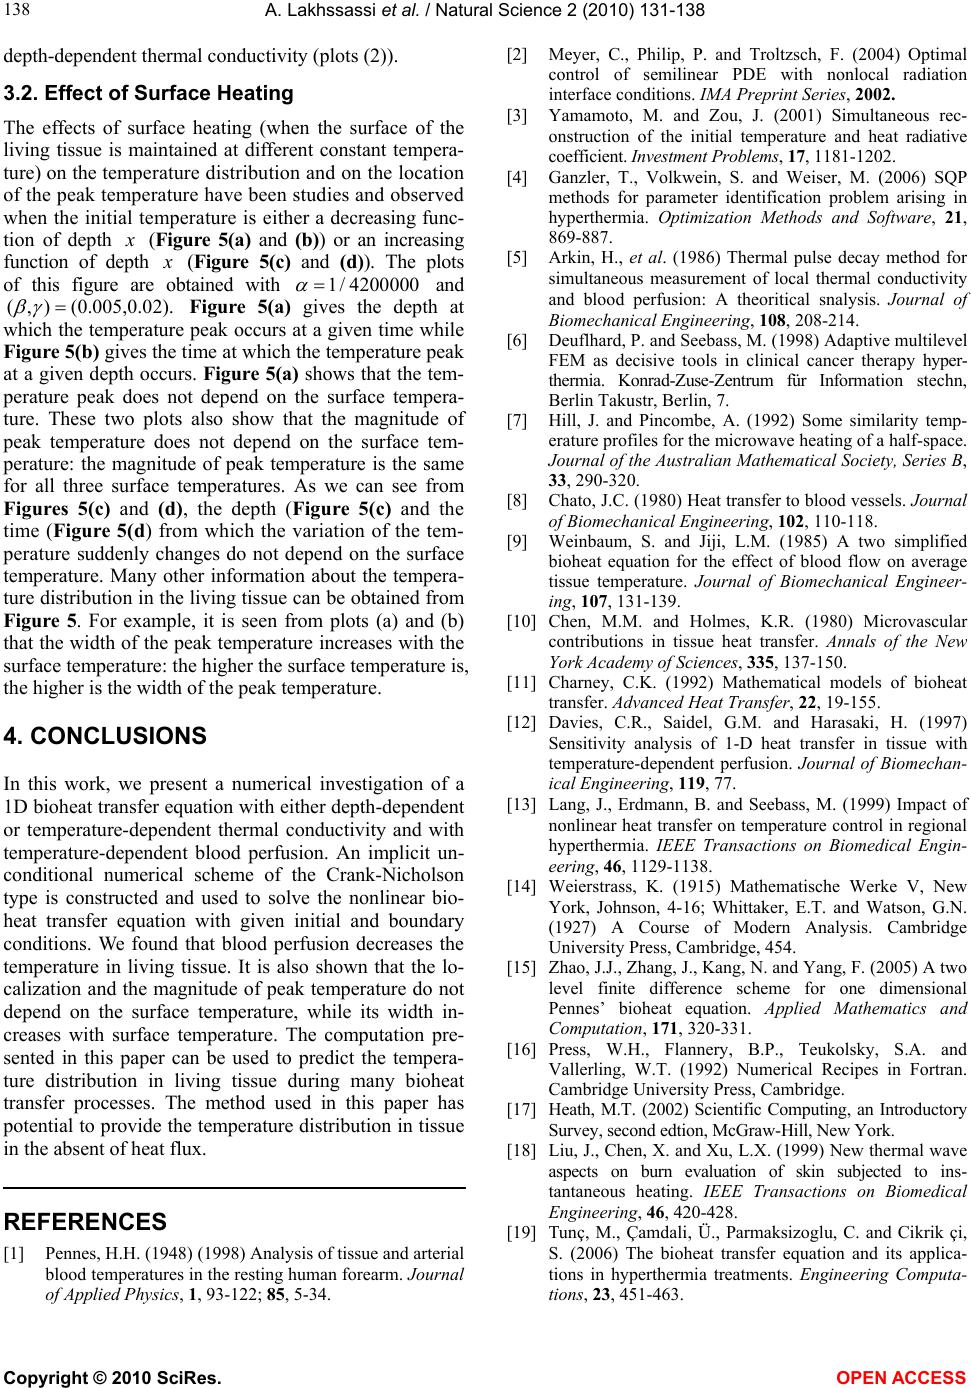 A. Lakhssassi et al. / Natural Science 2 (2010) 131-138 Copyright © 2010 SciRes. OPEN ACCESS 138 depth-dependent thermal conductivity (plots (2)). 3.2. Effect of Surface Heating The effects of surface heating (when the surface of the living tissue is maintained at different constant tempera- ture) on the temperature distribution and on the location of the peak temperature have been studies and observed when the initial temperature is either a decreasing func- tion of depth x (Figure 5(a) and (b)) or an increasing function of depth x (Figure 5(c) and (d)). The plots of this figure are obtained with 1/ 4200000 and (, )(0.005,0.02). Figure 5(a) gives the depth at which the temperature peak occurs at a given time while Figure 5(b) gives the time at which the temperature peak at a given depth occurs. Figure 5(a) shows that the tem- perature peak does not depend on the surface tempera- ture. These two plots also show that the magnitude of peak temperature does not depend on the surface tem- perature: the magnitude of peak temperature is the same for all three surface temperatures. As we can see from Figures 5(c) and (d), the depth (Figure 5(c) and the time (Figure 5(d) from which the variation of the tem- perature suddenly changes do not depend on the surface temperature. Many other information about the tempera- ture distribution in the living tissue can be obtained from Figure 5. For example, it is seen from plots (a) and (b) that the width of the peak temperature increases with the surface temperature: the higher the surface temperature is, the higher is the width of the peak temperature. 4. CONCLUSIONS In this work, we present a numerical investigation of a 1D bioheat transfer equation with either depth-dependent or temperature-dependent thermal conductivity and with temperature-dependent blood perfusion. An implicit un- conditional numerical scheme of the Crank-Nicholson type is constructed and used to solve the nonlinear bio- heat transfer equation with given initial and boundary conditions. We found that blood perfusion decreases the temperature in living tissue. It is also shown that the lo- calization and the magnitude of peak temperature do not depend on the surface temperature, while its width in- creases with surface temperature. The computation pre- sented in this paper can be used to predict the tempera- ture distribution in living tissue during many bioheat transfer processes. The method used in this paper has potential to provide the temperature distribution in tissue in the absent of heat flux. REFERENCES [1] Pennes, H.H. (1948) (1998) Analysis of tissue and arterial blood temperatures in the resting human forearm. Journal of Applied Physics, 1, 93-122; 85, 5-34. [2] Meyer, C., Philip, P. and Troltzsch, F. (2004) Optimal control of semilinear PDE with nonlocal radiation interface conditions. IMA Preprint Series, 2002. [3] Yamamoto, M. and Zou, J. (2001) Simultaneous rec- onstruction of the initial temperature and heat radiative coefficient. Investment Problems, 17, 1181-1202. [4] Ganzler, T., Volkwein, S. and Weiser, M. (2006) SQP methods for parameter identification problem arising in hyperthermia. Optimization Methods and Software, 21, 869-887. [5] Arkin, H., et al. (1986) Thermal pulse decay method for simultaneous measurement of local thermal conductivity and blood perfusion: A theoritical snalysis. Journal of Biomechanical Engineering, 108, 208-214. [6] Deuflhard, P. and Seebass, M. (1998) Adaptive multilevel FEM as decisive tools in clinical cancer therapy hyper- thermia. Konrad-Zuse-Zentrum für Information stechn, Berlin Takustr, Berlin, 7. [7] Hill, J. and Pincombe, A. (1992) Some similarity temp- erature profiles for the microwave heating of a half-space. Journal of the Australian Mathematical Society, Series B, 33, 290-320. [8] Chato, J.C. (1980) Heat transfer to blood vessels. Journal of Biomechanical Engineering, 102, 110-118. [9] Weinbaum, S. and Jiji, L.M. (1985) A two simplified bioheat equation for the effect of blood flow on average tissue temperature. Journal of Biomechanical Engineer- ing, 107, 131-139. [10] Chen, M.M. and Holmes, K.R. (1980) Microvascular contributions in tissue heat transfer. Annals of the New York Academy of Sciences, 335, 137-150. [11] Charney, C.K. (1992) Mathematical models of bioheat transfer. Advanced Heat Transfer, 22, 19-155. [12] Davies, C.R., Saidel, G.M. and Harasaki, H. (1997) Sensitivity analysis of 1-D heat transfer in tissue with temperature-dependent perfusion. Journal of Biomechan- ical Engineering, 119, 77. [13] Lang, J., Erdmann, B. and Seebass, M. (1999) Impact of nonlinear heat transfer on temperature control in regional hyperthermia. IEEE Transactions on Biomedical Engin- eering, 46, 1129-1138. [14] Weierstrass, K. (1915) Mathematische Werke V, New York, Johnson, 4-16; Whittaker, E.T. and Watson, G.N. (1927) A Course of Modern Analysis. Cambridge University Press, Cambridge, 454. [15] Zhao, J.J., Zhang, J., Kang, N. and Yang, F. (2005) A two level finite difference scheme for one dimensional Pennes’ bioheat equation. Applied Mathematics and Computation, 171, 320-331. [16] Press, W.H., Flannery, B.P., Teukolsky, S.A. and Vallerling, W.T. (1992) Numerical Recipes in Fortran. Cambridge University Press, Cambridge. [17] Heath, M.T. (2002) Scientific Computing, an Introductory Survey, second edtion, McGraw-Hill, New York. [18] Liu, J., Chen, X. and Xu, L.X. (1999) New thermal wave aspects on burn evaluation of skin subjected to ins- tantaneous heating. IEEE Transactions on Biomedical Engineering, 46, 420-428. [19] Tunç, M., Çamdali, Ü., Parmaksizoglu, C. and Cikrik çi, S. (2006) The bioheat transfer equation and its applica- tions in hyperthermia treatments. Engineering Computa- tions, 23, 451-463. |