

Paper Menu >>
Journal Menu >>
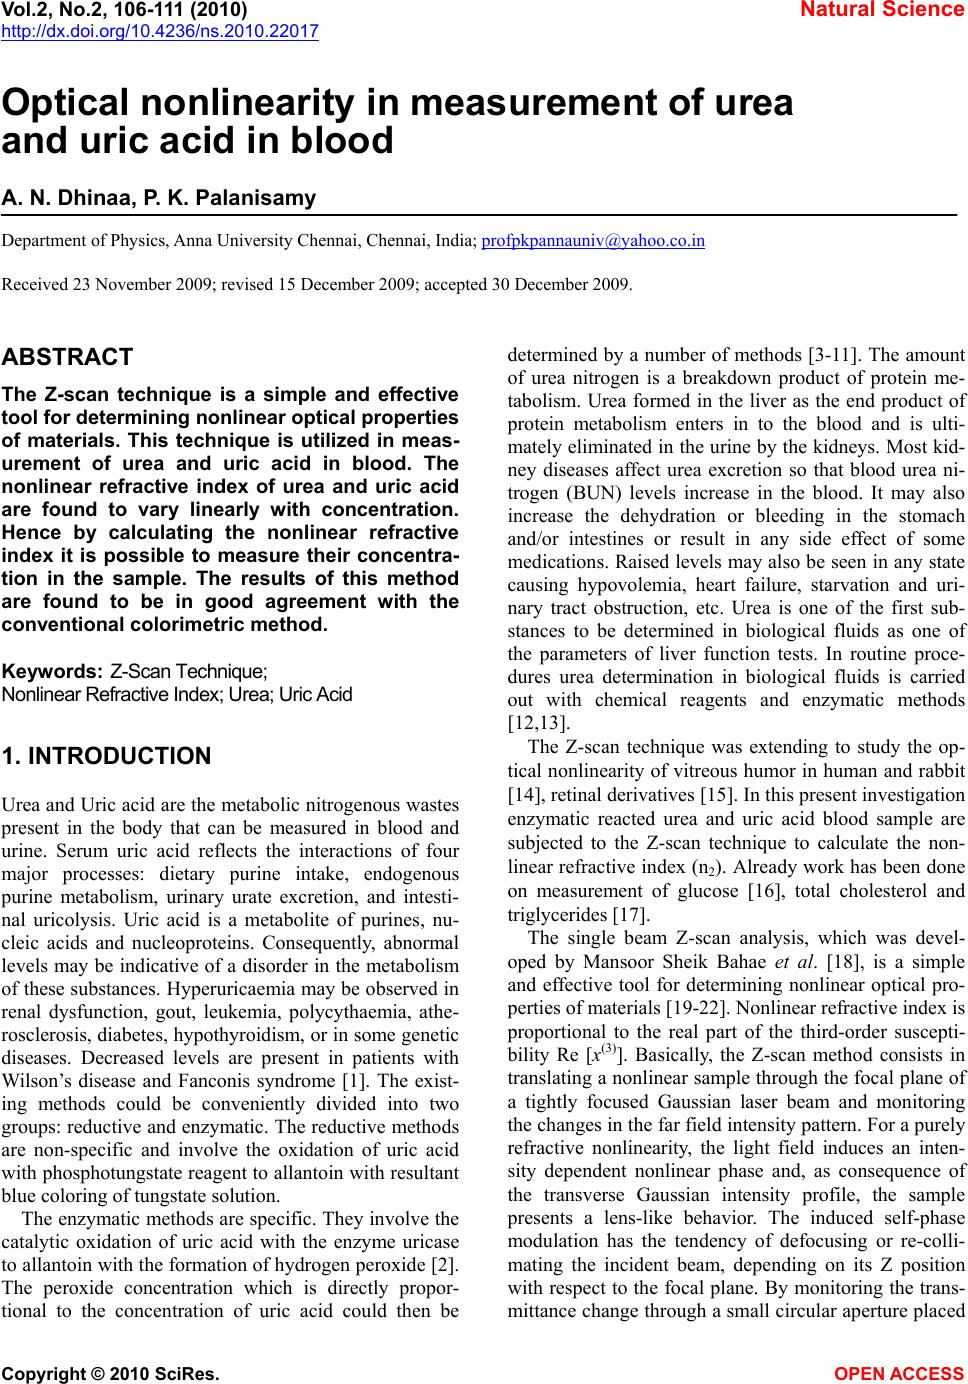 Vol.2, No.2, 106-111 (2010) Natural Science http://dx.doi.org/10.4236/ns.2010.22017 Copyright © 2010 SciRes. OPEN ACCESS Optical nonlinearity in measurement of urea and uric acid in blood A. N. Dhinaa, P. K. Palanisamy Department of Physics, Anna University Chennai, Chennai, India; [email protected] Received 23 November 2009; revised 15 December 2009; accepted 30 December 2009. ABSTRACT The Z-scan technique is a simple and effective tool for determining nonlinear optical properties of materials. This technique is utilized in meas- urement of urea and uric acid in blood. The nonlinear refractive index of urea and uric acid are found to vary linearly with concentration. Hence by calculating the nonlinear refractive index it is possible to measure their concentra- tion in the sample. The results of this method are found to be in good agreement with the conventional colorimetric method. Keywords: Z-Scan Technique; Nonlinear Refractive Index; Urea; Uric Acid 1. INTRODUCTION Urea and Uric acid are the metabolic nitrogenous wastes present in the body that can be measured in blood and urine. Serum uric acid reflects the interactions of four major processes: dietary purine intake, endogenous purine metabolism, urinary urate excretion, and intesti- nal uricolysis. Uric acid is a metabolite of purines, nu- cleic acids and nucleoproteins. Consequently, abnormal levels may be indicative of a disorder in the metabolism of these substances. Hyperuricaemia may be observed in renal dysfunction, gout, leukemia, polycythaemia, athe- rosclerosis, diabetes, hypothyroidism, or in some genetic diseases. Decreased levels are present in patients with Wilson’s disease and Fanconis syndrome [1]. The exist- ing methods could be conveniently divided into two groups: reductive and enzymatic. The reductive methods are non-specific and involve the oxidation of uric acid with phosphotungstate reagent to allantoin with resultant blue coloring of tungstate solution. The enzymatic methods are specific. They involve the catalytic oxidation of uric acid with the enzyme uricase to allantoin with the formation of hydrogen peroxide [2]. The peroxide concentration which is directly propor- tional to the concentration of uric acid could then be determined by a number of methods [3-11]. The amount of urea nitrogen is a breakdown product of protein me- tabolism. Urea formed in the liver as the end product of protein metabolism enters in to the blood and is ulti- mately eliminated in the urine by the kidneys. Most kid- ney diseases affect urea excretion so that blood urea ni- trogen (BUN) levels increase in the blood. It may also increase the dehydration or bleeding in the stomach and/or intestines or result in any side effect of some medications. Raised levels may also be seen in any state causing hypovolemia, heart failure, starvation and uri- nary tract obstruction, etc. Urea is one of the first sub- stances to be determined in biological fluids as one of the parameters of liver function tests. In routine proce- dures urea determination in biological fluids is carried out with chemical reagents and enzymatic methods [12,13]. The Z-scan technique was extending to study the op- tical nonlinearity of vitreous humor in human and rabbit [14], retinal derivatives [15]. In this present investigation enzymatic reacted urea and uric acid blood sample are subjected to the Z-scan technique to calculate the non- linear refractive index (n2). Already work has been done on measurement of glucose [16], total cholesterol and triglycerides [17]. The single beam Z-scan analysis, which was devel- oped by Mansoor Sheik Bahae et al. [18], is a simple and effective tool for determining nonlinear optical pro- perties of materials [19-22]. Nonlinear refractive index is proportional to the real part of the third-order suscepti- bility Re [x(3)]. Basically, the Z-scan method consists in translating a nonlinear sample through the focal plane of a tightly focused Gaussian laser beam and monitoring the changes in the far field intensity pattern. For a purely refractive nonlinearity, the light field induces an inten- sity dependent nonlinear phase and, as consequence of the transverse Gaussian intensity profile, the sample presents a lens-like behavior. The induced self-phase modulation has the tendency of defocusing or re-colli- mating the incident beam, depending on its Z position with respect to the focal plane. By monitoring the trans- mittance change through a small circular aperture placed 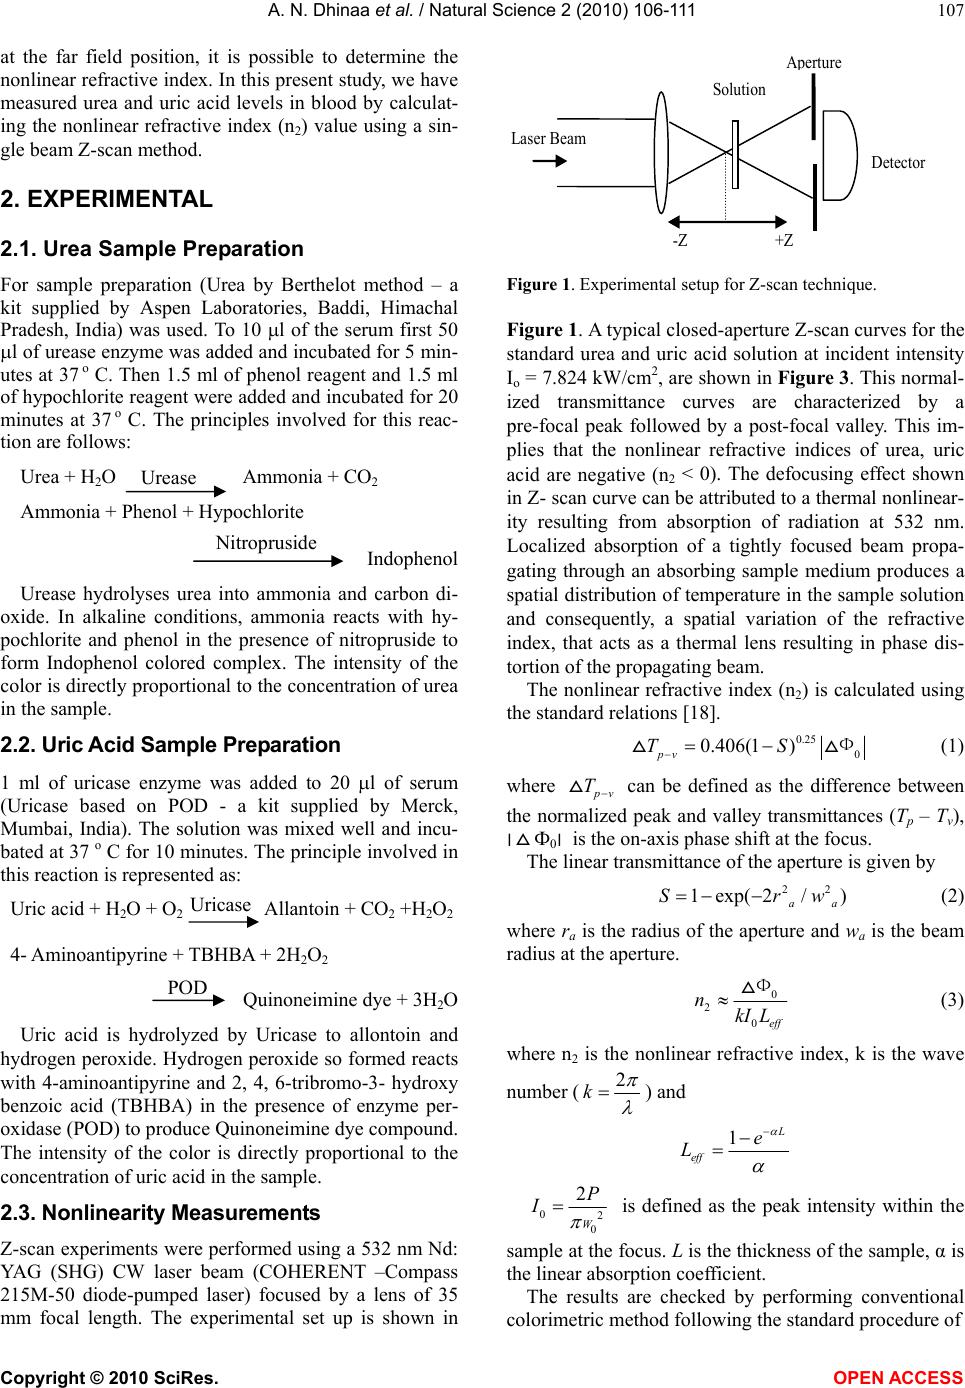 A. N. Dhinaa et al. / Natural Science 2 (2010) 106-111 Copyright © 2010 SciRes. OPEN ACCESS 107 at the far field position, it is possible to determine the nonlinear refractive index. In this present study, we have measured urea and uric acid levels in blood by calculat- ing the nonlinear refractive index (n2) value using a sin- gle beam Z-scan method. 2. EXPERIMENTAL 2.1. Urea Sample Preparation For sample preparation (Urea by Berthelot method – a kit supplied by Aspen Laboratories, Baddi, Himachal Pradesh, India) was used. To 10 l of the serum first 50 l of urease enzyme was added and incubated for 5 min- utes at 37 o C. Then 1.5 ml of phenol reagent and 1.5 ml of hypochlorite reagent were added and incubated for 20 minutes at 37 o C. The principles involved for this reac- tion are follows: Urea + H2O Ammonia + CO 2 Ammonia + Phenol + Hypochlorite Indophenol Urease hydrolyses urea into ammonia and carbon di- oxide. In alkaline conditions, ammonia reacts with hy- pochlorite and phenol in the presence of nitropruside to form Indophenol colored complex. The intensity of the color is directly proportional to the concentration of urea in the sample. 2.2. Uric Acid Sample Preparation 1 ml of uricase enzyme was added to 20 l of serum (Uricase based on POD - a kit supplied by Merck, Mumbai, India). The solution was mixed well and incu- bated at 37 o C for 10 minutes. The principle involved in this reaction is represented as: Uric acid + H2O + O2 Allantoin + CO2 +H2O2 4- Aminoantipyrine + TBHBA + 2H2O2 Quinoneimine dye + 3H2O Uric acid is hydrolyzed by Uricase to allontoin and hydrogen peroxide. Hydrogen peroxide so formed reacts with 4-aminoantipyrine and 2, 4, 6-tribromo-3- hydroxy benzoic acid (TBHBA) in the presence of enzyme per- oxidase (POD) to produce Quinoneimine dye compound. The intensity of the color is directly proportional to the concentration of uric acid in the sample. 2.3. Nonlinearity Measurements Z-scan experiments were performed using a 532 nm Nd: YAG (SHG) CW laser beam (COHERENT –Compass 215M-50 diode-pumped laser) focused by a lens of 35 mm focal length. The experimental set up is shown in Solution Laser Beam A p erture Detecto r -Z +Z Figure 1. Experimental setup for Z-scan technique. Figure 1. A typical closed-aperture Z-scan curves for the standard urea and uric acid solution at incident intensity Iο = 7.824 kW/cm2, are shown in Figure 3. This normal- ized transmittance curves are characterized by a pre-focal peak followed by a post-focal valley. This im- plies that the nonlinear refractive indices of urea, uric acid are negative (n2 < 0). The defocusing effect shown in Z- scan curve can be attributed to a thermal nonlinear- ity resulting from absorption of radiation at 532 nm. Localized absorption of a tightly focused beam propa- gating through an absorbing sample medium produces a spatial distribution of temperature in the sample solution and consequently, a spatial variation of the refractive index, that acts as a thermal lens resulting in phase dis- tortion of the propagating beam. The nonlinear refractive index (n2) is calculated using the standard relations [18]. 0.25 0 0.406(1 ) pv TS Ф (1) where pv T can be defined as the difference between the normalized peak and valley transmittances (Tp – Tv), ׀Ф0׀ is the on-axis phase shift at the focus. The linear transmittance of the aperture is given by 22 1exp(2/) aa Srw (2) where ra is the radius of the aperture and wa is the beam radius at the aperture. 0 2 0eff nkI L Ф (3) where n2 is the nonlinear refractive index, k is the wave number (2 k ) and 1 L eff e L 02 0 2 W P I is defined as the peak intensity within the sample at the focus. L is the thickness of the sample, α is the linear absorption coefficient. The results are checked by performing conventional colorimetric method following the standard procedure of Urease Nitropruside POD Uricase 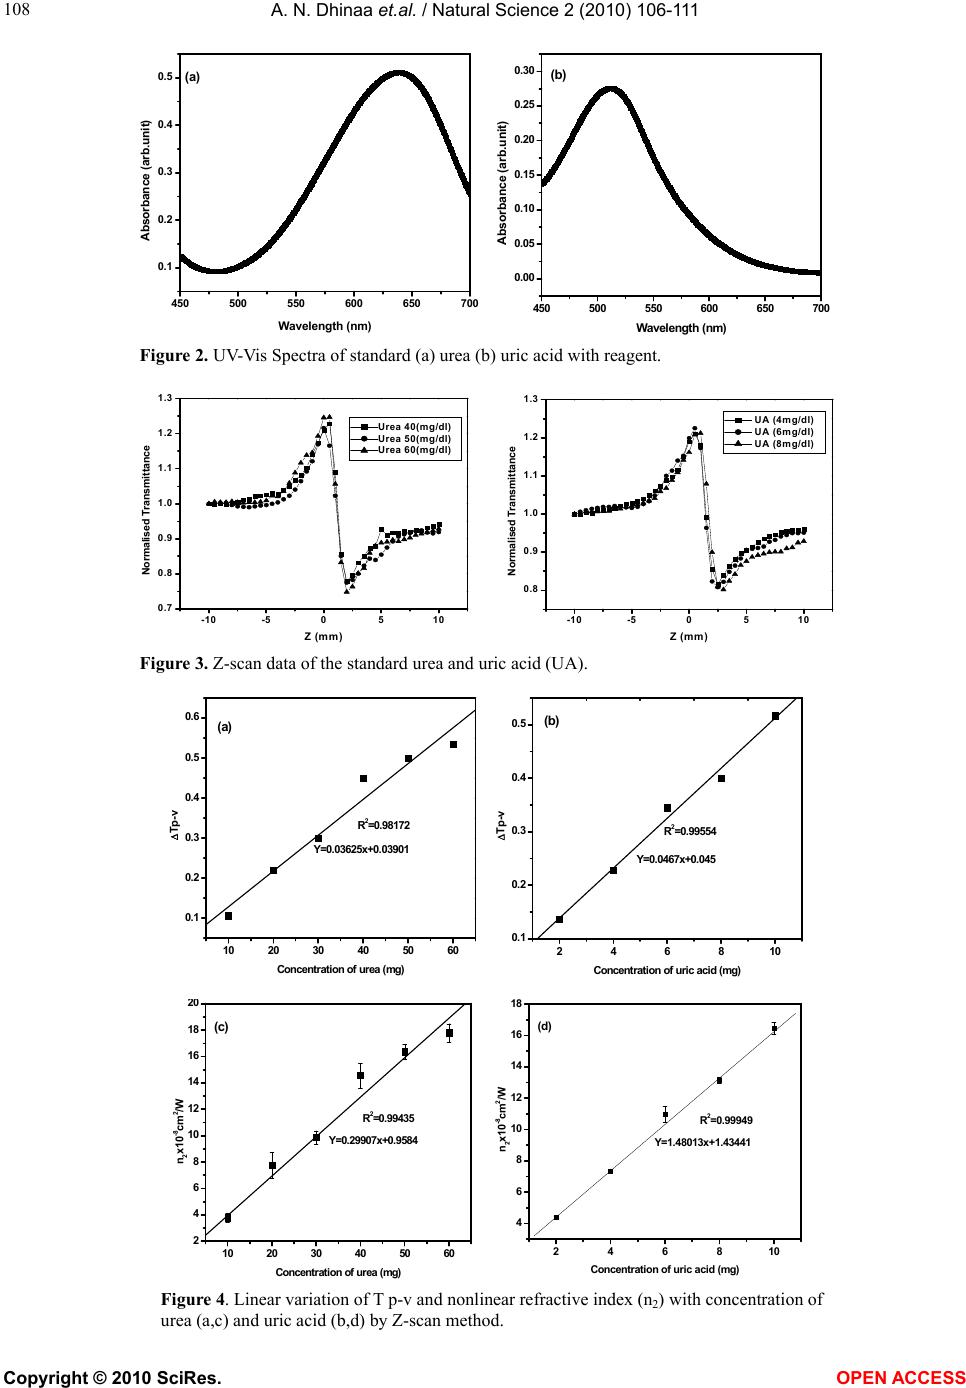 A. N. Dhinaa et.al. / Natural Science 2 (2010) 106-111 Copyright © 2010 SciRes. OPEN ACCESS 108 450 500 550 600 650 70 0 0.1 0.2 0.3 0.4 0.5 (a) Absorbance (arb.unit) Wavelength (nm) 450 500 550 600 650 700 0.00 0.05 0.10 0.15 0.20 0.25 0.30 (b) Absorbance (arb.unit) Wavelength (nm) Figure 2. UV-Vis Spectra of standard (a) urea (b) uric acid with reagent. -10 -50510 0.7 0.8 0.9 1.0 1.1 1.2 1.3 Normalised Transmittance Z (mm) Urea 40(mg/dl) Urea 50(mg/dl) Urea 60(mg/dl) -10 -50510 0.8 0.9 1.0 1.1 1.2 1.3 Normalised Transmittance Z (mm) UA (4mg/dl) UA (6mg/dl) UA (8mg/dl) Figure 3. Z-scan data of the standard urea and uric acid (UA). 10 20 30 40 50 60 0.1 0.2 0.3 0.4 0.5 0.6 (a) Y=0.03625x+0.03901 R2=0.98172 Tp-v Concentration of urea (mg) 246810 0.1 0.2 0.3 0.4 0.5 (b) Y=0.0467x+0.045 R2=0.99554 Tp-v Concentration of uric acid (mg) 10 2030 4050 60 2 4 6 8 10 12 14 16 18 20 (c) R2=0.99435 Y=0.29907x+0.9584 n2x10-8cm2/W Concentration of urea (mg) 246810 4 6 8 10 12 14 16 18 (d) n2x10-8cm2/W Y=1.4801 3x+1.4 3441 R2=0.99949 Concentration of uric acid (mg) Figure 4. Linear variation of T p-v and nonlinear refractive index (n2) with concentration of urea (a,c) and uric acid (b,d) by Z-scan method. 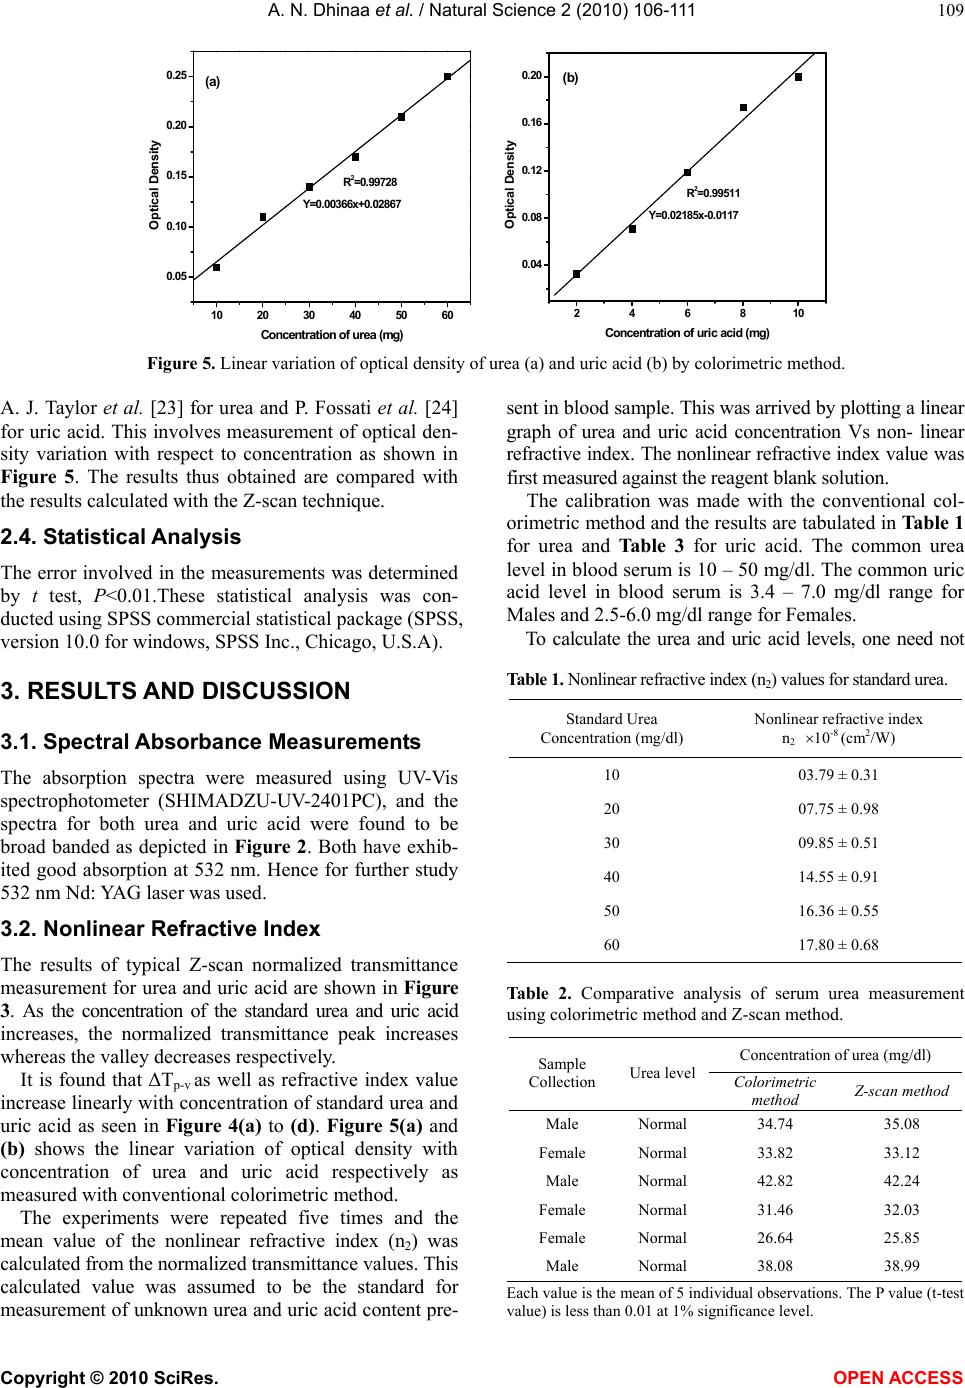 A. N. Dhinaa et al. / Natural Science 2 (2010) 106-111 Copyright © 2010 SciRes. OPEN ACCESS 109 10 20 30 40 50 60 0.05 0.10 0.15 0.20 0.25 (a) Y=0.0036 6x+0.0286 7 R2=0. 99728 Optical Densit y Concentration of urea (mg) 246810 0.04 0.08 0.12 0.16 0.20 (b) Y=0.02185x -0.0117 R2=0.99511 Optical Density Concentration of uric acid (mg) Figure 5. Linear variation of optical density of urea (a) and uric acid (b) by colorimetric method. A. J. Taylor et al. [23] for urea and P. Fossati et al. [24] for uric acid. This involves measurement of optical den- sity variation with respect to concentration as shown in Figure 5. The results thus obtained are compared with the results calculated with the Z-scan technique. 2.4. Statistical Analysis The error involved in the measurements was determined by t test, P<0.01.These statistical analysis was con- ducted using SPSS commercial statistical package (SPSS, version 10.0 for windows, SPSS Inc., Chicago, U.S.A). 3. RESULTS AND DISCUSSION 3.1. Spectral Absorbance Measurements The absorption spectra were measured using UV-Vis spectrophotometer (SHIMADZU-UV-2401PC), and the spectra for both urea and uric acid were found to be broad banded as depicted in Figure 2. Both have exhib- ited good absorption at 532 nm. Hence for further study 532 nm Nd: YAG laser was used. 3.2. Nonlinear Refractive Index The results of typical Z-scan normalized transmittance measurement for urea and uric acid are shown in Figure 3. As the concentration of the standard urea and uric acid increases, the normalized transmittance peak increases whereas the valley decreases respectively. It is found that ΔTp-v as well as refractive index value increase linearly with concentration of standard urea and uric acid as seen in Figure 4(a) to (d). Figure 5(a) and (b) shows the linear variation of optical density with concentration of urea and uric acid respectively as measured with conventional colorimetric method. The experiments were repeated five times and the mean value of the nonlinear refractive index (n2) was calculated from the normalized transmittance values. This calculated value was assumed to be the standard for measurement of unknown urea and uric acid content pre- sent in blood sample. This was arrived by plotting a linear graph of urea and uric acid concentration Vs non- linear refractive index. The nonlinear refractive index value was first measured against the reagent blank solution. The calibration was made with the conventional col- orimetric method and the results are tabulated in Table 1 for urea and Table 3 for uric acid. The common urea level in blood serum is 10 – 50 mg/dl. The common uric acid level in blood serum is 3.4 – 7.0 mg/dl range for Males and 2.5-6.0 mg/dl range for Females. To calculate the urea and uric acid levels, one need not Table 1. Nonlinear refractive index (n2) values for standard urea. Standard Urea Concentration (mg/dl) Nonlinear refractive index n2 10-8 (cm2/W) 10 03.79 ± 0.31 20 07.75 ± 0.98 30 09.85 ± 0.51 40 14.55 ± 0.91 50 16.36 ± 0.55 60 17.80 ± 0.68 Table 2. Comparative analysis of serum urea measurement using colorimetric method and Z-scan method. Concentration of urea (mg/dl) Sample Collection Urea levelColorimetric method Z-scan method Male Normal 34.74 35.08 Female Normal 33.82 33.12 Male Normal 42.82 42.24 Female Normal 31.46 32.03 Female Normal 26.64 25.85 Male Normal 38.08 38.99 Each value is the mean of 5 individual observations. The P value (t-test value) is less than 0.01 at 1% significance level. 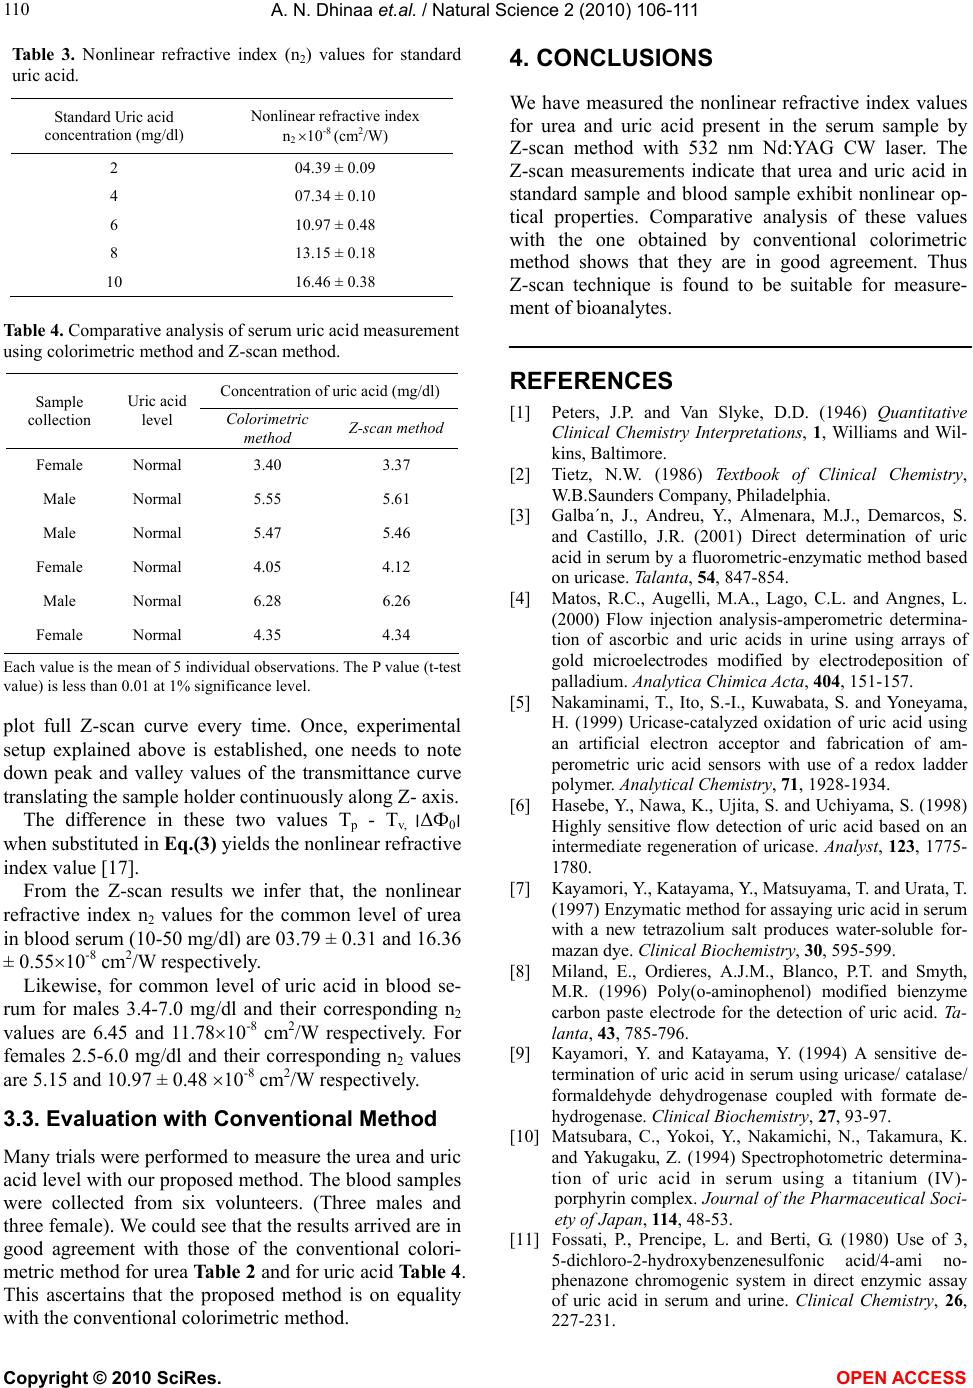 A. N. Dhinaa et.al. / Natural Science 2 (2010) 106-111 Copyright © 2010 SciRes. OPEN ACCESS 110 Table 3. Nonlinear refractive index (n2) values for standard uric acid. Standard Uric acid concentration (mg/dl) Nonlinear refractive index n2 10-8 (cm2/W) 2 04.39 ± 0.09 4 07.34 ± 0.10 6 10.97 ± 0.48 8 13.15 ± 0.18 10 16.46 ± 0.38 Table 4. Comparative analysis of serum uric acid measurement using colorimetric method and Z-scan method. Concentration of uric acid (mg/dl) Sample collection Uric acid level Colorimetric method Z-scan method Female Normal 3.40 3.37 Male Normal 5.55 5.61 Male Normal 5.47 5.46 Female Normal 4.05 4.12 Male Normal 6.28 6.26 Female Normal 4.35 4.34 Each value is the mean of 5 individual observations. The P value (t-test value) is less than 0.01 at 1% significance level. plot full Z-scan curve every time. Once, experimental setup explained above is established, one needs to note down peak and valley values of the transmittance curve translating the sample holder continuously along Z- axis. The difference in these two values Tp - Tv, ׀ΔФ0׀ when substituted in Eq.( 3) yields the nonlinear refractive index value [17]. From the Z-scan results we infer that, the nonlinear refractive index n2 values for the common level of urea in blood serum (10-50 mg/dl) are 03.79 ± 0.31 and 16.36 ± 0.5510-8 cm2/W respectively. Likewise, for common level of uric acid in blood se- rum for males 3.4-7.0 mg/dl and their corresponding n2 values are 6.45 and 11.7810-8 cm2/W respectively. For females 2.5-6.0 mg/dl and their corresponding n2 values are 5.15 and 10.97 ± 0.48 10-8 cm2/W respectively. 3.3. Evaluation with Conventional Method Many trials were performed to measure the urea and uric acid level with our proposed method. The blood samples were collected from six volunteers. (Three males and three female). We could see that the results arrived are in good agreement with those of the conventional colori- metric method for urea Table 2 and for uric acid Table 4. This ascertains that the proposed method is on equality with the conventional colorimetric method. 4. CONCLUSIONS We have measured the nonlinear refractive index values for urea and uric acid present in the serum sample by Z-scan method with 532 nm Nd:YAG CW laser. The Z-scan measurements indicate that urea and uric acid in standard sample and blood sample exhibit nonlinear op- tical properties. Comparative analysis of these values with the one obtained by conventional colorimetric method shows that they are in good agreement. Thus Z-scan technique is found to be suitable for measure- ment of bioanalytes. REFERENCES [1] Peters, J.P. and Van Slyke, D.D. (1946) Quantitative Clinical Chemistry Interpretations, 1, Williams and Wil- kins, Baltimore. [2] Tietz, N.W. (1986) Textbook of Clinical Chemistry, W.B.Saunders Company, Philadelphia. [3] Galba´n, J., Andreu, Y., Almenara, M.J., Demarcos, S. and Castillo, J.R. (2001) Direct determination of uric acid in serum by a fluorometric-enzymatic method based on uricase. Talanta, 54, 847-854. [4] Matos, R.C., Augelli, M.A., Lago, C.L. and Angnes, L. (2000) Flow injection analysis-amperometric determina- tion of ascorbic and uric acids in urine using arrays of gold microelectrodes modified by electrodeposition of palladium. Analytica Chimica Acta, 404, 151-157. [5] Nakaminami, T., Ito, S.-I., Kuwabata, S. and Yoneyama, H. (1999) Uricase-catalyzed oxidation of uric acid using an artificial electron acceptor and fabrication of am- perometric uric acid sensors with use of a redox ladder polymer. Analytical Chemistry, 71, 1928-1934. [6] Hasebe, Y., Nawa, K., Ujita, S. and Uchiyama, S. (1998) Highly sensitive flow detection of uric acid based on an intermediate regeneration of uricase. Analyst, 123, 1775- 1780. [7] Kayamori, Y., Katayama, Y., Matsuyama, T. and Urata, T. (1997) Enzymatic method for assaying uric acid in serum with a new tetrazolium salt produces water-soluble for- mazan dye. Clinical Biochemistry, 30, 595-599. [8] Miland, E., Ordieres, A.J.M., Blanco, P.T. and Smyth, M.R. (1996) Poly(o-aminophenol) modified bienzyme carbon paste electrode for the detection of uric acid. Ta- lanta, 43, 785-796. [9] Kayamori, Y. and Katayama, Y. (1994) A sensitive de- termination of uric acid in serum using uricase/ catalase/ formaldehyde dehydrogenase coupled with formate de- hydrogenase. Clinical Biochemistry, 27, 93-97. [10] Matsubara, C., Yokoi, Y., Nakamichi, N., Takamura, K. and Yakugaku, Z. (1994) Spectrophotometric determina- tion of uric acid in serum using a titanium (IV)- porphyrin complex. Journal of the Pharmaceutical Soci- ety of Japan, 114, 48-53. [11] Fossati, P., Prencipe, L. and Berti, G. (1980) Use of 3, 5-dichloro-2-hydroxybenzenesulfonic acid/4-ami no- phenazone chromogenic system in direct enzymic assay of uric acid in serum and urine. Clinical Chemistry, 26, 227-231. 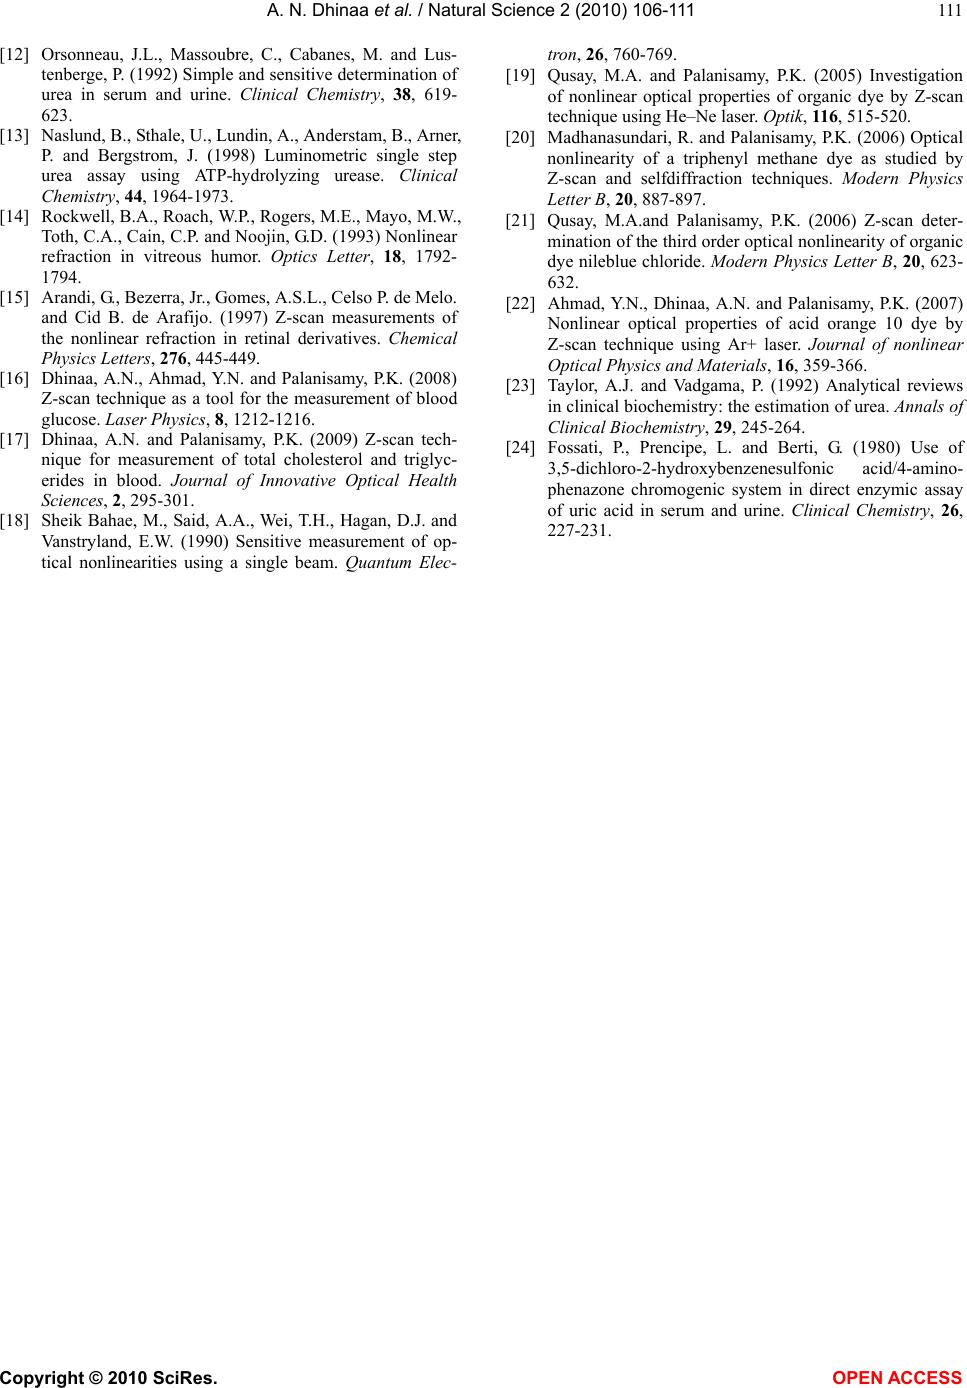 A. N. Dhinaa et al. / Natural Science 2 (2010) 106-111 Copyright © 2010 SciRes. OPEN ACCESS 111 [12] Orsonneau, J.L., Massoubre, C., Cabanes, M. and Lus- tenberge, P. (1992) Simple and sensitive determination of urea in serum and urine. Clinical Chemistry, 38, 619- 623. [13] Naslund, B., Sthale, U., Lundin, A., Anderstam, B., Arner, P. and Bergstrom, J. (1998) Luminometric single step urea assay using ATP-hydrolyzing urease. Clinical Chemistry, 44, 1964-1973. [14] Rockwell, B.A., Roach, W.P., Rogers, M.E., Mayo, M.W., Toth, C.A., Cain, C.P. and Noojin, G.D. (1993) Nonlinear refraction in vitreous humor. Optics Letter, 18, 1792- 1794. [15] Arandi, G., Bezerra, Jr., Gomes, A.S.L., Celso P. de Melo. and Cid B. de Arafijo. (1997) Z-scan measurements of the nonlinear refraction in retinal derivatives. Chemical Physics Letters, 276, 445-449. [16] Dhinaa, A.N., Ahmad, Y.N. and Palanisamy, P.K. (2008) Z-scan technique as a tool for the measurement of blood glucose. Laser Physics, 8, 1212-1216. [17] Dhinaa, A.N. and Palanisamy, P.K. (2009) Z-scan tech- nique for measurement of total cholesterol and triglyc- erides in blood. Journal of Innovative Optical Health Sciences, 2, 295-301. [18] Sheik Bahae, M., Said, A.A., Wei, T.H., Hagan, D.J. and Vanstryland, E.W. (1990) Sensitive measurement of op- tical nonlinearities using a single beam. Quantum Elec- tron, 26, 760-769. [19] Qusay, M.A. and Palanisamy, P.K. (2005) Investigation of nonlinear optical properties of organic dye by Z-scan technique using He–Ne laser. Optik, 11 6, 515-520. [20] Madhanasundari, R. and Palanisamy, P.K. (2006) Optical nonlinearity of a triphenyl methane dye as studied by Z-scan and selfdiffraction techniques. Modern Physics Letter B, 20, 887-897. [21] Qusay, M.A.and Palanisamy, P.K. (2006) Z-scan deter- mination of the third order optical nonlinearity of organic dye nileblue chloride. Modern Physics Letter B, 20, 623- 632. [22] Ahmad, Y.N., Dhinaa, A.N. and Palanisamy, P.K. (2007) Nonlinear optical properties of acid orange 10 dye by Z-scan technique using Ar+ laser. Journal of nonlinear Optical Physics and Materials, 16, 359-366. [23] Taylor, A.J. and Vadgama, P. (1992) Analytical reviews in clinical biochemistry: the estimation of urea. Annals of Clinical Biochemistry, 29, 245-264. [24] Fossati, P., Prencipe, L. and Berti, G. (1980) Use of 3,5-dichloro-2-hydroxybenzenesulfonic acid/4-amino- phenazone chromogenic system in direct enzymic assay of uric acid in serum and urine. Clinical Chemistry, 26, 227-231. |